From the inconvenient data department and the IEA comes this press release.
Despite widespread expectations of another increase, global energy-related carbon dioxide emissions stopped growing in 2019, according to IEA data released today.
After two years of growth, global emissions were unchanged at 33 gigatonnes in 2019 even as the world economy expanded by 2.9%. This was primarily due to declining emissions from electricity generation in advanced economies, thanks to the expanding role of renewable sources (mainly wind and solar), fuel switching from coal to natural gas, and higher nuclear power generation. Other factors included milder weather in several countries, and slower economic growth in some emerging markets.

“We now need to work hard to make sure that 2019 is remembered as a definitive peak in global emissions, not just another pause in growth,” said Dr Fatih Birol, the IEA’s Executive Director. “We have the energy technologies to do this, and we have to make use of them all. The IEA is building a grand coalition focused on reducing emissions – encompassing governments, companies, investors and everyone with a genuine commitment to tackling our climate challenge.”
A significant decrease in emissions in advanced economies in 2019 offset continued growth elsewhere. The United States recorded the largest emissions decline on a country basis, with a fall of 140 million tonnes, or 2.9%. US emissions are now down by almost 1 gigatonne from their peak in 2000. Emissions in the European Union fell by 160 million tonnes, or 5%, in 2019 driven by reductions in the power sector. Natural gas produced more electricity than coal for the first time ever, meanwhile wind-powered electricity nearly caught up with coal-fired electricity. Japan’s emissions fell by 45 million tonnes, or around 4%, the fastest pace of decline since 2009, as output from recently restarted nuclear reactors increased. Emissions in the rest of the world grew by close to 400 million tonnes in 2019, with almost 80% of the increase coming from countries in Asia where coal-fired power generation continued to rise.
Across advanced economies, emissions from the power sector declined to levels last seen in the late 1980s, when electricity demand was one-third lower than today. Coal-fired power generation in advanced economies declined by nearly 15% as a result of growth in renewables, coal-to-gas switching, a rise in nuclear power and weaker electricity demand.

“This welcome halt in emissions growth is grounds for optimism that we can tackle the climate challenge this decade,” said Dr Birol. “It is evidence that clean energy transitions are underway – and it’s also a signal that we have the opportunity to meaningfully move the needle on emissions through more ambitious policies and investments.”
To support these objectives, the IEA will publish a World Energy Outlook Special Report in June that will map out how to cut global energy-related carbon emissions by one-third by 2030 and put the world on track for longer-term climate goals.
The Agency will also hold an IEA Clean Energy Transitions Summit in Paris on 9 July, bringing together key government ministers, CEOs, investors and other major stakeholders from around the world with the aim of accelerating the pace of change through ambitious and real-world solutions.
Dr Birol will discuss these results and initiatives tomorrow at a special IEA Speaker Series event at IEA Headquarters in Paris with energy and climate ministers from Poland, which hosted COP24 in Katowice; Spain, which hosted COP25 in Madrid; and the United Kingdom, which will host COP26 in Glasgow this year. More details on the IEA event, including how to watch a live webcast, are available here.
Why is it good news that our atmosphere, which according the Dr. William Happer is in a CO 2 deficit has stopped increasing. Life on earth needs more CO 2 not less.
It could be seen as Good IF it can indicate that their preferred direction can be attained without Draconian Measures and a Complete Destruction of the Modern Industrial Society.
Capitalism Works!!!
Give me a break. Economic contraction does not equal total economic destruction. Also if you had to, would you really choose more dollars in your bank account over a livable environment?
Ten percent of the world still lives in extreme poverty, largely because these people lack access to cheap and reliable electricity. Economic growth lifts people out of poverty, reduces starvation and disease and leads to longer, more productive and happier lives.
What’s unlivable in the environment? Poverty and disease has fallen to new lows, wealth for all has increased. Populations are better informed (save NYT readers) and there’s more democracy than ever. Planet is greener too. Buck up!
Dave
The post did not address atmospheric CO2 content. It speaks of emissions. Changing the rate of emissions does not cause the rate of atmospheric CO2 growth to change (https://tambonthongchai.com/2018/12/19/co2responsiveness/ ). All the fuss is about emissions because the IPCC has erroneously concluded that our emissions are the sole cause of rising atmospheric content. If that were so the link I just gave you would not exist. Salby’s video at (https://edberry.com/blog/climate/climate-physics/what-is-really-behind-the-increase-in-atmospheric-co2/) gives further analysis showing that nearly all of the rise in CO2 is natural and human additions are about 3% of the total content.
DMA,
Just curious…
Would you happen know by how much the Total Content of atmospheric CO2 increases on an annual basis?
The total in the (ppm rise) coming from human activity is about 31 ppm so far. Therefore it rises about 0.25 to 0.5 ppm per year (net) as a result of “us”.
Note there are several ways to report emissions: total from all sources, net increase and contribution to that net increase from our activities.
Suppose we create a net increase of 0.333 ppm and it is rising at 2 ppm. We are responsible for 1/6 th of the increase and 5/6 ths is natural. As far as I can tell, it is 100% beneficial.
If sea level rise is caused by global warming, and it is 1.8 mm/ year we cause 0.3mm of it.
Claims otherwise need proof otherwise.
I like your numbers
He said that this news is bad for alarmists, because it under cuts their demands for even more power and money.
The same people who demand reduced emissions, then see a reduction of emissions will say that is “bad news”.
Down the rabbit hole.
Your character in World of Warcraft is called Loydo the Gullible.
Breath of life 40,000 ppm. (rescue breaths).
What a human can tolerate for a few minutes has nothing to do with what’s good for all the world’s life for a long period of time.
In fact, less than an hour at 40,000 ppm would make a human seriously ill (e.g., tremendously bad headaches, nausea)…and could even be lethal to someone who is in poor health.
https://www.health.state.mn.us/communities/environment/air/toxins/co2.html
I taint breaking out the champagne over this report.
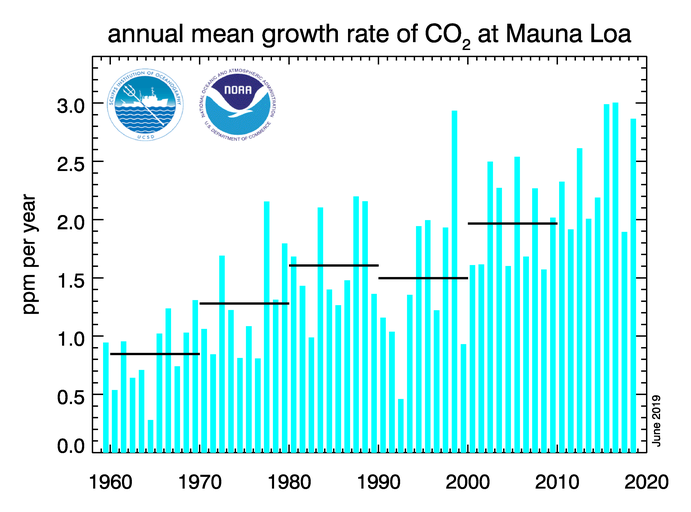
So the CO2 increase at Mauna Loa should stop rising.
That’s not going to happen, but nobody is able to explain why.
Ooooops!
Don’t use that Logic and empirical observation thing to try and complicate the issue. We need to bow down to St. Greta and thank the god’s of CO2 that humanity is moving in the right direction.
Oh, please, please can someone ask Gavin why CO2 went up when emissions were flat.
… “global energy-related carbon dioxide emissions stopped growing”…
They’re just pulling what they believe to be the man-made part of the CO2 level out.
2011-2014 emissions pretty flat too and didn’t impact Mauna Loa CO2 trend.
Interesting!
Because Gavin keeps talking…
Emissions did not rise, but they continued. If, indeed, the rise in CO2 levels is due to human activity, it should continue to rise at a steady rate if the rate of emissions stabilizes at the current rate. Unless:
The Earth may have ways to increase the consumption of CO2, hence the rate it is removed from the atmosphere. And those ways may take time to occur. So, for example, if the demonstrated “Greening of the Earth” involves more consumption of CO2 by plants, this may mitigate the rate of CO2 rise.
Time will tell.
Even if rate of CO2 emission decreased, the level of CO2 in the atmosphere will continue to increase as long as the emissions continue to exceed removal. The level of CO2 is expected to keep increasing until drastic mitigation is instituted.
I do not think it follows logically that because the rate of increase of CO2 emissions has flatlined or even decreased slightly, that the amount in the air will stop increasing.
We used to produce far less, and the growth of the amount in the air was not much different.
IOW…we are still adding CO2 to the air, so unless the Earth is now able to absorb all of what we emit, the concentration will still go up.
So stop being so gloomy.
Plant food is still gonna go up.
It’s not wrong. The comment said that the increase should stop rising. This means no acceleration. That should certainly happen. I suspect a bit of a deceleration should occur.
All of that presumes accusato reports of emissions, which I doubt.
Was there ever any acceleration?
Yes.
Wait, you’ve been posting here every day for how many years and you didn’t know that? lol
That does not look like accelerating, increasing yes, but not accelerating. It also looks fairly linear and NOT exponential as you claimed before.
You too Patrick? That is a graph of the rate. An increasing rate IS accelleration.
“Loydo February 14, 2020 at 12:47 am
You too Patrick? That is a graph of the rate. An increasing rate IS accelleration.”
Not it does not.
Safe to say , that once the impacts of the coronavirus on Chinese industrial output are felt, global emissions will drop more this year.
All else being equal, shouldn’t atmospheric CO2 keep rising at around the same rate as the preceding year? I think you might be confusing stocks with flows.
Rubbish, Just ask Al Gore to stand at the rim of the World’s largest & most active volcano, in a similar vane to King Canute, & simply demand the emissions stop! Job done, simples! 😉 AtB PS if this unlikely event occurs, any idea on how big the queue would be & how much the applicants’ tickets would be to give that last little shove? AtB 😉
Martin Cropp – February 13, 2020 at 12:48 pm
“So the CO2 increase at Mauna Loa should stop rising.
That’s not going to happen, but nobody is able to explain why.”
Martin, you have not been listening to the right people.
When the average temperature of the ocean surface water stops increasing, atmospheric CO2 will stop rising.
Samuel
All explanations about what will happen regarding CO2 are pure speculation. There are no right people, just theorists.
Regards
Martin
Martin Cropp – February 15, 2020 at 2:32 am
Martin C,
The following data is not “speculation”, …… it is science “FACT” as best can be measured/recorded, to wit: (please take note of the ”yearly average increases” in CO2 ppm in the following)
Maximum to Minimum yearly CO2 ppm data – 1979 to May 2019
Source: NOAA’s Mauna Loa Monthly Mean CO2 data base
@ ftp://aftp.cmdl.noaa.gov/products/trends/co2/co2_mm_mlo.txt
1979 – 2019 YTD CO2 — “Max” ppm @ mid-May (5) … “Min” ppm @ end of Sept (9)
year mth “Max” _ yearly increase ____ mth “Min” ppm
1979 _ 6 _ 339.20 …. + ….. El Niño ___ 9 … 333.93
1980 _ 5 _ 341.47 …. +2.27 _________ 10 … 336.05
1981 _ 5 _ 343.01 …. +1.54 __________ 9 … 336.92
1982 _ 5 _ 344.67 …. +1.66 El Niño __ 9 … 338.32 El Chichón
1983 _ 5 _ 345.96 …. +1.29 _________ 9 … 340.17
1984 _ 5 _ 347.55 …. +1.59 __________ 9 … 341.35
1985 _ 5 _ 348.92 …. +1.37 _________ 10 … 343.08
1986 _ 5 _ 350.53 …. +1.61 _________ 10 … 344.47
1987 _ 5 _ 352.14 …. +1.61 __________ 9 … 346.52
1988 _ 5 _ 354.18 …. +2.04 __________ 9 … 349.03
1989 _ 5 _ 355.89 …. +1.71 La Nina __ 9 … 350.02
1990 _ 5 _ 357.29 …. +1.40 __________ 9 … 351.28
1991 _ 5 _ 359.09 …. +1.80 __________ 9 … 352.30
1992 _ 5 _ 359.55 …. +0.46 El Niño __ 9 … 352.93 Pinatubo
1993 _ 5 _ 360.19 …. +0.64 __________ 9 … 354.10
1994 _ 5 _ 361.68 …. +1.49 __________ 9 … 355.63
1995 _ 5 _ 363.77 …. +2.09 _________ 10 … 357.97
1996 _ 5 _ 365.16 …. +1.39 _________ 10 … 359.54
1997 _ 5 _ 366.69 …. +1.53 __________ 9 … 360.31
1998 _ 5 _ 369.49 …. +2.80 El Niño __ 9 … 364.01
1999 _ 4 _ 370.96 …. +1.47 La Nina ___ 9 … 364.94
2000 _ 4 _ 371.82 …. +0.86 La Nina ___ 9 … 366.91
2001 _ 5 _ 373.82 …. +2.00 __________ 9 … 368.16
2002 _ 5 _ 375.65 …. +1.83 _________ 10 … 370.51
2003 _ 5 _ 378.50 …. +2.85 _________ 10 … 373.10
2004 _ 5 _ 380.63 …. +2.13 __________ 9 … 374.11
2005 _ 5 _ 382.47 …. +1.84 __________ 9 … 376.66
2006 _ 5 _ 384.98 …. +2.51 __________ 9 … 378.92
2007 _ 5 _ 386.58 …. +1.60 __________ 9 … 380.90
2008 _ 5 _ 388.50 …. +1.92 La Nina _ 10 … 382.99
2009 _ 5 _ 390.19 …. +1.65 _________ 10 … 384.39
2010 _ 5 _ 393.04 …. +2.85 El Niño __ 9 … 386.83
2011 _ 5 _ 394.21 …. +1.17 La Nina _ 10 … 388.96
2012 _ 5 _ 396.78 …. +2.58 _________ 10 … 391.01
2013 _ 5 _ 399.76 …. +2.98 __________ 9 … 393.51
2014 _ 5 _ 401.88 …. +2.12 __________ 9 … 395.35
2015 _ 5 _ 403.94 …. +2.06 __________ 9 … 397.63
2016 _ 5 _ 407.70 …. +3.76 El Niño __ 9 … 401.03
2017 _ 5 _ 409.65 …. +1.95 __________ 9 … 403.38
2018 _ 5 _ 411.24 …. +1.59 __________9 … 405.51
2019 _ 5 _ 414.66 …. +3.42 __________9 … 408.50
La Nina – El Nino index: https://ggweather.com/enso/oni.htm
The above data is proof-positive of an average 5 to 6 ppm decrease in CO2 that occurs between mid-May (5) and the end of September (9) of each calendar year …… and that there is an average 7 to 8 ppm increase in CO2 that occurs between the end of September (9) and mid-May (5) of the next calendar year as denoted on this modified copy of the Keeling Curve Graph, to it:
http://i1019.photobucket.com/albums/af315/SamC_40/keelingcurve.gif
And the average “annual increase” of 1 to 2 ppm in CO2 is a direct result of the ocean water warming up following the end of the LIA. El Ninos, La Ninas and volcanic eruptions also effect the ocean water’s outgassing/ingassing of atmospheric CO2 measurements.
Here is also “plotted” scientific proof, to wit:
1979-2017 UAH satellite global lower atmosphere temperatures & CO2 ppm data
https://c3headlines.typepad.com/.a/6a010536b58035970c01b7c92d93fa970b-500wi
Hi Samuel
Thanks for charts, seen them many times. Time will tell….
Here is an interesting site for your interest with charts that show some great detail. Note that the high latitude sites have a flat peak, that is the max CO2 dies not increase over the heaviest part of winter in the NH, when human and biosphere emissions are greatest. There is a good reason for this that allowed me to make the original statement.
The far NH sites measure what is coming from the continent mainly of East Asia – Europe. What they are measuring is the constant atmospheric ingress for the eurasain continent.
Enjoy and Regards
http://3.bp.blogspot.com/-35ri2O1Rcwg/T1-4B5ZhdQI/AAAAAAAAAbI/iObWOmv2SlI/s1600/CO2+cycles+N_S.jpg
From here
http://dougrobbins.blogspot.com/2012/03/keeling-curve-and-seasonal-carbon.html
http://2.bp.blogspot.com/-akHjCh4bP_k/T2WcOMMpoLI/AAAAAAAAAcY/KtwsdN_k3P8/s1600/CO2+cycles+5.jpg
http://3.bp.blogspot.com/-ZMkaxcW_j1k/T5JtFd088eI/AAAAAAAAAho/5TDkn9rISqA/s1600/Relative+Cycles+57_07.jpg
Martin Cropp – February 15, 2020 at 9:43 pm
Martin C,
You haven’t seen the above chart “many times” ….. because I haven’t posted it very many times.
Unless of course, ….. you have looked at the above chart “many, many times” …… trying to figure out what the el it is telling you.
The ONLY way it cannot rise is that our planet’s oceans are cooling. This must be caused by Climate Change, whatever that means. We must now destroy capitalism to warm our oceans.
Rise in nuclear. Say what?
Well OK. It is obviously be done on the q.t. because nobody’s trumpeting the news.
As far as I can tell, the economy is doing OK around here. There are lots of articles stating that President Trump’s trade war is starting to bite. example Werrry interestink!
The COVID-19 debacle might have more to do with an upcoming short-term slump in the economy than the tariffs. Air travel for example, especially in Asia, has dropped tremendously. Hong Kong had 127,400 arrivals on Jan 24th and just 2,751 on Feb 12. That’s only 10 large aircraft’s worth of passengers. All kinds of parts shortages are going to be a really big issue if this goes on for a while.
The flip side of this, imo, is the US/Canada manufacturing base is going to seriously look at insourcing which ultimately would boost the domestic economies. The bad news it will take a while to get it going.
In the meantime we are a very adaptive people and should weather this better than China. Will be interesting to see how badly it hits them and how it impacts their energy use. In the meantime we will be enjoying lower energy prices.
CB – I thought the same thing but if you read the IEA release, it says that Japan re-started their nukes. Quite possibly China has some new nukes that they aren’t talking about.
Unless they are building them underground, I doubt they would be able to hide any nukes from the spy satellites.
”In China, emissions rose but were tempered by slower economic growth and higher output from low-carbon sources of electricity. Renewables continued to expand in China, and 2019 was also the first full year of operation for seven large-scale nuclear reactors in the country.“
Seven. Large Scale. Nuclear.
“This was primarily due to”…….China……” Emissions in the rest of the world grew by close to 400 million tonnes in 2019, with almost 80% of the increase coming from countries in Asia where coal-fired power generation continued to rise. ”
I’m so sick of this BS……..all of the decrease in CO2 is coming from us
…all of the increase is coming from them
and not one single liberal whack job…or media….is blaming them for it
Yes, we are exhorted based on the actions of others. My favorite example is plastic in the ocean. The vast majority of the plastic in the ocean comes from ten rivers, none of them in North America or Europe. link SJWs have no sense of fairness. That’s their MO. They damn people for issues where the people, quite rightly, think they have been doing a good job.
If windmills and solar are so good….China is ground zero for making that crap
…and they go coal
blaming us…WE have to convert to wind and solar
The alleged 90% of plastic comes from 10 rivers meme strikes again 🙂
Not true.
90% of river borne plastic into the ocean may come from10 rivers, but that is not the majority of plastic entering the ocean.
Even the quoted article makes that clear when you read more than the headline:
A staggering eight million metric tons wind up in oceans every year, and unraveling exactly how it gets there is critical. A recent study estimates that more than a quarter of all that waste could be pouring in from just 10 rivers, eight of them in Asia.
So no one knows where it is coming from, but they know how much it is?
That makes zero sense.
One study is one study. It is not a fact…it is someone’s assertion.
And the assertion is only an estimate of a lower limit.
In fact most such statistics are simply made up by someone out of thin air, and it is usually the case that the person doing it has an agenda.
Like the little kid who invented the stat everyone now uses for how many straws get made, disposed of in the ocean, etc.
Basically they assume that all the plastic that is made, ends up in the oceans eventually.
A recent study. One.
Estimates that. An estimate.
More than. That is not a number, and how sure are they?
Could be pouring. Could be. Not is. Could be.
Contrary to your assertion that anything here is clear, the quote you give makes it obvious people can make stuff up and other people will latch onto it and swear to it.
If you are white, wealthy and western, you are guilty.
We’ll decide of what, after the trial.
trial? we don’t need no stinking trial! we know white, wealthy and western are guilty – no trial needed so we can skip to the punishment of those guilty SOBs deserve!!!!
(I only wish a sarc tag was needed).
commieBob, SJWs have no sense! That’s the best I could do with my limited tech skills! They also have little knowledge and less wisdom as displayed in their angry, emotional rants!
They may have no sense but they have plenty of nonsense.
Latitude, blaming us…WE have to convert to wind and solar –> WE don’t need no wind & solar due to declining emissions from electricity generation in advanced economies, thanks to advanced flue gas Purification.
This was primarily due to declining emissions from electricity generation in advanced economies, thanks to advanced flue gas Purification.
I keep hearing from renewable energy promoters that wind and solar are now cheaper or comparable in cost to fossil fuels. So if that’s true, why are India and China and even Japan building more coal power plants?
And… how do some of you put quotes in nice boxes? Adding HTML code?
Yes, html
< blockqote > quoted text < /blockqote >
There’s a Test page with all kinds of good hints and where you can try stuff.
BTW did you deliberately misspell blockquote?
Oh, bad….. sorry left the “u”, and without spaces, o.c. 🙁
… and then left out the “out” 🙂
If he hadn’t misspelled it, the page would have tried to process it.
No, because I didn’t type the brackets but used the html code for them. It was a typo, and it isn’t easy to type on my mobile from time to time.
Joseph Zorzin February 13, 2020 at 1:08 pm
I keep hearing from renewable energy promoters that wind and solar are now cheaper or comparable in cost to fossil fuels. So if that’s true, why are India and China and even Japan building more coal power plants?
– India and China and even Japan are building more coal power plants thanks to declining emissions from electricity generation in advanced coal power plants, thanks to advanced flue gas Purification.
Dave has it exactly right. I am fine with more nuclear and switching to natural gas, but co2 is not harmful and more of it is needed to green the earth. Even if it warmed the earth by a small amount the benefits would overwhelm the costs, but it doesn’t do that in any measurable way.
More green plants is good but I sure wish CO2 killed wild blackberries.
Heathen!! Wild blackberries are 10 times better for taste than the cultivated ones. I know, I know, the thorns on those things so annoying they make rose thorns look tame but nothing a machete and some extra thick clothing can’t take care of. That or a bit of gasoline and some matches (just have a fire extinguisher handy, LOL).
Yes, but like most things they are an invasive species in North America. The are pushing out and causing problem for native species. That were most extinctions come from.
Blackberries are a big non-native problem of a lot of Australian land.
They were originally introduced from Europe by Baron Sir Ferdinand von Mueller, who was the top man at the Royal Botanic Garden, Melbourne.
Some might deduce another example of the fallibility of scientific authority.
There are many species of blackberries-some are native to North America and some are not: https://www.quora.com/Where-are-blackberries-native-to-and-how-did-they-get-to-the-USA-and-Canada
They often spring up after timber harvesting and other disturbances but eventually they die back as the trees grow back.
How long does an invasive sub-species have to be present before it becomes native?
I have thornless variant
theyr just as invasive but utterly tasteless too
oddly every wild blackberry I have tried to grow dies, ones taken from areas people have been trying to poion etc for years die for me not a problem;-/
but the useless ones are doing too well;-(
They are only begging to be trained; I recommend 6’ T-posts with galvie fencing wire. Then use a propane tank blow torch to get rid of the runners. Works good for weeds, too, and adds a little more beneficial life gas to boot! Blackberry shortcake or cobbler or pie; what a treat!
Back on Monday, when analysts and investors were desperately seeking clues whether China has managed to reboot its economy from the 2-week long hiatus following the Lunar New Year/Coronavirus pandemic amid the information blackout unleashed by the communist party in the already opaque country, we pointed out some alternative ways to keep tabs of what is really taking place “on the ground” in China, where Xi Jinping has been urging local businesses and workers to reopen and resume output, while ignoring the risk the viral pandemic poses to them (with potentially catastrophic consequences).
Specifically, Morgan Stanley suggested that real time measurements of Chinese pollution levels would provide a “quick and dirty” (no pun intended) way of observing if any of China’s major metropolises had returned back to normal. What it found was that among some of the top Chinese cities including Guangzhou, Shanghai and Chengdu, a clear pattern was evident – air pollution was only 20-50% of the historical average. As Morgan Stanley concluded, “This could imply that human activities such as traffic and industrial production within/close to those cities are running 50-80% below their potential capacity.”
https://www.zerohedge.com/economics/china-has-ground-halt-ground-indicators-confirm-worst-case-scenario
Limiting the CO2 at around 400pp even if it ca be done is stupid, attempting to reduce the CO2 to postindustrial level of 280ppm would be homicide, fortunately whatever idiotic scheme is attempted it will not succeed.
preindustrial
If they succeeded it would be postindustrial.
This is an estimate, I have my doubts, the IEA is another source of RE puffery and this looks like cheering encouragement to ‘keep going’, the push to RE is working!
As others have said the acid test will be the effect if any on the measured atmospheric CO2 concentration trend.
Yeah, amazing how that RE “revolution” really only “works” when lots of coal gets switched out for gas and nuclear.
‘preindustrial’
The plants don’t like this news. Lucky for the environmentalists the plants can’t vote.
At this rate, we will not all be dead in 12 years. Warmunists must be very disappointed at this news. They already had their popcorn on order for the event.
World Ends Today At 2:37 GMT!!
Women and Minorities Hardest Hit!
Orange Man clearly to blame.
Tune in tonight for full story. Film at 11:00
From the article: “The United States recorded the largest emissions decline on a country basis, with a fall of 140 million tonnes, or 2.9%. US emissions are now down by almost 1 gigatonne from their peak in 2000.”
Trump says, “Who needs Paris?”.
From the article: “Emissions in the European Union fell by 160 million tonnes, or 5%, in 2019 driven by reductions in the power sector.”
Yeah, driven by reductions in the power sector flollowed by reductions in the economy.
The U.S. is going full speed ahead with its economy and reducing production of CO2 at the same time, while Europe’s economy is on the edge of a recession, which is attributable in large part to energy policy which raises prices and drives businesses to seek a more friendly business climate.
The other Western Democracies should follow Trump’s example if they want to be succesful. If you want to be a winner, do what winners do.
The Britain have well done, so far.
Not a bad idea
At what cost?
When will they all need to be replaced?
How much will that cost?
How many dead birds, bats, and insects?
How many trees cut down?
How many people who have their peace and quiet ruined forever, have all sorts of health problems from lack of proper sleep, flickering lights and movement, infrasound damage…?
I am willing to bet many disagree with your assessment of them having “done well”.
Merkel fears a Singapore like GB
“At what cost?”
Exactly!
Yep and they had a major blackout when the wind did not blow. Think about that economy cost to that.
A “Professor emeritus of Labour Studies”, not content with putting words into the PM’s mouth wants to tell us what the PM is thinking. It is a blessing, I suppose, that he is no longer a professor teaching this nonsense.
He did not explain in his article why the UK should tie itself to the one economic area in the world that is not growing when the rest of the world is. (Apparently even Antarctica has faster economic growth than the EU at present. Must be all those “scientists”)
More likely driven by a reduction in the creation of solar and wind generation capacity. Those things requires massive amounts of energy to produce.
Couldn’t be a reason of the CO’2 decrease in the USA be due in parts by the green agenda some states have ?
Nope. NatGas replacing coal at 40% of the CO2 is the reason. Check out how much electricity California gets from Mexico. LOL. “Green states”? States of mind maybe but not in reality.
NG also reduces real pollutants (NOx, SO2, mercury, particulates) by a huge margins. And the NG turbines are much more flexible in dealing with peak load and on and on. Just excellent all around.
Frac. on baby.
No cause for celebrations yet. Don’t forget, the bedwetters don’t just want no more emissions, they demand that we REMOVE the life-giving gas from the atmosphere.
Is the IEA trying to make it sound like its exhortations are having something to do with the leveling off? Sounds like they are trying to cop some credit, or stay relevant. Like Climate Scientists, and the Lewandowski’s and Oreske’s of the world.
Couild it be the result of all those uncooked and nearly raw bats, rats, possums, toads and snakes as eaten and consumed by the all the backward, primative and tribal Chinese? This is not 535 BC anymore, you can’t keep that kind of stuff hidden, covered-up and concealed in the 21st Century. Are they keeping us from being broiled and fried in just 12 years while killing us all with Hogfluenza?
WUWT???
Nothing is going to stop us from doing the big CO2 experiment. The developing world is going gangbusters into coal fired electricity. China and India CO2 growth alone will completely swamp any foolish CO2 knockdown by Europe, Canada, Australia, etc. Will doubling up on coal use warm us up or not? We will have the answer to this question and I sense that that is the most unsettling prospect for the settled sciencey folk and why they need a policy success so urgently before the truth comes out. To have facilitated the waste of $trillions and caused the deaths of multimillions needlessly would be hard to recover from.
I know many readers and the alarmist sector don’t like to hear this, but with the US withdrawal from the Paris Agreement this is simply dead and they know it. If America doesn’t go along it doesn’t go. Many decades of marxbrothers economics in Europe has resulted in the wipeout of “other peoples’ money” there and the only source for Assisted Economic Suicide funding is to bring the US into it.
What we are hearing now about Europe going it alone, assisted by promises of lefty city and state administrations in the US and the Democrats in general is all their trademarked fake news. The Democrats are out of business for a generation by which time new blood anxious to participate in making America great again will be rebuild the party. Yeah, its all over with folks.
According to the first graph, man’s emissions increased little over most of the last decade – far less than during the preceding two decades, when they increased steadily. Now see if you can spot a corresponding effect on the growth of atmospheric CO2…
https://papers.ssrn.com/sol3/papers.cfm?abstract_id=2997420
https://youtu.be/b1cGqL9y548?t=41m52s
Thank you Boris and Co: Down the rabbit hole!
And yet there was no change in the rate of atmospheric CO2 increase.
I am incompetent in this subject, but if I remember well, I read somewhere thart the CO2 emission by humans is only 3 or 4 % of the natural emision (from volcanoes, lakes, termites, etc.). So, what importance to reduce those 3-4 % to zero?
“So, what importance to reduce those 3-4 % to zero?”
Until we started adding it, natural CO2 sources were roughly in balance with natural sinks so the concentration has been pretty steady for millennia.
Our 3-4% has been accumulating for decades (well about half of it has, the other half has been absorbed and is no longer airborne) and has driven the atmospheric CO2 concentration up from about 280ppm to 414ppm, closing in on a 50% increase. Some here will say that is a good thing, but they are almost certainly mistaken as most scientists with expertise in related fields are rightly alarmed at this abrupt change and would strongly disagree with that.
Loydo, you might want study some geologic history before you make any more silly statements about CO2 levels. CO2 fell to near death levels for plants during the last period of glaciation and the start of the modern rise we are experiencing now only started once the planet warmed into the current interglacial. The decline in CO2 has been fairly steady for the last 150,000,000 years so I doubt the causes have disappeared! During the next interglacial we can expect levels to drop as low or lower which could cause a massive die-off of both plants and animals! Are you trying to kill off life on Earth or just denying the geology?
If CO2 increased slowly that may well be a good thing, but its the rate AM. Where in the geological record has CO2 concentration risen so rapidly?
Who says?
Who says what?
“Loydo February 13, 2020 at 10:08 pm
If CO2 increased slowly that may well be a good thing, but its the rate AM. Where in the geological record has CO2 concentration risen so rapidly?”
Who says?
Look at increases in the Permian or Jurassic; both are very rapid compared to today’s blip.
Loydo believes. Don’t try to educate him, he don’t want your stinkin facts.
So, emit 97 (in any units) by nature is OK, but emit 100 would be catastrophic? I don’t understand.
Absorb 100 each year but emit 103. After 200 years you see changes.
So nature can absorb 100, but not 103?
Bullshit. They are not measuring the natural sources or sinks, and therefore that is nothing more than an assumption. And the ice core reconstructions don’t reflect the atmospheric CO2 amount accurately, since ice cores have some serious attenuation issues. While they reflect the timing of rises and falls, the degree of variation is understated – which is of course why the Eco Fascists love to use ice core reconstructions of CO2 amount as their “record” of choice (while willfully ignoring the FACT that those same records show temperature driving CO2 and not the other way around).
Comparing ice core reconstructions of CO2 amount to Mauna Loa atmospheric measurements of CO2 amount is like comparing a piece of wood that measures 8 feet long (as measured by the “feet” of a pygmy 150 years ago) with a piece of wood that measures 8 feet long (as measured by a ruler today), and blaming human fossil fuel use for the difference in length.
More bullshit. Same incorrect assumption based, in turn, on the same garbage ‘pygmy feet to ruler feet” comparison. This “human CO2 is the only thing that causes atmospheric CO2 to change” nonsense does nothing more than ASSUME that the UNMEASURED sources and sinks have not changed by an amount sufficient (i.e., very little) to swamp our 3-4% pittance of emissions.
Bullshit. I presume you know all of those “scientists with expertise in related fields?” LOL appeals to authority mean nothing. The SUPPOSED rate of change has been exceeded in the past long before you could blame human fossil fuel use for it, and said SUPPOSED rate of current change is based on the same “pygmy feet vs. ruler feet” CO2 level “difference” that overstates the change and understates historical variability. And nobody should be “alarmed,” rightly or wrongly, about a small and ENTIRELY BENEFICIAL INCREASE in the “average” temperature.
I doubt if anyone is making measurements – they’re most likely calculating the emissions based on GNP. In other words, either they revised the model, and/or the world economy is slowing, and/or the oceans are cooling..
Anthony and/or moderator, is it possible to post the graph titled: Global Temperature and Atmospheric CO2 over Geologic Time? Is it already available here or is there a link to it? I would happy to help with any costs involved as I think it is one of the most edifying pieces of evidence against CAGW!
Drs. Tim Ball and Patrick Moore have both used it in their work and I usually go to geocraft.com to see a larger version for study. It seems to pretty well debunk the idea that our current CO2 level is anything unusual or dangerous so I’d like to refer others to it if possible.
Don’t bother, that graph fails to show (amongst other things) that the sun has warmed significantly since the Precambrian. Google ‘faint young sun paradox’ to see how things are way more complicated than a simple graph showing temperatue vs CO2 level might indicate.
“……the sun has warmed significantly since the Precambrian.”
Agreed. So it is definitely the sun that is responsible for ‘Global Warming’ and not CO2!
But it was warmer back in the Precambrian when the sun was weaker. Lol, anything but CO2.
We know we don’t have to go back that far to determine it was warmer when CO2 was lower. There is a period called the “Holocene Thermal Optimum”, a scientific fact, that shows it was warmer 10,000 years ago and has been getting steadily cooler.
Have you not heard of the Ordovician?
CO2 > 2 000 ppmV
Temperature (ice age) < Present day temperature.
Selective drivel or logical disconnect?
Loydo,
The “weak sun” argument is very controversial particularly after Berner et al 2001 which apparently shows a 140 million year trend of decreasing CO2 over the Phanerozoic period.
See also J.Veizer et al (2000) in Nature.
Even the late Stephen Schneider was not definitive on the topic.
See “CO2 and Climate Change -Crowley and Berner”292 (5518) in Nature Magazine (2003).
He seeks to adhere to CO2 as the driver but says,
“To weigh the merits of the CO2 paradigm, it may be necessary to expand the scope of climate modelling.For factors responsible for the presence or absence of continental ice, the CO2 model works very well. In contrast there are substantial gaps in our understanding of how climate models distribute heat on the planet in response to CO2 changes on tectonic time scales.”
D.L.Royer et al (2004) was then in preparation and sought to rebut Berner 2001.
It is not the end of the topic and interestingly that paper opens with the claim that the Residence Time for CO2 is ~ 4 years!
Herbert agreed, the point I was making above “things are way more complicated than a simple graph showing temperatue vs CO2 level might indicate.”
Has your power been restored recently?
Over the past 60 years…no correlation:
https://c3headlines.typepad.com/.a/6a010536b58035970c01b7c6de0d93970b-pi
At the longest time scales, CO2 and temp have fluctuated with zero discernable correlation.
CO2 was often many times higher than the present levels, and temp was almost always warmer, but sometimes far colder. CO2 simply does not correlate at long time scales either.
https://c3headlines.typepad.com/.a/6a010536b58035970c01156fc1fc0b970c-pi
In fact the only scale where we can see any clear correlation is on the scale of the Antarctic ice core complete record of several hundred thousand years.
And at this scale, it could not be more obvious…CO2 responds to temperature change. It lags, and never leads.
And even at this scale, there are periods with drastically different temps when CO2 was the same. And vice versa.
No matter how you slice it, the only place these two parameters are correlated in a way which is causal for CO2 warming the planet…is in the overactive imaginations of the warmistas and in their made up models into which they have programmed it.
Loydo, you really will serve us a “Carl Sagan and friends [ ] proposal that the Earth’s atmosphere at that time must have been rich in carbon dioxide and that the consequent greenhouse effect was responsible for the warming.”
Dashing, loydo!
____________________________________
Imagehttps://www.technologyreview.com › …
A Solution to the Faint Young Sun Paradox – MIT Technology Review
2 Apr 2010
· This problem, known as the faint young Sun paradox, has troubled astronomers since the 1970s, when it was pointed out by Carl Sagan and friends. He proposed that the Earth’s atmosphere at that time must have been rich in carbon dioxide and that the consequent greenhouse effect was responsible for the warming.
https://www.google.com/search?q=faint+young+sun+paradox&oq=faint+young+sun+paradox&aqs=chrome.
Loydo February 13, 2020 at 10:33 pm commented “…Google ‘faint young sun paradox’…”
Earth’s ice ages are due to the recent tectonic uplifts and resulting glaciations which reflect sunlight back into space, especially the uplift of the Himalayas near the equator.
The earth 300 million ago was relatively featureless and its seas shallow. Google “geocraft Climate during the Carboniferous Period”. As ocean trenches developed, so did the mountains. For example, the Andes rose significantly and the Amazon basin formed during the late Cenozoic beginning 34Ma. Google “Uplift of the Central Andean Plateau and Bending of the Bolivian Orocline” and “The Late Miocene paleogeography of the Amazon Basin and the evolution of the Amazon River system”. The age of the basement basalt layer of the Mariana Trench is only ~49Ma. Google “Age of Izu–Bonin–Mariana arc basement”.
The ‘faint young sun paradox’ explains the earth’s climate “Billions and Billions…” of years ago.
Abolition Man,
“… is it possible to post the graph titled: Global Temperature and Atmospheric CO2 over Geologic Time?”
There are numerous ways to post stuff here.
It used to be that anyone could post a link to a properly formatted file of a graph or photo, and it would post in your comment as the graph or photo. At some point that stopped working.
Some people apparently know some secret way to make it work still, and I read a few weeks back a post from Anthony that he is working on upgrading the functionality of the site including, IIRC, making this possible again.
In the mean time, go to the top of the site page and look for the tab that says “Reference Pages”.
One is a paleoclimate page. It has a ton of graphs and at least some of them are CO2 vs temp graphs at various time scales.
And there are numerous time scales to consider.
The longest one is called by some the “paleo” record.
It is on the order of hundreds of millions of years.
There are several versions in circulation, and the best one is the original that has a shaded region showing the uncertainty bands of the CO2 concentration.
Here is a link to my Twitter page where I just retweeted it to put it right up top…I have a zillion charts and graphs posted on Twitter, and looking at the media tab on my page lets you skip text tweets and look at most of the ones that are videos or pictures or charts.
This one Tweet has three graphs…the paleo record, one that shows the past 11,000 years or so, and one that shows the years 1895-2011, and has both temp and CO2 in a form which is not scaled to make a tiny number change look huge, for temp, and does not scale the CO2 graph so it matches the temperature anomaly graphs, which is just lying with graphs when someone does that.
Here:
https://twitter.com/NickMcGinley1/status/1184169134701060097?s=20
Right below that is a tweet with the ice core record from Vostok, Antarctica.
It has CO2 and temp, and shows they are correlated, and that whenever the temperature changes, CO2 follows this change after about 800 years or so.
https://twitter.com/NickMcGinley1/status/1184171704295317504?s=20
Below that are a few more…one from the Wood For Trees site which I made when someone was posting a graph from that site which had been scaled to make it look like CO2 and temp are highly correlated on the scale of the past several decades.
They are not correlated on this scale of decades.
Scroll up and down to see plenty of graphs which include CO2, including the one that shows how the adjustments the warmista climate liars have been making to the historical records are a perfect match with increasing CO2.
IOW…they are purposely making the fake temp charts match the amount of CO2 in the air as it increases.
I am not going to include any more links here or this comment will go to moderation.
I also have one somewhere which shows that over the past 140 years or so, there is a multidecade period where temps are falling and CO2 is barely budging, then another multidecade period where temp is rising and CO2 is barely moving, then a multidecade period where temps are falling sharply and CO2 is rising rapidly, then the only period where CO2 and temp are both going in the same direction, and then the most recent period, when CO2 concentration increased faster than ever, and temps have been flat to down with a couple of el nino caused blips upward in temp.
Sorry, those links take you to the thread that I had originally posted them in.
But if you just go to my page by clicking my name I have retweeted them and a bunch of graphs relating to CO2 are near the top:
https://twitter.com/NickMcGinley1
And if you go to this guys page…he has about the best collection of graphs and charts ever. His name is Kenneth Richard:
https://twitter.com/Kenneth72712993
And for the most comprehensive collection of charts and graphs that are catalogued and cross referenced, this site, called C3 Headlines, is fantastic.
Everyone should have this site bookmarked in Favorites for easy reference.
Best of all, they give explicit permission to use their charts, as long as attribution is given by simply keeping the format with their watermark, or by linking to their pages.
See here:
“Your free/unlimited use of ‘C3’ charts/graphs:
‘C3’ created/edited charts have a watermark and/or note embedded in the chart image. Charts with a red border and without the ‘C3’ mark/note were produced by another source that is associated with a URL address or link above the chart.
We encourage the free use of the ‘C3’ created/edited charts/images by web sites, blogs, emails, and other digital delivery platforms. For free of those charts created/edited by ‘C3’, we require (okay, okay…..we ask) that your web page/email provide a link (url address) to the C3 web page where you found the C3 chart/graph. Same goes for dead-tree publication of our charts. C’mon….give us a little credit with a link, plz.
If you would like a chart/graph modified for your use, send us an email and we’ll see if we can get it done in a timely manner for you.”
https://www.c3headlines.com/chartsimages.html
Jean Meeus, February 13, 2020 at 7:28 pm, asked, “So, what importance to reduce those 3-4 % to zero?”
The paper cited in Phil’s previous post February 13, 2020 at 6:01 pm raises the question, “If the Mona Loa ppm does not track with anthropogenic emissions, is the increase in CO2 an effect of global warming and not the cause?”
According to climate skeptic Jo Nova, the answer would seem to be the former: The 800 year lag in CO2 after temperature – graphed.
However, residing close to the equator, the advent of the Himalayan glacier increased earth’s albedo, resulting in permanent ice sheet formation in the Southwest Pacific Ocean (waters near Antarctica). The reduction of both temperature and CO2 occurred to the point where surviving vegetation limited further decline in CO2 concentration. The role of terrestrial plants in limiting atmospheric CO2 decline over the past 24 million years, Nature 460, 85-88 (2 July 2009) doi:10.1038/nature08133 Letter, concludes that grasslands are the result of the CO2 suffocation of trees. Plate tectonics were responsible for the uplift of the Himalayas. CO2 levels dropped to 200-250 ppm from 1000-1500 ppm as forests starved for CO2, gave way to prairies. See http://www.readcube.com/articles/10.1038/nature08133
(Article cites weathering during the uplift of the Himalyas as the cause of CO2 depletion, though, a reduction in ocean temperature would have resulted in the absorption of CO2 at the ocean surface as the partial pressure of CO2 fell. More CO2 can be dissolved into ever colder liquid water.)
The paper Early Palaeogene temperature evolution of the southwest Pacific Ocean about 34 Myr ago concludes,
“…This observation raises questions concerning the precise role of decreasing atmospheric greenhouse gas concentrations in cooling the Eocene poles, as in theory they should have cooled tropical regions as well…It has been suggested that the general warmth that characterized early Palaeogene climates was forced by high atmospheric greenhouse gas concentrations….However, the presence of substantial Middle Eocene continental ice (Antarctica) is still equivocal given the general warmth and overall absence of conclusive physical evidence.” See http://www.readcube.com/articles/10.1038/nature08399
We are actually at the end point of a Cenozoic Era cooling trend. See https://www.geocraft.com/WVFossils/Carboniferous_climate.html, especially http://www.geocraft.com/WVFossils/PageMill_Images/image277.gif
Our peak CO2 level has been about 300ppm, at the end of the Eocene, for example, so ~100ppm is added.
The increase is probably due a combination of land-use changes, such as fewer forests and peat bogs, as well as anthropogenic sources. While photosynthesis is not considered efficient, it’s a simple matter of measurement. Question should be, “How effective are forests at absorbing sunlight without producing blackbody radiation?” and not “How much energy in useble carbohydrates do trees produce?”
Another question is, “How much sunlight is reflected back to space due to forest mists?” and so on.
CO2 is well mixed with air all the way up to the stratosphere, so that the Orbiting Carbon Observatory measures columns of ordinary air, not CO2. See Carbon dioxide variations in the stratosphere over Japan, Scandinavia and Antarctica, esp. Fig 2.
We’ve already enough CO2 such that the sun is blocked completely with respect to the CO2 absorption bands except in a just a few arid regions such as the Atacama. No signature of greenhouse gas detectable. See What Do Observational Datasets Say about Modeled Tropospheric Temperature Trends since 1979?
Decline in thermospheric temperature due to the recent depth of the solar minimums, not greenhouse gasses, as previously supposed. See Causes of low thermospheric density during the 2007–2009 solar minimum.
Oh, I see that 126ka would place the 300ppm at the end of the Ionian Stage, not the Eocene:
http://joannenova.com.au/globalwarming/graphs/vostok-ice-cores-150000%20med.jpg
Anyway, its the stage that ended with the previous interglacial period.
As far as I know these emissions are from electricity production. Electricity is only 10% of my total energy consumption. 10% is Electricity, 40% is for heating my home and 50% is for my car.
About 5 % is from you.
Thank you, Nicholas! I will go explore the data swamp! Ain’t science fascinating?
I think Loydo just admitted the the sun drives climate!! That’s making progress out of Progressives!
Child: Father, is that like making lemonade out of lemons?
Father: Yes, child, but Progressives are drier and often lack any humor or irony. A bitter brew at best!
” meanwhile wind-powered electricity nearly caught up with coal-fired electricity.” Can anyone elaborate on this strange statement? All the data I’ve seen indicates that world wide wind energy is still a small fraction of coal powered electricity.
I think it must mean for the EU only.
That may be plausible.
Some of the northern countries have a lot of hydro they sell to neighbors.
Several countries use substantial amount of nuclear.
And they could be using name plate rating rather than power generated.
For the world as a whole wind and solar together are a tiny fraction of the total.
Hydro outweighs them both combined.
And the wind and solar have been incredibly expensive and gallingly destructive to ecology, wildlife, and quality of life of anyone unfortunate enough to live under the turbines.
Impossible. My computer model says this is impossible, therefor it isn’t.
If all those new plants that have been greening the earth have been absorbing CO2 at an accelerating rate but the human contribution to CO2 stops accelerating, we could potentially see a leveling off or decline in the atmospheric CO2 level. Now, would Mauna Loa report a flat lining or decline in the CO2 level, or would they fake it and show a phony incremental increase instead? Could they get away with it, and for how long? If it did happen the Greens would be totally lost, their identities are so tied up in man made disaster they wouldn’t know what to do with themselves. It would be the end of their religion.
No, the airborne fraction of CO2 has only decreased from about 0.6 in 1960 to 0.52 in 2020. See the link previously supplied by DMA:
https://tambonthongchai.com/2018/12/19/co2responsiveness/ )
There’s no way atmospheric CO2 level would level off or decline without an almost total elimination of anthropogenic emissions.
How much of the decline is due to LED lighting I wonder.
This was primarily due to declining emissions from electricity generation in advanced economies, thanks to the expanding role of renewable sources (mainly wind and solar), –> This was primarily due to declining emissions from electricity generation in advanced economies, thanks to advanced flue gas Purification,