Reposted from Dr. Roy Spencer’s blog
February 6th, 2020 by Roy W. Spencer, Ph. D.
Well, as I suspected (and warned everyone) in my blog post yesterday, a portion of my calculations were in error regarding how much CO2 is taken out of the atmosphere in the global carbon cycle models used for the RCP (Representative Concentration Pathway) scenarios. A few comments there said it was hard to believe such a discrepancy existed, and I said so myself.
The error occurred by using the wrong baseline number for the “excess” CO2 (atmospheric CO2 content above 295 ppm) that I divided by in the RCP scenarios.
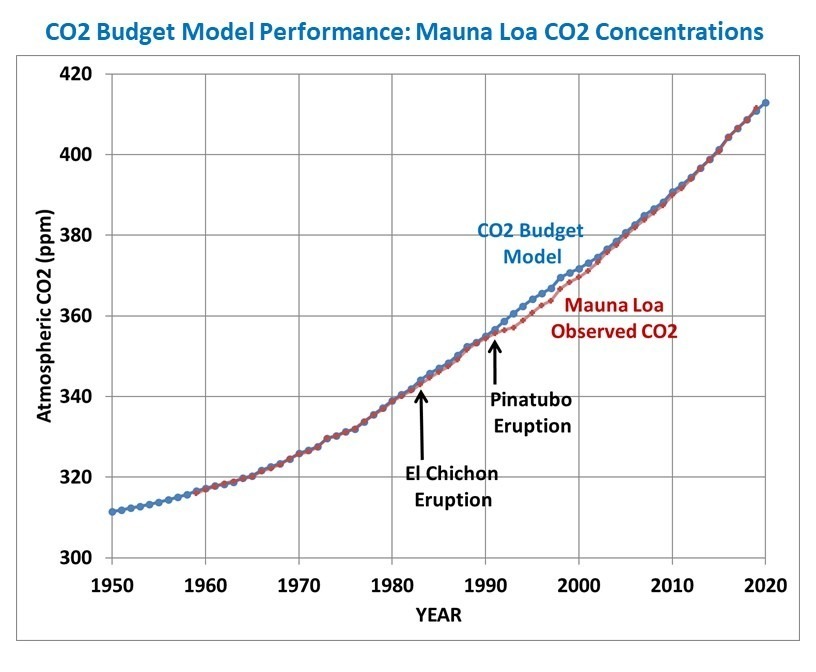
Here is the corrected Fig. 1 from yesterday’s post. We see that during the overlap between Mauna Loa CO2 observations (through 2019) and the RCP scenarios (starting in 2000), the RCP scenarios do approximately match the observations for the fraction of atmospheric CO2 above 295 ppm.

But now, the RCP scenarios have a reduced rate of removal in the coming decades during which that same factor-of-4 discrepancy with the Mauna Loa observation period gradually develops. More on that in a minute.
First, I should point out that the CO2 sink (removal rate) in terms of ppm/yr in three of the four RCP scenarios does indeed increase in absolute terms from (for example ) the 2000-2005 period to the 2040-2050 period: from 1.46 ppm/year during 2000-2005 to 2.68 ppm/yr (RCP4.5), 3.07 ppm/yr (RCP6.0), and 3.56 ppm/yr (RCP8.5). RCP2.6 is difficult to compare to because it involves not only a reduction of emissions, but actual negative CO2 emissions in the future from enhanced CO2 uptake programs. So, the RCP curves in Fig.1 should not be used to infer a reduced rate of CO2 uptake; it is only a reduced uptake relative to the atmospheric CO2 “overburden” relative to more pre-Industrial levels of CO2.
How Realistic are the Future RCP CO2 Removal Fractions?
I have been emphasizing that the Mauna Loa data are extremely closely matched by a simple model (blue line in Fig. 1) that assumes CO2 is removed from the atmosphere at a constant rate of 2.3%/yr of the atmospheric excess over a baseline value of 295 ppm.
OK, now actually look at that figure I just linked to, because the fit is amazingly good. I’ll wait….
Now, if I reduce the model specified CO2 removal rate value from 2.3 to 2.0%/yr, I cannot match the Mauna Loa data. Yet the RCP scenarios insist that value will decrease markedly in the coming decades.
Who is correct? Will nature continue to remove 2.0-2.3%/yr of the CO2 excess above 295 ppm, or will that removal rate drop precipitously? If it stays fairly constant, then the future RCP scenarios are overestimating future atmospheric CO2 concentrations, and as a result climate models are predicting too much future warming.
Unfortunately, as far as I can tell, this situation can not be easily resolved. Since that removal fraction is MY metric (which seems physically reasonable to me), but is not how the carbon cycle models are built, it can be claimed that my model is too simple, and does not contain the physics necessary to address how CO2 sinks change in the future.
Which is true. All I can say is that there is no evidence from the past 60 years (1959-2019) of Mauna Loa data that the removal fraction is changing…yet.
There is no way for me to win that argument.
I can identify three reasons why the RCP scenarios show low yearly removal rates. I have carried out literature surveys before developing my own carbon cycle model 1DAOBM. The first reason is that scenario calculation must apply a carbon cycle model – typically Bern2.5CC. The basic feature of these models is that the removal rate of anthropogenic CO2 from the atmosphere into the deep ocean is buffer factor limited. It means that the sequestration rate can be in a maximum of only 2.2…2,3 GtC/yr. When the atmospheric CO2 content goes higher, more and more anthropogenic CO2 remains in the atmosphere. Also, the removal rate into the biosphere starts to decrease after a few tens of years because respiration rate – it is the CO2 flow back into the atmosphere- starts to increase.
The buffer factor approach seems not to take into account that there is almost a similar flow of natural CO2 from the ocean into the atmosphere. This error can be revealed that according to these carbon cycle models, the CO2 increase of 270 GtC in the atmosphere is totally anthropogenic. It cannot be because if it were true, the permille value of the present atmospheric CO2 would be about -13‰ but it is only -8,5‰ corresponding to 73 GtC anthropogenic CO2. You can ignore these figures but then you will never figure out, what is wrong with the carbon cycle models used by IPCC and the high CO2 concentrations of RCP scenarios.
The discrepancy comes from the difference between the decay rate of the atmospheric presence of specific CO2 molecules and the decay rate of an added excess of CO2. The former has a half life of about 10 years, according to the atmospheric concentration of C14 dioxide molecules after the end of the nuclear bomb tests that produced them. The latter is slower, because when CO2 molecules dissolve into the ocean that causes some of the other CO2 molecules already in the ocean to “gas out”.
I made it 17y FWIW.
” when CO2 molecules dissolve into the ocean that causes some of the other CO2 molecules already in the ocean to “gas out””
It seems that in that case we should see the amount of C14 carbon dioxide in the shallow ocean to start deceasing again as it gets diluted by “post-bomb” C14-free fossil coal?
Before human emissions, the amount of CO2 in the atmosphere was largely driven by the balance between the biological pump that sequesters CO2 into ocean depths for hundred and thousand of years, and ocean upwelling that brings stored CO2 back into the atmosphere. Changes in today’s atmospheric CO2 must first account for any changes in that balance. The map linked below shows the sources and sinks of ocean CO2,( but I think the upwelling of CO2 around Antarctica is suspect)
http://landscapesandcycles.net/image/102357977_scaled_606x262.jpg
During the last Ice Age the ocean stored 850 billion tons more of CO2 than today. Despite speculation of of greater ocean productivity, sediment analyses typically show productivity is lower during cold periods. That implies, along with other evidence, that the increase in stored Ice Age ocean CO2 was driven by a decrease in upwelling related emissions.
Until we can accurately model the biological pump and ocean upwelling, estimates of CO2 removal rates based in atmospheric concentrations will be woefully inaccurate
Harde 2017 concludes: “The anthropogenic contribution to the actual CO2 concentration
is found to be 4.3%, its fraction to the CO2 increase over the Industrial Era is 15% and the average
residence time 4 years.”
Berry 2019 concludes: “The balance level of present human CO2 is about 18 ppm. The balance level of natural CO2 is about 392 ppm. Human CO2 does not increase atmospheric CO2 enough to cause climate change and restricting CO2 emissions will not stop climate change. “
About 112 of that 392 PPM of natural CO2 is natural CO2 displaced from natural sinks by manmade CO2 by circulation through the various partf of the carbon cycle, assuming 392 of the 410 total PPM is molecules of natural CO2. The 4 year residence time of individual CO2 molecules sounds short to me in light of 10 year half life of atmospheric C14 dioxide after the end of the nuclear bomb tests that produced it. Meanwhile, a residence time closer to 4 years than to 10 does not get in the way of refutation of Harde 2017 by Koehler 2017, which can be seen at https://www.soest.hawaii.edu/oceanography/faculty/zeebe_files/Publications/KoehlerGPC17.pdf
Donald.. “refutation of Harde 2017 by Koehler 2017”
I saw no refutation there. The fact that their “better methods” is not backed up by a graph of 14C tells me that their method does not work. All I read is words.. not numbers, no graphs. What did I miss?
Donald
I don’t consider Kohler’s response a reasonable refutation of Harde’s work. See (https://hhgpc0.wixsite.com/harde-2017-censored ) to understand what went on there. See Harde 2019 for further refutation of Kohler or (https://edberry.com/blog/climate/climate-physics/what-is-really-behind-the-increase-in-atmospheric-co2/ ) to see Salby’s response to Kohler.
The Harde 2019 work is a 90-minutes-plus video that I did not have time for. What I saw in an early glimpse looked like circulation between the uppermost ocean and the atmosphere of CO2. I saw that as being consistent with my claim that atmospheric residency time of an “excess” of CO2 caused by an injection of manmade CO2 into the atmosphere is longer than the atmospheric residency time of trackable individual CO2 molecules. I see the “excess” of atmospheric content of CO2 that is composed in substantial part of natural origin being man-made, due to the difference between atmospheric residency time of individual CO2 molecules and atmospheric residency time of a man-made bump-up of atmospheric CO2. A WUWT page that explains this difference (while supporting exponential decay and mentioning without disproving the competing Ben modeling) is oned I am repeating mention of, https://wattsupwiththat.com/2015/04/19/the-secret-life-of-half-life/
The residence time of 4 years is based on a wrong process model with one mixing chamber only. The carbon cycle system is much more complicated. The radiocarbon tracer test shows a residence time of 16 years and it is applicable for anthropogenic CO2. It is not applicable for the total atmospheric CO2 because it is a mixture of natural CO2 and anthropogenic COw2; simple like that.
A textbook example of smoke and mirrors.
The influence of carbon outside the atmosphere on CO2 inside the atmosphere is fully represented in the removal rate of atmospheric CO2. Once the removal rate of atmospheric CO2 is established – and it is empirically from carbon 14 – external carbon reservoirs are irrelevant.
https://youtu.be/b1cGqL9y548?t=68m
Simple like that.
And that’s the beauty of “future” predictions – the change is always coming, even if it never arrives.
And that’s why climate panicmongering statements for the past 20 years are important – are they showing any skill whatsoever?
If not, why should they be believed for the next 20 years? 40 years? 80 years?
Dr. Spencer;
I think you have the wrong perspective. Say rather, there is no supporting evidence for the models to claim a declining removal fraction. If they wish to depart from the current trend, they must defend that change from the status quo. The burden is not on you.
There is Henry’s law which states that the rate of absorption or out-gassing from a liquid depends on the difference of the pCO2 in the liquid and the partial pressure in the air above the liquid.
Also the saturated concentration of a gas down as temperature of the liquid rises.
Both those relationships are established “basis science”. That does not mean that Bern model is correct but it does mean the Dr Spencer’s very simple model is not accurate in assuming any one fixed percentage.
It’s also interesting to look at higher derivatives of dCO2 and SST , they are quite similar with a ratio of about 8 or 9 ppm/year/kelvin for inter-annual variation.
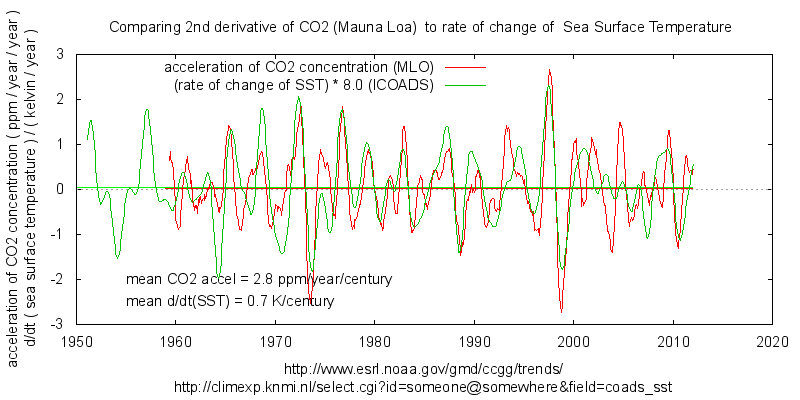
The long term average over the MLO record give 4ppm/year/kelvin for inter-decadal variation.
In other words, as SST rises, swings in atmospheric CO2 in *both* directions has increased.
I suspect that far from being constant the % amount of CO2 absorbed has risen, but that’s a longer story.
Quotation: There is Henry’s law which states that the rate of absorption or out-gassing from a liquid depends on the difference of the pCO2 in the liquid and the partial pressure in the air above the liquid.” I have applied Henry’s law in my model and that is what will happen. When the CO2 content of the mixing layer of the ocean increases the sequestration rate will decrease. The constant percentage model does not react to this physical fact.
You forget that the “mixed layer” is not isolated from the deep ocean. There is a constant export of CO2 to deeper layers by the thermohaline circulation, and a probably increasing downward export of organic material by the “biological pump”.
This CO2 won’t come back into circulation for at least 1,000 years.
Note that organisms in the deepest ocean trenches already have a full complement of “bomb C14”
I agree, the onus of proof is on the creators of the RCPs. By way of explanation for why they had to do it: there was no other way that the could plausibly predict runaway global warming.
“There is no way for me to win that argument.”. I think there is a way – but it could require another 60 years. The big problem in climate science is that models keep predicting things, and predictions can never be disproved by empirical evidence while they are still predictions. By the time that empirical evidence has become available, the models have moved on to new predictions. You, and we, are on a merry-go-round.
It’s not very merry, knowing that when the music stops, Fascists may climb on board and punch our tickets.
A contributory factor to this problem is that the “predictions” coming out of the models are not presented as predictions, but merely as “projections.” As the IPCC puts it: “When a projection is branded “most likely” it becomes a forecast or prediction.”
Projections, not being predictions in the sense of the scientific method, are not subject to being tested against empirical evidence, let alone disproved.
“Projections, not being predictions in the sense of the scientific method, are not subject to being tested against empirical evidence, let alone disproved.”
Which makes them “not science”.
The problems is that when the predictions are proven false, the Warmists just say “don’t worry about that, here’s a much more scary prediction”. They can never lose, until eventual society tell them to “away and boil your heid”.
But now, the RCP scenarios have a reduced rate of removal in the coming decades during which that same factor-of-4 discrepancy with the Mauna Loa observation period gradually develops.
Obviously, they’ve employed the same chimps for RGP as for the CMIP climate models.
I expect that the natural removal rate of CO2 from the atmosphere will be close to consistent with Dr. Spencer’s model and with a Bern model until man-made emissions take a great enough departure from exponential growth to cause the “excess” atmospheric CO2 above a “pre-industrial” baseline to depart substantially from exponential growth. As long as the “excess” is approximately growing exponentially, the natural removal rate will be consistent with both an exponential decay curve and with non-exponential decay curves (such as a Bern model) for each year’s man-made emissions.
Last time I checked, the growth has been closer to linear than exponential.
The “excess” above Spencer’s 295 PPM baseline and above Eschenbach’s 283 PPM baseline (in https://wattsupwiththat.com/2015/04/19/the-secret-life-of-half-life/) have both been close enough to proportional to manmade emissions, AND all three of these have been close enough to growing exponentially over the decades to be reasonably consistent with both Spencer’s ENSO-modified model and (at least to 2014) Eschenbach’s non-ENSO-modified model (despite one having a half-life a little less than 75% of the half-life of the other) AND consistent with the Bern model(s) used in the RCPs. Note how the RCPs (which model non-exponential decay of each year’s manmade emissions according to a Bern model) agree with Spencer’s model from 2000 to 2020, three of the four RCPs have natural removal of CO2 being close to that of Spencer’s model in the 2020-2030 decade, and RCP6 (the one with growth closest to exponential as of 2040) has natural removal rate of CO2 fairly close to that modeled by Spencer continuing long enough to include the 2030-2040 decade.
Also, part of the CO2 absorption slowdown in the Bern modeling in the RCPs comes from warming of the oceans according to a climate sensitivity indicated as most likely by climate models, I think around 2.5 degrees C/K per 2xCO2. In the likely event climate sensitivity is something less (at this moment I favor 1.5 degrees C/K per 2xCO2), the natural removal rate (% of excess above baseline per year) will decrease slightly less than indicated by the RCPs, meaning that to cause CO2 level to track one of the RCPs requires slightly more emissions in the future or after 2040 (depending on which RCP) than the RCP in question says.
It doesn’t all have to go into the oceans. More CO2 makes more vegetation plus there are no doubt many other processes in play https://ktwop.com/2014/10/07/carbon-dioxide-can-disassociate-to-form-oxygen-under-uv-in-upper-atmosphere/ , plus who knows what else.
Low solar also may cause it. Willis in 3, 2, 1 …..
and plankton is increasing even faster……and no, the ocean is not dissolving them
“All I can say is that there is no evidence from the past 60 years (1959-2019) of Mauna Loa data that the removal fraction is changing…yet.”
The removal fraction is the complement of the airborne fraction. And there is a reason in terms of the dynamics why it has been quite constant, as I describe here. It is a consequence of the exponential growth of the CO2 excess. If the fraction is any kind of linear response (determined by a response function, of which the Bern model is just one possible kind), then convolving that with an exponential will give a constant fractional response (it’s like exponential smoothing). As soon as the rate of increase drops below the exponential rate, the removal fraction drops. The reason is basically that the diffusion pathway reflects the higher growth rate, and when the driving surface concentration slows, CO2 travels back up the path. That is why RCP2.6 descends earliest and fastest.
Interesting post at moyhu, Nick. Why do you dismiss Henry’s law. Apart from it not being strictly applicable because not in equilibrium, it does represent nature of the process: more pCO2 in ocean, less uptake from air above than if pCO2 remained at pre-ind levels.
WonkyPedia says:
Fick’s law relates the rate of diffusion to the concentration gradient, which relates to the rate at which the system will move the Henry’s law equilibrium.
Greg,
“Fick’s law relates the rate of diffusion to the concentration gradient”
You can generalise concentration to activity (for different phases). Since an interface has zero thickness, and the activity gradient must be finite, Henry’s Law is a consequence (very locally). But I discount it here because people tend to interpret the airborne fraction as Henry with large scale equilibrium, and it isn’t that. The dynamics are central.
An empirical model based on observation and experiment doesn’t need to contain any physics. link
Suppose that I can model every electron in a simple electric circuit. Will the resulting model be more accurate than good ‘ole Ohm’s Law? Not bleeping likely.
What are they claiming? Their models are way off the mark now, but just you wait …
Yeah, right.
Anthropogenic nitrogen might be helping plants keep pace with removing rising CO2. I threw a few buckets of used dilute ammonia floor cleaner on my lime tree, after noticing what throwing it on the grass did to my lawn. The light green foliage is just two weeks worth of growth – a spectacular difference in growth rate. To be fair though this is the height of Summer, and plants like warm weather.
Anthropogenic nitrogen might be helping plants keep pace with removing rising CO₂.
Eric Worrall [ ] threw a few buckets of used dilute ammonia floor cleaner on [a] lime tree:
applied “field studies” – huge hit, congrats!
The 1963 14C Bomb Spike data make clear atmospheric CO2 entering at some T0 has a half-life of about 5 years. There is no fudge factor here. Many try to spin what that number means, but it is a hard fact. It is a fortunate accidental tracer experiment. The off rate has not changed for decades since 1963.
Reducing the total CO2 in the atmosphere is a different issue. That depends on the rate CO2 is injected into the atmosphere. The off rate constant is apparently not changing no matter what the amount of CO2 is in the atmosphere. So there is no apparent saturation of the reservoirs that take up CO2.
If you use the IPCC figures for global anthropogenic CO2 emissions, and you use the 5 yr half-life of CO2, there is no way to make ~280 ppmv in 1750 rise to meet the Mauna Loa CO2 curve. The conclusion is, the majority of CO2 emissions into the atmosphere are not from burning fossil fuel. They could be from methane released by the ocean or tundra, trapped in those reservoirs long enough for 14C to decay.
So relax, and enjoy burning whatever you like. We should enjoy an energy rich economy, and reject the power mad socialists trying to dismantle capitalism, while scaring people into chains of poverty, ignorance, dependence on government, poor health, almost constant misery, and short lives.
Greta the Troll go home, shut up, and stay in school.
The actual rate of CO2 influx from volcanoes is an order of magnitude low.
thanks for the assertion, we need more of those.
There are two issues with this:
1) The half-life of atmospheric C14 dioxide from bomb tests is much longer than 5 years, it’s about 10 years. Try putting atmospheric C14 bomb tests into images.google.com and looking at the many graphs brought up.
2) Atmospheric residency time of a boost of atmospheric CO2 by an injection or “pulse” of added CO2 is much longer than that of individual CO2 molecules, because CO2 molecules absorbed by the ocean are replaced by other CO2 molecules “gassing out” from the ocean to the atmosphere. Willis Eschenbach explains this in https://wattsupwiththat.com/2015/04/19/the-secret-life-of-half-life/ (I note that Eschenbach cites someone saying that individual CO2 molecules have atmospheric time constant of 8.6 years which means half-life of 6 years).
How much longer? Eschenbach says that data as of just before the early 2015 date of his article are consistent with a time constant of 59 years which means a half-life of 41 years, while not making a claim that the Bern model is wrong. Spencer’s ENSO-modified simple says time constant of about 43 years which means half-life about 29.4-30 years, although with a baseline of 295 PPM which is a little higher than Eschenbach’s 283 PPM and the 280 PPM usually stated for pre-industrial.
Residence time of C14 in atmosphere…around 50% gone in 7 years
80% gone in 20 years
https://wattsupwiththat.com/2013/07/01/the-bombtest-curve-and-its-implications-for-atmospheric-carbon-dioxide-residency-time/
GregK: That 7 year residency time that you claim is of individual CO2 molecules, not the residency time of a boost of atmospheric CO2 concentration by an injection / “pulse” of CO2 into the atmosphere. The latter is longer, with half-life of ~29.5-41 years if its decay manner is exponential, and discernment of such exponential decay from a competing Bern model of non-exponential decay has yet to be achieved from atmospheric data and emissions data because over recent decades manmade emissions and atmospheric CO2 concentration above the ~280-295 PPM range have been growing at close enough to an exponential rate, that interferes with discerning exponential from non-exponential (Bern model) “decay” of each year’s atmospheric CO2 level boosting from manmade emissions.
Willis Eschenbach explains the difference between residency time of individual CO2 molecules (what “bomb test data” indicate) and residency time of a boost of atmospheric CO2 concentration in https://wattsupwiththat.com/2015/04/19/the-secret-life-of-half-life/ There, he says the time constant (tau or e-folding time) is 8.6 years for individual CO2 molecules, 59 years for a boost if atmospheric CO2 from a “pulse”/injection of CO2 into the atmosphere. Translated to half life, these are 6 and 41 years respectively.
There is a much simpler way to conclude that the yearly increase rate of the atmospheric CO2 can originate from fossil fuel emissions. The emissions have been at the level of 10 GtC/yr corresponding to the ppm increase of 4.7 ppm (2.12 GtC increase corresponding 1 ppm increase). The observed ppm increase has been on average about 2.2 ppm/yr. This simple fact means that the atmospheric CO2 increase can originate from fossil fuel emissions. You cannot change this fact by any half-time figure. You can say it in another way: it looks like that about 55 % of yearly emissions stay in the atmosphere but it is an illusion.
There is another observation-based fact to show that the atmospheric CO2 increase does not originate totally from fossil fuel emissions. This fact is a permille value of the atmospheric CO2, which is now -8.5‰ (73 GtC anthropogenic CO2) but the IPCC claims that the CO2 increase of 270 GtC since 1750 is totally anthropogenic corresponding to the permille value of -13‰. This is the univocal evidence of the erroneous model of BERN2.5CC and IPCC science.
As I keep saying, anthropogenic CO2 molecules get absorbed by nature in a way that causes nature to replace the anthropogenic CO2 molecules with natural ones. Willis Eschenbach explains the difference between atmospheric residency time of individual CO2 molecules and the residency time of a boost of atmospheric CO2 content by a “pulse” (injection) of CO2 into the atmosphere in https://wattsupwiththat.com/2015/04/19/the-secret-life-of-half-life/
The difference is large. In that article, Willis Eschenbach claimed time constant (tau or e-folding time) of 8.6 years for atmospheric presence of individual CO2 molecules, 59 years for a man-made bump-up of atmospheric CO2 concentration. (6 and 41 years respectively, when converted from time constant to half life.)
The problem still remains CO2 has no influence on temperature–sorry to burst you balloon. If anything CO2 is a refrigerant as we used it last century (and continue to use it) and will never influence global warming.
Beating that dead horse is why we never made any progress with the public or the Politicos and the beat goes on.
Trying to understand your point of view…
CO2 has “no effect” on temperature? Or CO2 actually cools the atmosphere (through some sort of heat transport)?
Robert:
Some articles in these pages and other blogs suggest that CO2 imparts cooling and/or heating. None of this can be substantiated.
The latter is over empathized because of the glass-enclosed greenhouse effect (closed system).
Those of us who studied and apply thermodynamics, unit operations and reaction kinetics (real science ) scoff at the ridiculousness of 400 ppm of an open, chaotic system having any impact on heating or cooling—the Emperor’s New Clothes.
The reference to refrigeration is to suggest the heat transfer capabilities of carbon dioxide– not its back-radiation intellectual masturbation espoused by misinformed scientists cultivating grant money handouts (sic):
https://www.achrnews.com/articles/94092-co2-as-refrigerant-the-transcritical-cycle
Actually when temperatures increase with altitude (which they do above the tropopause, and all the way down to the surface in inland Antarctica) then more CO2 will cause net cooling.
Maybe not the MLO CO2 data, but the Barrow CO2 data indicates the high latitude sinks are increasing uptake. A repeat of the figure I posted in the previous post on this subject:
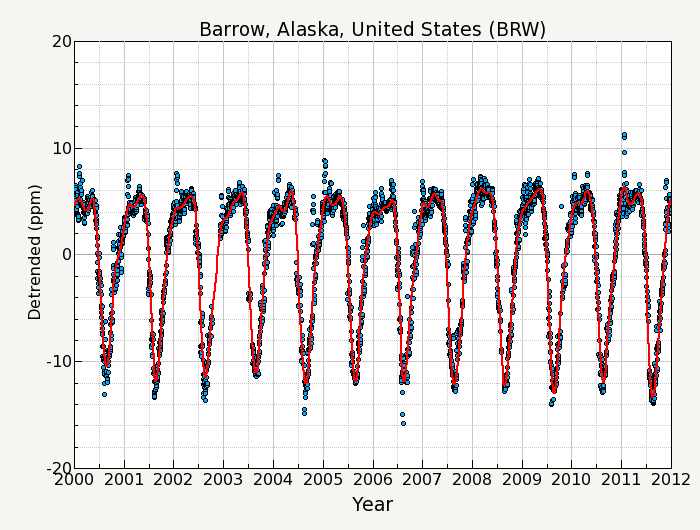
Much of this CO2 uptake is via increased primary production in the Barents Sea, Chukchi Sea, East Siberian Sea, Beaufort Sea where summer sea ice minimums have been greatest. The uptake is in the form of phytoplankton. Phytoplankton sits at the bottom of the food web, but only a small portion of this vast bounty is consumed by fish and marine mammals. Most of the increased phytoplankton blooms just sink to the ocean floor without entering the food chain. Phytoplankton increase in its biomass total then effects of CO2 drawdown of dissolved CO2 thus accelerating the Arctic Sea itself a major CO2 sink from the atomosphere, while producing oxygen with its chlorophyll-A bloom visible from polar orbiting satellites.
“Northward Expansion and Intensification of Phytoplankton Growth During the Early Ice‐Free Season in Arctic” (S. Renaut E. Devred M. Babin. 15 October 2018 https://doi.org/10.1029/2018GL078995)
https://agupubs.onlinelibrary.wiley.com/doi/full/10.1029/2018GL078995
The author’s figure 4. Here:

The green pixels (areas) depict areas with new phytoplankton blooms since 2010.
Boreal forests are often cited as the reason why CO2 swing is largest the further north you go but I agree it’s the water which is driving it.
Alert, Canada is at 82N , the similarity between Arctic ice coverage and CO2 is interesting.
I think it’s both, neither excludes the other. Both are CO2 sonsumers. But I think the phytoplankton response to enhanced CO2 fertilization is probably much stronger than the land-based forests for a number of reasons.
The Bern Model, in one of its several major fails, does not allow for this Arctic Ocean biological sink response to be captured in its model output. The Bern Model is just more junk science the IPCC is relying on to push its agenda of anthropogenic climate calamity nonsense. The Bern Model serves its purpose. A purpose that has nothing to do with evidence-based science.
Both the ocean and biosphere absorption are playing this sequestration game. Just yesterday I found the CO2 yearly fluctuations of nine CO2 measurement stations in Siberia from 2010 to 2015. They all have the yearly amplitude from peak-to-peak 28 ppm – Barrow 20 ppm. There is life outside of the American continent.
Antero,
I have no doubt the Russians in the lands around East Siberian Sea are experiencing more CO2 amplitude swings than Barrow Alaska. The East Siberian Sea is seeing much of the Arctic Sea Ice retreat. Life responds to that.
None of this is biological response to increasing CO2 and warming Arctic is modeled or captured in the output by the Bern Model.
Joel
Greg
It is not only interesting, it is the controlling mechanism for the annual residual.
The NH annual profile for both Arctic sea ice and CO2 is the outcome of the hemisphere troposphere pump.
There is also little attention paid to the entire verical column up to 100km and the large annual movements at that height.
Folks talk of interface only between atmosphere and ocean, the other end of the column is the interface with space, a vacuum.
If fossil use remained constant for the next 20 years the annual rate at mlo would still increase.
Regards
The Barrow CO2 has summertime seasonal downward spikes that are localized to cold non-ice-covered ocean in/near the Arctic. The graph at appears to me as not indicating this Arctic CO2 uptaking is increasing. However, I expect that some places in the Arctic ocean and/or nearby parts of the Atlantic and the Pacific can be found with uptake increasing, as these high uptake ocean areas retreat northward decade-by-decade with the edge of the sea ice. Also, where ocean is upwelling from deep ocean that has been isolated from what happened in the atmosphere in recent centuries, I expect those ocean areas to have CO2 uptake increasing as atmospheric CO2 increases.
“Also, where ocean is upwelling from deep ocean that has been isolated from what happened in the atmosphere in recent centuries, I expect those ocean areas to have CO2 uptake increasing as atmospheric CO2 increases.”
On the other hand the water coming back to the surface now “went under” during the MWP, so the the amount of CO2 in uppwelling water may well be increasing slightly.
Donald
If the Arctic region ocean uptake doubled next year you will not see any difference in the Barrow chart. Look at the wind direction heading into the Arctic region from East Asia particularly during the autumn and winter months, plus add a low tropopause and cold dense air. This is what determines the large annual undulation at Barrow and other high latitude NH stations.
NH emissions are at the highest during a low tropopause, it is a compounding effect.
The Arctic is recipient for Europe and Asian emissions, well mixed.
Also note that the decline in Barrow CO2 proceeds MLO, not because of biosphere uptake proceeding lower latitude, but simply due to atmospheric circulation.
Regards
I find it strange that the removal should look anything like a constant, and I will take a wild guess that it has to be a coincidence. Nick mentions on possibility which seems reasonable from a purely math point of view…but nature is very complex and I imagine it still has some surprises in store for those of us that care who watch long enough.
Here is one scenario: Ocean plankton and algae uptake increases exponentially as CO2 rises, assuming it does not have any major nutrient barriers (a bad assumption I will address). These organisms grow and die, and much of it settles to the bottom of the ocean as now sequestered (well, mostly) carbon. We are basically building new oil reserves if its left alone long enough. So even though the ocean water is able to take up less CO2 because it is warming, it can take up more CO2 because organisms keep eating it.
The obvious problem with this scenario is that there can’t be a major bottleneck in the organism’s nutrients, and there are in many cases. Iron is one of these. Nitrogen used to be another, although pollution is taking care of that for now… But, if there is a sudden source of iron in the form of a magma release, there could be some spectacular blooms.
So while the chemistry might react in some fashion that resembles a constant, with life involved in the middle I find it difficult to believe it still resembles a constant. I actually expect uptake to increase (as a percentage), not stabilize or shrink.
“These organisms grow and die, and much of it settles to the bottom of the ocean as now sequestered (well, mostly) carbon. ”
But no. Almost nothing is sequestrated. It is all eaten by deep sea organisms. Remember there is no primary productions in the deep ocean, everything living there is dependent on the slow “rain” of dead organism from above. And in the current icehouse climate and strong thermohaline circulation the deep ocean is pretty well oxygenated almost everywhere. Organic material is only accumulating in a very few oddball basins like the Black Sea. Calcareous oozes collect above the CCD, yes, but nothing edible survives for long.
So, no we aren’t creating any oil source-rocks. That only happens during extreme hothouse climates when the deep ocean becomes dysoxic or anoxic.
A small caveat: there is actually a little primary production in the deep sea, by chemosynthesizing bacteria near geothermal vents. That is why such vents are “oases” in the deep ocean “desert”.
Note that rain has a pH ranging from 5.0 to 5.7, due to the CO2 in it.
Mods,
My comment:
https://wattsupwiththat.com/2020/02/07/corrected-rcp-scenario-removal-fractions/#comment-2911572
lost in moderation.
Thanks for any assist.
Good catch, but the fundamental discrepancy remains. Regardless of how much CO2 accumulates or is removed from the atmosphere, the current temperature and sea level trends are squarely in the RCP2.6 range while the rate of CO2 accumulation is in the RCP8.5 range.
RCP8.5 assumes “business as usual” where CO2 continues to increase as the world does essentially nothing to curb emissions. RCP2.6 expects all countries to drastically curb emissions so that around 2020—this year!—CO2 emissions begin to decline. (Incidentally, that’s why all the screaming about “point of no return” and “we must get it done NOW!”)
BUT, even as emissions continue to increase, the measured temperature and sea level trends are in the RCP2.6 range. The CMIP computer models are as useful as sheep entrails for predicting the future.
With enough free parameters, any model can match past changes. This does not mean a model is correct or has predictive skill.
With respect, this model is defective for several reasons. Notably, it follows from circular reasoning which treats human CO2 and natural CO2 differently: The so-called “removal fraction” is defined from human carbon because the model presumes that changes of CO2 result only from CO2 emitted by humans. What about CO2 emitted by nature? Why, that part (which vastly exceeds the CO2 emitted by humans) is presumed to be fast asleep.
Empirically, this model is immediately falsified by carbon 14. Following the end of nuclear bomb testing, perturbed C14 was removed on the time scale of only a decade, not a century. Dr. Spencer’s argument (in his earlier post) as to why C14 does not apply is simply incorrect. The chemical and physical processes that act on CO2 to remove it from the atmosphere do not distinguish CO2 that is comprised of C14 from CO2 that is comprised of C12. The unrealistic removal time makes the model invalid and its output irrelevant.
Actually CO2 with C14 in it would be expected to be removed somewhat more slowly, since many chemical processes tend to “prefer” C12 to C13 or C14 due to the lower molecular weight.
Slightly… But, as recognized, including that small effect would make the actual removal of CO2 (which is almost entirely C12) even faster than the observed removal of C14.
The climate system uses CO2 as a negative feedback. The AMO is always warmer during a centennial solar minimum, and a warmer North Atlantic reduces CO2 uptake. The Beck chemical CO2 measurements are much higher during each warm AMO phase.
https://www.researchgate.net/publication/258807285_Atlantic_Ocean_CO2_uptake_reduced_by_weakening_of_the_Meridional_Overturning_Circulation
Wasn’t the Orbiting Carbon Observatory supposed to shed light on this? Has anything come out of the data other than colorful graphics?
They are right for those who say that it would be better to act on the advanced state of science. However, the reality is that we will be forced to act on the current state of science. We are like the man in the window of the burning apartment and if he pops out there is at least some chance of survival.
However in this particular case we have only been told that the apartment is on fire, we haven’t seen any sign of actual burning.
my model is too simple, and does not contain the physics necessary to address how CO2 sinks change in the future.
========
Newtons Law of Universal Gravitation is exactlyvthe same. It is too simple and does not contain the underlying physics. Newton himself said that instant action at infinite distance could not be correct.
Yet we use Newton because it is simple and fits the data. Not because it describes the underlying physics. Einstein describes the underlying physics but is so complicated that we rarely use it.
The same arguments apply here.
The best method and the industrial standard method to measure a fluid clearance rate is to use an isotope tracer. For CO2 in the atmosphere this has been done. In the 1950’s and 60’s the nuclear bomb tests released a n easily measurable pulse of 14C as CO2 into the atmosphere, transporting it to the top of the stratosphere thus enduring thorough atmospheric mixing. Scientists did straightforward and honest science in those days, instead conjuring tricks.
They measured the radiolabelled CO2 clearance rate and found it to have a half life of 16 years. Dividing this by ln 2 (0.693) this gives a mean lifetime of a CO2 of 23 years.
https://www.ncbi.nlm.nih.gov/pmc/articles/PMC2871409/
That is all there is to know about CO2 clearance. Anything beyond this, trying to eel out of this measured clearance by appealing to circulating compartments and forcing a long residence time by convoluted fabrication, is nothing but fraudulent politically motivated hogwash.
From the above reference:
Atmospheric (aboveground) detonations of nuclear weapons during the period of the cold war (1955–1963) doubled the concentration of 14C/12C in the atmosphere (8, 9). Although nuclear weapon testing was conducted at only a few locations, excess levels of 14C in the atmosphere rapidly dispersed and equalized around the globe. Since 1963, as a result of a worldwide test ban treaty, 14C levels in the atmosphere have been decreasing exponentially with a mean half-life of 16 years. 14C levels have not decreased because of radioactive decay (14C has a half-life of 5,730 years), but rather 14C has moved out of the atmosphere due to mixing with large marine and terrestrial carbon reservoirs. Because radiocarbon is incorporated into all living things, this pulse (known as the “bomb curve”) forms an isotopic chronometer of the past 60 years.
It looks like you do not understand that this tracer test is applicable only for anthropogenic CO2. The atmosphere has received natural CO2 from the oceans because its permille value is -8.5. The half-time or residence time for the total CO2 of the atmosphere is longer. Anyway, Bern2.5CC and other IPCC accepted models are wrong.
Thanks for replying. I thought that carbon as energetically injected into the atmosphere as in the bomb tests would serve as an approximate analog of all CO2 in the atmosphere. But this can’t be known for sure of course. All atmospheric CO2 originates from the surface, from organism respiration or volcanoes or fires. It floats around for a while then is photosynthesised.
Willis’ assumptions (Willis’ assumption are the same as the IPCC Bern model) concerning atmospheric CO2 problem are physically incorrect as he and the authors of the Bern equation (whos who of the cult of CAGW) ignore observations that he/they cannot explain.
Here are a couple of observational anomalies that we are ignoring which disprove Willis’ conceptual idea of what is happening physically.
The atmospheric C13/C12 ratio is changing in a step wise manner where there is no change in the ratio for multiple years and then there is a drop in the ratio.
If you calculate the instantaneous change in the C13/C12 ratio (δ13 C, see Tom Quirk’s analysis in the attached link) and then plot that value against time it is found….
… that there is evidence of a massive natural low source of C13/C12 that is entering the biosphere at the times of El Ninos from the ocean.
http://ruby.fgcu.edu/courses/twimberley/EnviroPhilo/SourcesAndSinks.pdf
https://journals.sagepub.com/doi/10.1260/095830509787689123
“The correlation of changes in δ13 C with ENSO events and the comparison with a simple model of a series of cascades suggest that the changes in δ13 C in the atmosphere have little to do with the input of CO 2 emissions from the continuous use of fossil fuels.”
The change in the ratio of C13/C12 does not support the Bern Equation’s physical assumption that volcanic eruptions and anthropogenic CO2 emissions are the only new sources of CO2 into the biosphere.
Here is another paradox. The Bern equation assumes zero biological material is being sequestered in the ocean.
This recent observation that C14 is making to the deepest ocean with no delay is an observational fact that disproves the Bern model of CO2 sinks and sources and resident times.
This is important as if there is a large sink of CO2 in the biosphere that the Bern equation did not take into account there must be a large source of CO2, coming into the biosphere besides volcanic eruptions which the Bern equation did not take into account.
A large missing sink of CO2 and a large missing source of CO2, is exactly what Salby is saying must be physically true. to explain the fact that atmospheric CO2 is tracking planetary temperature change, not anthropogenic CO2 emissions.
The Bern model assumes that ocean circulation (with hundreds of years delay) is the only method for deep sequestration of CO2 in the ocean.
This assumption of zero particulate organic sequequetration in the ocean, is not in agreement with earlier studies and has been disproved with the C14 finding.
“The alleged long lifetime of 500 years for carbon diffusing to the deep ocean is of no relevance to the debate on the fate of anthropogenic CO2 and the “Greenhouse Effect”, because POC (particular organic carbon; carbon pool of about 1000 giga-tonnes; some 130% of the atmospheric carbon pool) can sink to the bottom of the ocean in less than a year (Toggweiler, 1990).”
https://www.livescience.com/65466-bomb-carbon-deepest-ocean-trenches.html
Bomb C14 Found in Ocean Deepest Trenches
If you use the Bern equation δ13 C to calculate the expected ratio in the atmosphere using the Bern equation assumptions and known anthropogenic emissions, calculated ratio is much higher than the calculate ratio, that and the fact that δ13 C is changing in a manner that has no correlation with anthropogenic CO2 emissions shows that there is a massive time varying source of low C13/C12 that is entering the biosphere via the oceans.
This a detailed explanation of this issue.
https://www.co2web.info/ESEF3VO2.pdf
All Gts are gigatonnes of CO2
We are informed that fossile 36 Gt is released to the atmosphere every year right now. That figure will increase with 0.6% each year. From Mauna Loa we know that approx 2 ppm stays in the atmosphere and as a ppm is 7.81 Gt, approx. 16 Gt stays in the atmosphere, so 20 Gt of the 36 Gt disappear with 8 Gt to the ocean and 12 Gt to the plants. As there is 3200 Gt in the atmosphere and it goes up with 16 Gt in a year, the level is 0,5% up each year. Thus the traffic the to ocean and the plants is also 0.5% up every year. 36/06 up and 20/05 down ends up with 16 up with 0,2%/year (weighted) and that can be calculated with a ‘compound interest’ table. It shows a very linear increase in the concentration (approx. 2 ppm/yr) BUT: Plants grow from that CO2, and the earth is greening at at rate of 0.4%. (NASA?)
With repect to this (again calculated with a ‘compound interst’ table), the increase is slowing down so much, that after 100 years and ahead the curve for the atmosphere concentration will slowly go near horisontal at a level of 280 – 290 ppm above the level of today and that will happen after approv 150 years.
Conclusion: If we continue as today (36/0.6%), the max CO2 level will be approx 700 ppm in approx 150 years and it will not go higher.
“Unfortunately, as far as I can tell, this situation can not be easily resolved. Since that removal fraction is MY metric (which seems physically reasonable to me), but is not how the carbon cycle models are built, it can be claimed that my model is too simple, and does not contain the physics necessary to address how CO2 sinks change in the future.”
____________________________________
Your “model” ain’t “physics” but statistical “algorithms”.
2 possibilities: preprocessing the deviations and THEN do the algorithms.
Or leave that “climate change super computer” games alone.