Guest Post by Willis Eschenbach [see update at the end]
How much is a “Whole Little”? Well, it’s like a whole lot, only much, much smaller.
There’s a new paper out. As usual, it has a whole bunch of authors, fourteen to be precise. My rule of thumb is that “The quality of research varies inversely with the square of the number of authors” … but I digress.
In this case, they’re mostly Chinese, plus some familiar western hemisphere names like Kevin Trenberth and Michael Mann. Not sure why they’re along for the ride, but it’s all good. The paper is “Record-Setting Ocean Warmth Continued in 2019“. Here’s their money graph:

Now, that would be fairly informative … except that it’s in zettajoules. I renew my protest against the use of zettajoules for displaying or communicating this kind of ocean analysis. It’s not that they are not accurate, they are. It’s that nobody has any idea what that actually means.
So I went to get the data. In the paper, they say:
The data are available at http://159.226.119.60/cheng/ and www.mecp.org.cn/
The second link is in Chinese, and despite translating it, I couldn’t find the data. At the first link, Dr. Cheng’s web page, as far as I could see the data is not there either, but it says:
When I went to that link, it says “Get Data (external)” … which leads to another page, which in turn has a link … back to Dr. Cheng’s web page where I started.
Ouroborous wept.
At that point, I tossed up my hands and decided to just digitize Figure 1 above. The data may certainly be available somewhere between those three sites, but digitizing is incredibly accurate. Figure 2 below is my emulation of their Figure 1. However, I’ve converted it to degrees of temperature change, rather than zettajoules, because it’s a unit we’re all familiar with.

So here’s the hot news. According to these folks, over the last sixty years, the ocean has warmed a little over a tenth of one measly degree … now you can understand why they put it in zettajoules—it’s far more alarming that way.
Next, I’m sorry, but the idea that we can measure the temperature of the top two kilometers of the ocean with an uncertainty of ±0.003°C (three-thousandths of one degree) is simply not believable. For a discussion of their uncertainty calculations, they refer us to an earlier paper here, which says:
When the global ocean is divided into a monthly 1°-by-1° grid, the monthly data coverage is <10% before 1960, <20% from 1960 to 2003, and <30% from 2004 to 2015 (see Materials and Methods for data information and Fig. 1). Coverage is still <30% during the Argo period for a 1°-by-1° grid because the original design specification of the Argo network was to achieve 3°-by-3° near-global coverage (42).
The “Argo” floating buoy system for measuring ocean temperatures was put into operation in 2005. It’s the most widespread and accurate source of ocean temperature data. The floats sleep for nine days down at 1,000 metres, and then wake up, sink down to 2,000 metres, float to the surface measuring temperature and salinity along the way, call home to report the data, and sink back down to 1,000 metres again. The cycle is shown below.

It’s a marvelous system, and there are currently just under 4,000 Argo floats actively measuring the ocean … but the ocean is huge beyond imagining, so despite the Argo floats, more than two-thirds of their global ocean gridded monthly data contains exactly zero observations.
And based on that scanty amount of data, which is missing two-thirds of the monthly temperature data from the surface down, we’re supposed to believe that they can measure the top 651,000,000,000,000,000 cubic metres of the ocean to within ±0.003°C … yeah, that’s totally legit.
Here’s one way to look at it. In general, if we increase the number of measurements we reduce the uncertainty of their average. But the reduction only goes by the square root of the number of measurements. This means that if we want to reduce our uncertainty by one decimal point, say from ±0.03°C to ±0.003°C, we need a hundred times the number of measurements.
And this works in reverse as well. If we have an uncertainty of ±0.003°C and we only want an uncertainty of ±0.03°C, we can use one-hundredth of the number of measurements.
This means that IF we can measure the ocean temperature with an uncertainty of ±0.003°C with 4,000 Argo floats, we could measure it to one decimal less uncertainty, ±0.03°C, with a hundredth of that number, forty floats.
Does anyone think that’s possible? Just forty Argo floats, that’s about one for each area the size of the United States … measuring the ocean temperature of that area down 2,000 metres to within plus or minus three-hundredths of one degree C? Really?
Heck, even with 4,000 floats, that’s one for each area the size of Portugal and two kilometers deep. And call me crazy, but I’m not seeing one thermometer in Portugal telling us a whole lot about the temperature of the entire country … and this is much more complex than just measuring the surface temperature, because the temperature varies vertically in an unpredictable manner as you go down into the ocean.
Perhaps there are some process engineers out there who’ve been tasked with keeping a large water bath at some given temperature, and how many thermometers it would take to measure the average bath temperature to ±0.03°C.
Let me close by saying that with a warming of a bit more than a tenth of a degree Celsius over sixty years it will take about five centuries to warm the upper ocean by one degree C …
Now to be conservative, we could note that the warming seems to have sped up since 1985. But even using that higher recent rate of warming, it will still take three centuries to warm the ocean by one degree Celsius.
So despite the alarmist study title about “RECORD-SETTING OCEAN WARMTH”, we can relax. Thermageddon isn’t around the corner.
Finally, to return to the theme of a “whole little”, I’ve written before about how to me, the amazing thing about the climate is not how much it changes. What has always impressed me is the amazing stability of the climate despite the huge annual energy flows. In this case, the ocean absorbs about 6,360 zettajoules (10^21 joules) of energy per year. That’s an almost unimaginably immense amount of energy—by comparison, the entire human energy usage from all sources, fossil and nuclear and hydro and all the rest, is about 0.6 zettajoules per year …
And of course, the ocean loses almost exactly that much energy as well—if it didn’t, soon we’d either boil or freeze.
So how large is the imbalance between the energy entering and leaving the ocean? Well, over the period of record, the average annual change in ocean heat content per Cheng et al. is 5.5 zettajoules per year … which is about one-tenth of one percent (0.1%) of the energy entering and leaving the ocean. As I said … amazing stability.
And as a result, the curiously hubristic claim that such a trivial imbalance somehow perforce has to be due to human activities, rather than being a tenth of a percent change due to variations in cloud numbers or timing, or in El Nino frequency, or in the number of thunderstorms, or a tiny change in anything else in the immensely complex climate system, simply cannot be sustained.
Regards to everyone,
w.
h/t to Steve Milloy for giving me a preprint embargoed copy of the paper.
PS: As is my habit, I politely ask that when you comment you quote the exact words you are discussing. Misunderstanding is easy on the intarwebs, but by being specific we can avoid much of it.
[UPDATE] An alert reader in the comments pointed out that the Cheng annual data is here, and the monthly data is here. This, inter alia, is why I do love writing for the web.
This has given me the opportunity to demonstrate how accurate hand digitization actually is. Here’s a scatterplot of the Cheng actual data versus my hand digitized version.

The RMS error of the hand digitized version is 1.13 ZJ, and the mean error is 0.1 ZJ.
Hi Willis,
Could you please explain how you covnerted the energy change to a temperature change ?
David, the conversion is possible due to the fact that it the “specific heat” of seawater is about 4 megajoules per tonne per degree C. In other words, it takes 4 megajoules to warm a tonne of water by 1°C.
w.
“The RMS error of the hand digitized version is 1.13 ZJ, and the mean error is 0.1 ZJ.”
Hey Willis, can we have that in degrees please 😉
seriously, nice work.
“Not sure why they’re along for the ride, but it’s all good. ”
how do you expect them to get a hockey stick without having Mann on board to present incompatible data from a variety of data sources in the same colour and pretend it’s a trend.
Where would any search for missing heat be with the bone fides of Trenberth .
You knocked the Puck outa that post!
Trenberth and Mann have ‘prestige’ in the right circles to get the best coverage for the ‘oceans are boiling’ story. What with them now being acid too, count me out from having a paddle.
Changes in salinity alter the specific heat more than allows for the “accuracy” the paper claims then.
12 cheeseburgers. Your comment is talking about 12 cheeseburgers ± a few pickles.
Maybe 12 pickle molecules.
All their claimed are pickled, or they are all pixelated.
Excellent commentary on the error bars, yet certainly there are other factors that increase the absurdity of their claims…
The floats are not fixed or tethered to one location! They all move!
Finally, making a WAG that they are right, then as the atmosphere warms one far quicker, the difference between the ocean T and atmospheric T increases, thus over time the oceans ability to counter the atmospheric warming increases.
Yeah, but how many sesame seeds per bun?
They should use scarier units, such as electron-volts. 1 zJ = 6.24E39 eV! Now THAT’S some scary stuff!
zeta = 10²¹
J/eV = 1.6×10⁻¹⁹, so do 1/x inversion
eV/J = 6.25×10¹⁸
eV/zetaJ = 6.25×10¹⁸ × 10²¹ → 6.25×10³⁹!
Yay.
Math.
Thanks, Goatguy. My go-to resource on conversions is Unit Juggler, q.v.
w.
Maths – FIFY
Excellent article, would there be any other reason (other than leveraging alarmism) that the original paper would use Zetta-joules as a measurement ? We’re they trying to illustrate something else ?
Will Manb & co tell us, ARGO is measuring zeta joules ?
The hysteria surrounding this is unbelievable … here’s CNN:
Oceans are warming at the same rate as if five Hiroshima bombs were dropped in every second
People truly don’t realize how big the energy flows in the climate system actually are. Five Hiroshima bombs per second is the same as 0.6 watts per square metre … and downwelling energy at the surface is about half a kilowatt per square metre.
w.
YES. And what is more is that for every kilogram of water evaporated from the oceans some 694 Watthrs. are removed from the surface and dissipated into the clouds and beyond to space. This being why the oceans never seem to get above 35DegC even after tens of thousands of years of these bombs being dropped every second.
A watched kettle never boils it appears.
“A watched kettle never boils it appears.”
+1
Willis
Nice article. The britishpress are talking about a surge in warming with oceanic apocalypse around the corner.
one of the problems is context, such as your pertinent comment about the huge amount of energy entering the ocean, of which the human content is actually miniscule, which somehow never makes it into the media
The other problem is that most people have problems with numbers. It would be useful if numbers less than one could be expressed in words,for example one hundredth of a degree centigrade rather than the figure. The vanishingly smaller the number such as 0.001, the less likely it is that the average person will understand it
Tonyb
TonyB
Because many people have problems with numbers, it behooves us to translate oddball metrics into things people can understand. Willis did exactly that.
Something else we can do is explain in short sentences that a claim for a detected change that is smaller than the uncertainty about that change has to be accompanied by a “certainty” number.
Mmm It is not that we can’t calculate some average value from a host of instruments and readings. It is just that propagating the uncertainties by adding in quadrature to get the “quality” of the average (the mean) means getting a number with a pretty large uncertainty.
Until we know the number of readings and the number of instruments we can’t say exactly what the uncertainty is, but it is certainly more than 1.5 degrees C.
Suppose the claimed change is 0.1 degrees ±1.5, for example. We have to consider what certainty claim should accompany the 0.1. Suppose the errors in readings were Normally distributed (a reasonable assumption). Given a Sigma 1 uncertainty of ±1.5 C it means we can say the true average value is going to be within 1.5 degrees 68% of the time (were we to repeat the experiment). To say it is within 0.1 degrees is quite possible provided we admit there is, for example, only a 2% chance that this is true.
The public does not consider the implications of claims for small detected changes with a large uncertainty. If the public were all educated and sharp-eared consumers of information they would insist that the purveyors of calamity and disaster state the claims properly. Clearly, scientists are not going to do this unprovoked.
The reason I said “2%” is because there is 98% chance that the true answer lies outside the little range within which the “0.1 degrees” lies. That’s just how it is folks.
The British press – notably the Guardian, chief doomsayer among them all!
Carbon 500
Is that the Manchester Grauniad ?
cheers
Mike
Willis, at the very outset of the AGW hysteria, I’ve regarded the leftist media as the most culpable “dealer” in the whole supply chain of charlatans who contrive to benefit themselves from this perfidy –
1. the media is addicted to ‘click-bait’ stories;
2. dodgy academics know the media will publish every alarmist press release they put out;
3. the media knows that politicians will shamelessly jump aboard any issue that can garner them votes;
4. the circle of perfidy is completed when university administrators work on their academics to produce research that will pressure politicians and bureaucrats to direct grant funding to those projects that they can claim are “doing something”.
And so it goes on and on and on.
Hopefully, in the not too distant future, there will be another “Enlightenment” event that will cease the current auto-da-fe inquisition being inflicted on climate data.
Willis,
Not the Hiroshima bombs again!
This old chestnut was discredited years ago, I thought.
I remember when this bogeyman was being pushed and it was claimed the earth was subjected to 5 Hiroshima bombs per second by global warming, someone pointed out that the Sun was bombarding the earth’s atmosphere with 1700 Hiroshima bombs a second.
Did another 5 really matter?
It does once it is translated into Manhattans of ice melted away in the Arctic!
Nicholas,
As distinct from the Antarctic gaining Manhattans of Polar Ice!
I prefer to measure in ham sandwiches. The oceans are warming by 85 million ham sandwiches a second. Don’t tell AOC or she will say this is unfair to the vegan fish.
Impossible to melt Manhattan islands worth of ice with 5 Hiroshima bombs.
Leaving your Manhattans and ice reference as the ice in a few shallow Manhattan drinks.
Try cutting back.
Interesting. The results of the Von Shukman paper using Argo float data to 2012 was 0.62w/ sq m (+/- around 0.1w/sq m). This is from memory. It might be 0.64 +/- 0.09 but it’s close. Also, she did same thing in 2010 when the float deployment wasn’t quite complete and got 0.72w/sq m.
Her reference to 0.003°C accuracy was for the precision of the thermometers on the Argo floats themselves, not the overall accuracy of the gridded result which involves…models. As you can see from the above, her error is ~1/6 of the result and that error translates directly in the temp conversion because the relevant water mass and specific heat capacity of water are known constants.
Von Shukman seemed to be the go-to authority around 2012. I’ve not followed OHC in any detail for a long time since then though.
Note that “device resolution” is not at all the same concept as “device precision”, and neither is equivalent to what is known in the scientific world (as opposed to the fantasy world of climate science) as “accuracy”.
In fact these are all quite distinct concepts, not to mention different in how they help to try to determine exactly what has been measured and how anyone should have confidence that the result given is meaningful and properly expressed.
Metrology is an entire discipline in and of itself…as is statistical analysis.
Neither of these fields of study has ever been discovered to exist by any of the alarmists, let alone incorporated into the malarkey they (seemingly reflexively) spewed forth.
My frequent thoughts, exactly, but you are much more eloquent than I could ever hope to be.
In looking at Willis’ error bars in his digitised graph you can eyeball the 2010 error bar and see that it’s roughly 1/6 of the full reading. This is in keeping with Von Shukman 2010 and 2012 +/- error as stated in my comment above.
So it also bears out my point that the 0.003°C is related to the precision of the Argo float thermometers and not the accuracy of the modelled sum of gridded areas. The precision of the Argo float thermometer would’ve been calibrated in the laboratory before deployment. This would explain such fine precision as being credible whereas 0.003°C is indeed not credible for the OHC or its ocean temperature derivative that Willis derived.
Any measurement, as well as any calculation derived from any measurement, can only legitimately be reported to the number of significant figures as the least certain element of the calculation.
People that work in labs know how difficult it is to accurately measure even a small vessel of water to within one tenth of a degree.
The resolution of the device simply gives the maximum theoretical precision, and the calibration standard the maximum theoretical possible accuracy.
These guys think measuring random places in the ocean a few times a month lets them translate this theoretical value (if one wants to be generous and assume that the manufacturer’s supplied info is true without fail and in every case) of the sensor in the ARGO float, to the accuracy of their calculation for the heat content of the entire ocean and how this is changing over the years.
No explanation for how they have the same size error bar in the year 2000, prior to a single ARGO float being deployed, as they show in 2010, when they project had only recently reached an operational number of devices deployed.
And not much different (in absolute terms) than decades prior to that when virtually no measurement of deep water had ever been made, and electronic temperature sensors had not even been invented yet.
On top of that…it needs to be mentioned in every discussion, that all of the results they get are at several stages adjusted and “corrected”, and made to match the measured TOA energy imbalances between upwelling energy and incoming solar energy.
Just what is the “right” temp for the oceans? We are in an ice age so I would guess that we are running a little cold.
I would like things to be a little warmer as our governor here in NY is working hard to destroy our energy infrastructure and I’ll be freezing to death if the climate doesn’t warm a bit.
I’d like to know how many HBPS (Hiroshima bombs per second) are “going off” when the Fleet of Elon’s Teslas are charging/discharging every day.
Need some balancing perspective here.
How many Tesla cars have been sold in the US so far? 2012-2020 over 890,000. Compare to just Ford F-series pickup truck sales per year:
2019 1,000,000 or so…
2018 909,330
2017 896,764
2016 820,799
2015 780,354
2014 753,851
2013 763,402
2012 645,316
The Ford F-Series outsells all makes and models of EV’s combined in the US by a wide margin.
Why is market capitalization of Tesla greater than Ford and GM combined? Market expectations for Tesla must include not only huge growth in car/truck sales but also other things not yet identified. Or maybe Tesla stock is just over priced.
“Oceans are warming at the same rate as if five Hiroshima bombs were dropped in every second”
Jan 2014 Skeptical Science:
“… in 2013 ocean warming rapidly escalated, rising to a rate in excess of 12 Hiroshima bombs per second”
https://skepticalscience.com/The-Oceans-Warmed-up-Sharply-in-2013-We-are-Going-to-Need-a-Bigger-Graph.html
Well that’s the first thing you said that’s not true. It is quite believable the hysteria surrounding this.
Oh we forgot !!!!
SUB-SEA VOLCANO,s
Shhh! Don’t introduce nasty old facts……
All those Hiroshima’s seem to be causing nuclear winter in BC.
Every second day there’s a fresh layer of fallout needing to be plowed and shovelled.
It’s just about time to see a travel agent about a trip to somewhere warmer. Maybe Montreal.
I just received the Hiroshima bomb analogy from the ‘scholarly’ Sigma Xi Smart Briefs, relying on a second hand source. Who in academia are teaching that second-hand sources are authorities? Thought that we were relying on climate scientists who rely on second-hand data?
https://edition.cnn.com/2020/01/13/world/climate-change-oceans-heat-intl/index.html
everybody signs on cause it’s publish or perish…and then when one of the others does a paper…the others jump on it too…
…only problem I have with Argo…each one floats around in the same glob of water
Argo in situ calibration experiments reveal measurement errors of about ±0.6 C.
Hadfield, et al., (2007), J. Geophys. Res., 112, C01009, doi:10.1029/2006JC003825
At WUWT a few years ago, usurbrain posted a very comprehensive criticism of the accuracy of argo floats.
The entire paper is grounded in false precision.
Just like the rest of consensus climatology. It’s all a continuing and massive scandal.
Thanks, Pat, always good to hear from you. I hadn’t seen that study. From the abstract:
Don’t know whether to laugh or cry …
w.
Which means they don’t know if the oceans have warmed or cooled, period.
The way I look at it, Jeff, given atmospheric temperatures are generally increasing, a process that is influenced minimally by increased levels of CO2, it seems safe to extrapolate that the upper levels of the oceans are warmer than before and thus injecting massive amounts of heat into the atmosphere.
Could be Chad. But the paper reviewed by Willis doesn’t demonstrate it.
I don’t think we really know how much “the Earth has warmed” in any given time frame.
Thanks, Willis. It’s always a pleasure to read your work. It’s never short of analytically sound and creative.
“Don’t know whether to laugh or cry …”
I am gonna stick with anger, personally…tempered with a overwhelming and deep seated fatalism, and rounded over time by a raging river of humor.
“Argo in situ calibration experiments reveal measurement errors of about ±0.6 C.”
….that’s all of global warming
Exactly right, Latitude. And the land-station data are no better.
Except for the CRN data, which are of limited coverage (the US) and date only from 2003.
Yes, the USCRN is gold standard.
And the CONUS trend based on USCRN is 0.12 C/decade higher than that of ClimDiv (a very significant divergence).
I couldn’t find any reference to that figure in that paper?
I did find this “The temperatures in the Argo profiles are accurate to ± 0.002°C”
http://www.argo.ucsd.edu/FAQ.html
Believe me, I’m not a warmist, but where did you get that figure from??
From this and Figure 2, we conclude that the Argo float measured increase in global ocean temperature is 0.08C +/- 0.6C (face palm)
‘Science’ by Kevin Trenberth and Michael Mann……
I see, thanks for that!
I knew a university type that wrote a paper with a long title.
Then the title was changed, and a bit more, and the thing was published in a different journal. Repeat. Again, and again.
At an end-of-year party the grad students gave each of the faculty a “funny” sort of gift. One person was given rose-colored glasses.
The “change-the-title” person was given an expanded resume with each of his publication titles permutated in every manner possible.
This made for a large document.
I, of course, had nothing to do with any of this.
@Willis
http://159.226.119.60/cheng/images_files/OHC2000m_annual_timeseries.txt
Thanks, Krishna, appreciated. Curiously, that one goes back to 1940 but the one in their study starts in 1958 …
w.
@Willis
their study starts in 1958 …
So, not all data have an ARGO origin…
Ah, splicing. That’s where Dr. Mann shines.
i can harly beleive they can measure it too.. but then we have to explain this regular increase..it should be a mess..
Exactly my thoughts. A surprisingly noiseless plot for even a 100% coverage of a uniform ocean. Surely an El Nino year affects the average temperature by a hundredth of a degree, let alone the average of of the poor coverage – or extremely poor pre Argo.
SST has a very small effect when you are covering down to 2km.
There are changes to deeper currents. The Humbolt current is affected down to 600m. There is half a degree effect at the surface, which would be bigger than the plot for the average down to 2000m. My comment is more about the effect on limited sampling even if the actual average remained the same eg a shift of warmer water (0.01°C) to where it is sampled.
Excellent!
I am always amazed they think numbers like 0.003C is an accurate variable range when the equipment used to gather data doesn’t even remotely reach that level of accuracy in the first place.
Interesting, because on a paper where the accuracy requirement for the Argo floats is stated to be 0.005 C, so higher than the 0.003 C they claim to measure year over year…
https://www.google.com/url?sa=t&source=web&rct=j&url=https://www.terrapub.co.jp/journals/JO/pdf/6002/60020253.pdf&ved=2ahUKEwjZs5qD_oPnAhUFA2MBHV-8BhEQFjACegQIBBAB&usg=AOvVaw2zagHkNd5NPKta2pinjwLU
I can totally see how they could convince themselves that, by using the power of averaging, they could produce such accuracies. The technique works well in some circumstances, in the presence of truly random noise. The problem is that nature usually does not throw truly random noise at us. Nature likes to throw red noise at us.
Red noise has decreasing energy as frequency increases. White (truly random) noise has equal energy at all frequencies. That means the energy of white noise is infinite, clearly impossible.
Because of the low frequencies of red noise, it tends to look like a slow drift. For that reason, averaging a signal containing red noise does not, at all, improve accuracy.
The problem with statistics is that most scientists do not understand the assumptions they are making when they apply statistics. I have a hint for them: the ocean is not remotely similar to a vat of Guinness. link
Ha! Averaging works just fine when I’m grinding a crankshaft. I just use a wooden meter stick and measure 50K times,,, all the accuracy I want, great tolerances.
(Three econometricians) encounter a deer, and the first econometrician takes his shot and misses one meter to the left. Then the second takes his shot and misses one meter to the right, whereupon the third begins jumping up and down and calls out excitedly, “We got it! We got it!” link
You must be the guy who did the last overhaul on my Jaguar E-Type.
You don’t mention if that was good or bad.
There is one overhaul item that is different than 99.9% of other cars. valve lash
Of all the car servicing disasters I have heard, the worst was for Jag E-Type. It seems that there overpowering temptations to take short cuts that don’t turn out well.
I’m guessing Ron isn’t a satisfied customer.
The power of the Central Limit Theory!!
Even if it was white noise, that would only matter if they were repeatedly measuring the same piece of water. Measuring a second piece of water, hundreds of miles away, tells you nothing new about the piece of water right in front of you.
Hi Willis! Why so many names on the paper? They’re in it to get a paper count: it’s like beach-bums showing off their pecs: it’s a confirmation- in their eyes- that they are the best. I have a thing, never believe the 5-star on Amazon.
It is an LPU (Least Publishable Unit) exemplar. i.e. a confected, sexed up document aimed at a) publicity, b) some rationale for funding and c) free sexed up content bribes to the backside sniffers in the msm.
@Willis PS
monthly
http://159.226.119.60/cheng/images_files/OHC2000m_monthly_timeseries.txt
Outstanding, thanks.
w.
Willis,
Go to Le Quere et al 2018 which is the annual ‘bible’ paper on the Global Carbon Budget which I have been studying, particularly to gauge the error margin for the Oceans.
There are 76 Co-authors (!) and it must be the holy grail for mainstream climate scientists.
Thank you Willis. Great conversion to reality mode.
Highly related, also, thanks Anthony et al., for getting the ENSO meter back on the sidebar.
Brilliant. Thank you. I saw this splashed all over the front page of the Grauniad (no, I didn’t buy it) and found it hard to tie up with the recent peer-reviewed publications reproduced over at Pierre Gosselin’s brilliant site (No Tricks Zone). You have clarified the situation.
http://www.woodfortrees.org/plot/hadsst3gl/from:1964/plot/hadsst3nh/from:1964/plot/hadsst3sh/from:1964/plot/hadsst3gl/from:1964/trend
Willis. Thanks for the post. I agree with you on your comments abt their report. There are some of us who think the reason for the difference in nh SST and sh SST is pollution.. .
The reviewers need to be disqualified from any future vetting.
Willis thanks for another lesson!
The magnitude of our oceans still challenges my little brain.
Mac
I hope I’m alive when the world wakes up to the ginormous scientific fraud that is being perpetrated by Michael “Piltdown” Mann et al.
Thanks for putting this massively hyped paper into context. It’s all over the broadsheets in the U.K.
Perhaps you could clarify one thing that bothers me on OHC? The common claim in the press releases for papers like this is that “90% of warming due to increases in GHG is in the oceans” yet this only represents ca.70% of the earth’s surface.
At the equator this rises to ca.79%, and the DLW, due to higher air temps, will be greater there than at other latitudes. Is that sufficient to support the ‘90% ‘ claim, or is the figure simply alarmist padding?
James, we don’t actually know how much “warming due to increases in GHG” there is. It might actually be zero. The claim that 90% of it is “in the oceans” is simply not supportable.
w.
They say 90% , that is Trenberth’s “missing heat. ”
They “know” the heat is there because their ( failed ) models say it must be. They can not find it in the surface record, so they hide it in the deep ocean where no one can check their work.
In reality the missing heat is in their heads. That is why they keep exploding.
If 90% of the heat is in the oceans, and the result is they have warmed by a tenth of a degree in sixty years, can we call it a day and cancel the ‘climate crisis’?
Seems reasonable to me.
Obviously you haven’t heard… “60% of the time, it works every time….”
90% of statistics are wrong, and the other half are mostly just made up.
So here’s the hot news. According to these folks, over the last sixty years, the ocean has warmed a little over a tenth of one measly degree.
I know you’re not trying to be funny, but worrying about a + 0.12 K change since 1960 kinda makes a joke of worrying about the “hidden” warming.
“I know you’re not trying to be funny, but worrying about a + 0.12 K change since 1960 kinda makes a joke of worrying about the “hidden” warming.”
Temperature isn’t heat content.
Mass and specific heat come into it.
Try working out what that 0.12K delta would look like in it was to be applied to the atmosphere.
You’ll need the fact that the oceans have a mass 250x that of the atmosphere and that the specific heat of water is 4x that of air.
I was thinking that one could make quite a bit of money by betting people that they could not tell which bowl of water sitting in front of them was warmer…iffen the difference was even 1° , let alone one tenth of that amount.
How many people could tell when the room they were sitting in had warmed by a tenth of a degree, or even one degree?
Typically a room has to change by that amount (~1° C) before a wall thermostat kicks on or off, simply to avoid short cycling of the (air conditioning or heating) equipment being regulated.
Put another way…even a room which is climate controlled by a properly operating thermostat, the air temp will vary by at least one or two degrees (F, or 1°C) between when the things kicks on and when it kicks off.
This is the whole reason for reporting a temperature change in the ridiculous unit of a zettajoule to begin with, and why published MSM accounts of such a study is then helpfully translated into the readily relatable (to the average person in one’s daily life) unit known as one Hiroshima.
They could relate in terms of units such as “the amount of energy delivered by the Sun to the Earth in a day”…but that would make the number appear as meaninglessly tiny as it really is.
Try working out what that 0.12K delta would look like in it was to be applied to the atmosphere.
I don’t care if the 0.12K delta occurred for a million gigatons of mass, it would raise the temp of a flea, guess what, 0.12K. You were trying to make some kind of “point”, and you blew it.
And to add, all your “point” demonstrates is the obvious — the oceans have a huge thermal inertia and can absorb/release large amounts of energy with only small temperature changes. That’s a very good thing because it greatly decreases temp changes due to varying energy inputs.
Thanks to Krishna, I can now demonstrate just how accurate my hand digitization of the data graph actually was. Here’s the comparison …
RMS error of the digitizing is 1.1 ZJ.
w.
Very nice work, Willis!
Do you use WebPlotDigitizer?
Or some other tool?
Or do you just pull up the image in MS Paint or similar, and enter the pixel values in a spreadsheet, and then convert them yourself?
I’m running a Mac, and I use “Graphclick” for digitizing.
w.
You’re right Willis it’s nonsense.
The fact that the atmosphere cannot heat the ocean deserves a mention in my opinion. Heat flows from the ocean to the atmosphere and then lost to space, never the other way round.
It’s the sun, stupid 😀 😀
As always said 😀
Good comment, John.
“the atmosphere cannot heat the ocean …”
True, however, it can, and does, slow it’s cooling.
Just like it does over land.
It’s called the GHE, caused by GHGs.
But we don’t know if any warming or cooling is human caused. Their margin of error means they don’t even know if the oceans are warming or cooling.
Jeff Alberts
Their margin of error for the data shown in the first chart in Willis’s post (their Fig. 1) is stated as “… 228 ± 9 ZJ above the 1981–2010 average.” Their best estimate far exceeds the error margin.
“Their margin of error means they don’t even know if the oceans are warming or cooling.”
I think this is the most important point to come out of this article. The alarmists are making exaggerated claims based on what? Based on a margin of error in their measurements of 0.6C!
See Connolly and Connolly radiosonde data. Ain’t no greenhouse effect bro.
I don’t believe that heat flow from the atmosphere to the oceans can be ruled out, but the issue here is the vast difference in the thermal capacity of air and water. If there was a situation where the atmosphere was warmer than the oceans, so little heat would flow that its effect on the ocean temperature would be very small.
Why not ?
Uncertainty is one of those concepts that alarmists can’t understand, for if they did, they would know with absolute certainty that they can only be wrong. The most obvious example is calling an ECS with +/- 50% uncertainty ‘settled’ where even the lower bound is larger than COE can reasonably support.
Great article, as usual! I look forward to your down-to-earth explanations and analysis for those of us who have some science and/or engineering background, but are not experts in the field of weather or climate and have had reservations about the “certainty” some have on how the complex systems of our planet work.
I was fascinated with the whole Argo project when it started up years ago, but noticed that when its data didn’t immediately confirm rapid “global warming” it dropped out of the news. Thanks again for giving us some perspective on the actual magnitude of trends in our ocean systems.
Willis,
At their provided link:
http://159.226.119.60/cheng/
I did find this data in .txt tabular form here:
http://159.226.119.60/cheng/images_files/OHC2000m_annual_timeseries.txt
http://159.226.119.60/cheng/images_files/OHC2000m_monthly_timeseries.txt
============================
My comments:
Their paper states, “The OHC values (for the upper 2000 m) were obtained from the Institute of Atmospheric Physics (IAP) ocean analysis (see “Data and methods” section, below), which uses a relatively new method to treat data sparseness ….”
IOW, that made up a lot of fake data to infill as they liked.
To wit from their Methods: “Model simulations were used to guide the gap-filling method from point measurements to the grid, while sampling error was estimated by sub-sampling the Argo data at the locations of the earlier observations (a full description of the method can be found in Cheng et al., 2017).
Mann and Trenberth likely were recruited and brought onboard during manuscript drafting by Dr. Fasullo. Mann was listed as senior author, but that was just more pandering to help get the paper published in high impact Western journal. They might as well have put Chinese President Xi as senior author.
What you have to love about these lying perps is the way they ended the manuscript:
“It is important to note that ocean warming will continue even if the global mean surface air temperature can be stabil- ized at or below 2°C (the key policy target of the Paris Agreement) in the 21st century (Cheng et al., 2019a; IPCC, 2019), due to the long-term commitment of ocean changes driven by GHGs. Here, the term “commitment” means that the ocean (and some other components in the Earth system, such as the large ice sheets) are slow to respond and equilibrate, and will continue to change even after radiative forcing stabilizes (Abram et al., 2019). However, the rates and magnitudes of ocean warming and the associated risks will be smaller with lower GHG emissions (Cheng et al., 2019a; IPCC, 2019). Hence, the rate of increase can be reduced by appropriate human actions that lead to rapid reductions in GHG emissions (Cheng et al., 2019a; IPCC, 2019), thereby reducing the risks to humans and other life on Earth.”
What a stinkin’, heapin’ load of dog feces. “Reducing risks to humans and other life?” They might as well ask for offerings to volcano gods and conjure up voodoo incantations and spells. They have to reveal an agenda and appeal to the IPCC to infill their conclusions with junk science claims.
Maybe someone should point-out to Mann, Trenberth, and Fasullo that this Chinese-origin paper (sponsored by the “Chinese Academy of Sciences”, the “State Key Laboratory of Satellite Ocean Environment Dynamics, Second Institute of Oceanography, Hangzhou”, and the “Ministry of Natural Resources of China, Beijing”) is from the largest global anthro-CO2 emitter, a nation with no reduction INDCs under Paris COP21, and that makes this laughable piece of propaganda: “reduced by appropriate human actions that lead to rapid reductions in GHG emissions.” The Chinese have no intention to rapid reductions” and those 3 TDS afflicted stooges know that.
These 3 Stooges (Mann, Trenberth, Fasullo) just let themselves be the useful idiots for the Chinese Communist Party and their economic war on the West and the UN’s dedicated drive for global socialism.
Thanks, Joel. Formatting fixed.
w.
Voodoo incantations are more reliable than the fantasy of measuring temperature to three decimal places of accuracy when the measuring device only measures two decimal places. At least voodoo might be correct occasionally.
Here, the term “commitment” means that the ocean (and some other components in the Earth system, such as the large ice sheets) are slow to respond and equilibrate, and will continue to change even after radiative forcing stabilizes (Abram et al., 2019).
Without any “forcing” ( ie radiative imbalance ) the massive heat reservoir of the oceans will continue to warm.
Wow, they have officially abandonned one of the axioms of physics: the conservation of energy.
Now that’s what I call “missing heat” !!
greg
Amazing that they’ve fallen for the naïve error of believing in thermal inertia, in the same way that a heavy rolling object has kinetic inertia. There is no thermal inertia. Heat input stops, heating stops. Thermal “inertia” is used as a metaphor for massive heat capacity of oceans, but it indeed does not exist.
Now they’re on record as believing in magic.
Useful (well compensated) idiots?
Damn you and your facts Willis, a whole lot of time and money went into making that graph look scary.
Yes, conversion to reality mode is much appreciated.
I’m quite sure CNN and LAT will be telling us what a zettajoule is any time now. not
The fact that they go back 60 years to get such a small result is indicative of the problem with Ocean Heat Content. Before ARGO the data was laughably unreliable, canvas buckets, Engine Cooling Water intakes from two meters depth to ten meters, and almost nothing from the entire Southern Hemisphere where most of the ocean is found. ARGO data itself has been adjusted as well.
Just Bad Science…
Just Bad
Science…The data isn’t “bad”. It is just data. Bad is the use of it without keeping the limitations in mind.
Thanks for the expose’, Willis!
RE: “….Kevin Trenberth and Michael Mann. Not sure why they’re along for the ride…”
There seems to be a persistent correlation between these ‘authors’ and deliberate attempts to mislead and scare people into participation in their zeta-deceits whilst masking their +/-0.001 truth content.
I smell fraud/tampering. The line is way to lineair.
The fraud is in the extra data they created using models.
“Model simulations were used to guide the gap-filling method from point measurements to the grid, while sampling error was estimated by sub-sampling the Argo data at the locations of the earlier observations (a full description of the method can be found in Cheng et al., 2017). ”
https://link.springer.com/content/pdf/10.1007/s00376-020-9283-7.pdf
Figure 3 of the paper shows trends amongst the Indian, Atlantic, Southern, and Pacific Oceans to a depth of 2,000 meters. Except for the Southern Ocean, the graphic appears to show significant areas that are cooling. And, there are large areas of the Pacific showing no change at all. So what explains these anomalies? And, is a maximum depth of 2,000 meters valid inasmuch as the ocean is much deeper than that in certain locations?
The paper claims to have data measurements below 2000 m after 1991.
” The deep OHC change below 2000 m was extended to 1960 by assuming a zero heating rate before 1991, consistent with Rhein et al., (2013) and Cheng et al., (2017). The new results indicate a total full-depth
ocean warming of 370 ± 81 ZJ (equal to a net heating of 0.38 ± 0.08 W m−2 over the global surface) from 1960 to 2019, with contributions of 41.0%, 21.5%, 28.6% and 8.9% from the 0–300-m, 300–700-m, 700–2000-m, and below-2000-m layers, respectively. “
iirc, HadSST3 has ±0.03°C uncertainty, so these guys claim 10X better….
However, the rates and magnitudes of ocean warming and the associated risks will be smaller with lower GHG emissions
Climatologists just don’t know positive MEI, not CO2 or GHGs, drives SST growth:
The ‘pros’ just don’t seem to realize CO2 follows Nino34, MEI, OLR:
Human GHGs don’t change the weather or climate. ML CO2 naturally follows the climate.
The Argo buoys may well take measurements of the top 2,000 metres of the Earth’s oceans, but these oceans average some 5,000 metres in depth, so we basically know diddlysquat about 60% of the overall oceanic volume.
Not to worry. They made up data to cover that area and show it in their charts starting in 1991 even before Argo.
We must all assume
the depths filled with missing heat
boil bottom feeders
How can this be published? The ‘data’ for the most part is made up, and uncertainties are huge. I would doubt the temperature ‘data’ prior to 1978 knowable to + or – 1C. They show 50 times more precise?
For the technically obsessed of us, how did you digitize the graph, on screen or with an actual digitizer?
Love your posts. You are a gifted creative writer and a supurb technical writer. Rare combination. We are grateful indeed.
Thanks for the kind words, Tom. I not only write the posts, I do the scientific research for them as well. Regarding digitization, I’m running a Mac, and I use “Graphclick” for digitizing.
w.
“supurb technical writer”
Indeboobably.
OT, but Australia has reduced its per capita CO2 emissions by some 40% since 1990
http://joannenova.com.au/2020/01/global-patsy-since-1990-each-australian-have-already-cut-co2-emissions-by-40/
Yes, the Australians only breathe out 60 times for every 100 times they breathe in.
That’s coffee all over my keyboard.
Recent bush fires have erased that and then some. Not that the CO2 matters.
But the rains to Australia will return surely as the the next La Nina will be a monster. Just as California’s and Texas Perma-drought claims of 7 years ago were erased. If the climate change socialists weren’t lyin’, they wouldn’t be tryin’.
Estimates of CO2 from fires – 400 megatonnes, likely a high estimate. That would require a fuel load of 44 tonnes/hectare, which is right at the top of the possible fuel load per table 9.2 here.
Aussie emissions 2018 – 560 megatonnes.
So … big, but not bigger than the Australian emissions.
w.
Willis,
You did not plot ocean temperature in degrees C, but variation in temperature from the average level in degrees C. I know that is what you meant, but it can be confusing to some.
We had the same news flash about a year ago. Also where there was a conversion to joules to make the number bigger
“we’re supposed to believe that they can measure the top 651,000,000,000,000,000 cubic metres of the ocean to within ±0.003°C”
Sounds easy, Australia BOM thinks it can “correct” daily temperatures at a weather station in 1941 using the daily data from 4 “surrounding stations” located 220, 445, 621 and 775km away with totally different geography (coast versus 4 inland) that only have daily temperature records from the late 1950s to the early 70s.
Now that’s a neat trick.
Thanks for preparing this post, Willis. When I saw a news headline for the paper, I thought, Oh, no. Not again.
The last post I prepared on the same topic was about a year ago:
https://wattsupwiththat.com/2019/01/23/deep-ocean-warming-in-degrees-c/
For anyone interested, the cross post at my blog is here, too:
https://bobtisdale.wordpress.com/2019/01/23/deep-ocean-warming-in-degrees-c/
Regards,
Bob
And they spend how many resources (human and material) to get these results?
According to local press, the EU commissioner for «whatever» has just announced 100.000.000.000 euros «to stop CO2 and protect natural resources».
This is getting insane…
Getting?
Sorry, English is not my «first language»…
That’s a joke implying that, in this case, it has been crazy for a long time.
Considering only short wave radiation can warm the ocean, any ocean heating is caused by the sun.
Thus placing a heavy burden on those saying surface heating is due to anything other than the sun as they must now take their Zeta joules off any warming calculations they attribute to greenhouse gasses
Scott, longwave does indeed warm the oceans. See my post “Radiating The Ocean” for reasons why.
w.
Scott:
Be sure to read the many comments on Willis’ 2011 post, challenging his claim that “longwave does indeed warm the oceans.” This ex cathedra pronouncement is made by one who believes that there’s no difference between the LW response of solid earth surfaces and that of water–which evaporates.
The “sky dragon slayers” claim that a warmer ocean can’t be warmed by longwave infrared radiation from CO2 in a cooler atmosphere because they confusedly imagine that the 2nd Law of Thermodynamics prohibits it. They are wrong.
Alternately, it is occasionally claimed that longwave infrared (LWIR) radiation doesn’t warm the ocean because it is absorbed at the surface and just causes evaporation. That claim is also false, but less obviously so. That appears to be the fallacy which has misled you, 1sky1, so I’ll address that one.
A single photon of 15 µm LWIR radiation contains only 1.33E-29 J of energy.†
To evaporate a single water molecule, from a starting temperature of 25°C, requires 7.69E-20 J of energy.‡
That means that to evaporate a single molecule of liquid water at 25°C would require the amount of energy provided by absorption of nearly 5.8 billion 15 µm LWIR photons.
In fact, it would require the absorption of about 9.4 million 15 µm photons to merely raise the temperature of one molecule of water by 1°C.
So water can obviously absorb “downwelling” LWIR radiation without evaporating.
– – – – – – – – – – – – – – – – – – – – – – – – – – – – – – – – – – – – – – – – –
† The energy in Joules of one photon of light of wavelength λ is hc/λ, where at 15 µm:
h = Planck’s constant, 6.626×10E-34 = 6.626E-34
c = velocity of light in a vacuum, 3.00E+8
hc = 6.626E-34 × 3.00E+8
λ = 15 µm = 15E-6
hc/λ = 6.626E-34 × 3.00E+8 / 15E-6 = 1.33E-29 J
So, one 15 µm photon contains 1.33E-29 J of energy.
‡ Water has molecular weight 1 + 1 + 16 = 18.
So one mole of water weighs 18 grams = Avogadro’s number of molecules, 6.0221409E+23.
So, one gram of water is 6.0221409E+23 / 18 molecules.
540 calories are required to evaporate one gram of 100°C water, plus one calorie per degree to raise it to 100°C from its starting temperature.
So if it starts at 25°C, 540+75 = 615 calories are needed.
So one molecule requires 615 / (6.0221409E+23 / 18) = 1.83822E-20 calories to evaporate it.
1 Joule = 0.239006 calories, so
one molecule requires 1.83822E-20 calories / (0.239006 calories/joule) = 7.69109E-20 J to evaporate it.
Your theoretical calculations do not alter geophysical realities. Indeed, water need not entirely evaporate upon being irradiated by LWIR. Nevertheless, since practically all such radiation is absorbed within a dozen microns of the surface, it’s only the skin that is warmed directly and profoundly, thereby decreasing its density strongly and producing an adjacent Knudsen layer in the air. That development makes it very difficult to mix heat into any subsurface layer, let alone the top 2000 m of the ocean. It’s the warming of that layer that is at issue here.
BTW, the observation-based maps of actual surface fluxes of Q, linked in my comment below, are found on pp. 42-43.
The point is that since it takes a measurable amount of time for a single molecule of water to absorb enough photons to increase it’s chances of evaporating, that is enough time for that water molecule to transfer some or all of the energy absorbed to other molecules of water.
1sky1, neither you nor anyone else has been able to refute the four arguments I put forward in Radiating The Ocean.
Your current claim is that the LW is all absorbed in the top dozen microns of the ocean and it cannot mix with the rest of the ocean, viz:
Average downwelling LW in the ocean is on the order of 360 W/m2, which is 360 joules/second/m2. A micron is a thousandth of a mm. One mm over an area of one square meter is one kg. One micron over one square meter is one gram. 12 microns is 12 grams.
It takes 4 joules to raise one gram by 1°C. We’re warming 12 grams, so it takes 48 joules to warm the surface layer by 1°C.
The water is getting 360 joules per second. That would heat your 12 microns of water by 7.5°C/second. If the 12-micron layer of surface ocean starts at say 25°C, it would start boiling in ten seconds …
Nice try, though. Vanna, what kind of wonderful prizes do we have for our unsuccessful contestants?
w.
Willis.. isn’t “boiling” also called evaporation taking the heat with it? I think the issue is LW photons don’t penetrate as much as SW ones. So the LW reaction with the ocean occurs mostly in the surface layers while the SW ones penetrate deeper before interacting.
Also the 360 w/m2 only occurs when the Sun is directly overhead and falls off as the spot rotates away (or you move north or south in latitude). And as the incidence angle increases so does the reflection to where it hits the critical angle.
What you are outlining is the “worst case” and from a real world perspective only occurs at a small spot on Earth at any given time. Maybe we can say LW radiation does impact the ocean temperatures, but not nearly what SW does.
neither you nor anyone else has been able to refute the four arguments I put forward in
Haven’t you made graphs before that depict the morning SST as cooler before daytime SW heating? There’s your answer.
Is the ocean surface warmer at dawn or at dusk? If it’s warmer at dawn (and not from upwelling) then the LW warmed it in the absence of solar SW. If it’s not warmer, as is the reality afaik, then LW doesn’t warm the ocean overnight.
Arguing photon exchanges misses what’s important: there’s no net LW warming, illustrating that colder air doesn’t warm a warmer ocean.
This plot indicates the atmosphere keys off the ocean:
The atmospheric LW isn’t warming the ocean, and the residence time for heat flow from the ocean hasn’t changed over time, being very linear with SST. The atmosphere consistently holds a 4% higher temperature than the ocean over a month than it receives, a short residence time:
The atmosphere consistently holds a 4% higher temperature than the ocean over a month than it receives, a short residence time:
Hotter land surfaces provide additional heating effects on top of ongoing ocean-air heat exchange.
The linear UAH-SST 4% factor would be non-linear with increasing LW if LW drove SST, and would be a perpetual energy machine, as the LW would raise the SST, increasing LW eventually, leading to runaway positive feedback loop ocean warming, which is not observed.
The water is getting 360 joules per second.
The equatorial ocean gets full TSI minus albedo at the sub-solar point. Evaporation occurs after morning insolation rises from peaking insolation, not at the daily average.
It’s remarkable how many naive rationalizations are invoked here in avoiding the actual thermodynamic behavior of water. Being a relatively poor heat conductor, molecular transfer is quite limited; local convective currents due to density gradients keep the warmest water strongly confined near the surface. Nor is heat flux in water exempt from following the NEGATIVE gradient of temperature specified by Fourier’s Law.
But the gong-show winner is the notion that the flux density of absorbed DLWIR need only be normalized by the thickness of water-layer to obtain its rate of temperature change. Not only does this inept calculation ignore that such rates are critically dependent upon temperature differences, but it fails to account for LWIR emissions from the surface as well as the strong COOLING produced by evaporation. We only have coupled LWIR exchange within the atmosphere, NOT any bona fide external forcing.
The real-world consequence is that on an annual-average basis LATENT heat transfer from the ocean to the atmosphere exceeds that of all SENSIBLE heat transfers by nearly an order of magnitude. That is what is shown unequivocally in the WHOI-derived maps I referenced. Self-styled dragon-slayers remain unequipped to deal with that reality.
Wind is responsible for much if not most of the energy that goes into creating water vapor. Where exactly is the frictional heating of the atmosphere onto the surface referenced in the back radiation pseudoscience? http://www.cgd.ucar.edu/staff/trenbert/trenberth.papers/BAMSmarTrenberth.pdf
We’ve had a lot of fog hear recently as warm air has moved over the cold damp surface, something else that apparently never happens.
Your sciency answer sounds so clever
But since when did water have to get to 100C to evaporate?
Does the sweat on your skin get to 100C to evaporate?
How do you think the surface “dries” when there is no sunshine
AC, if you are claiming that the LW simply goes into evaporating the skin layer, then we have a very big problem.
Globally, evaporation is estimated via a couple of ways as being on the order of 80 W/m2. This evaporates about a meter of water, which is the global average rainfall.
But if all 360W/m2 were to evaporate water, then we’d be seeing about 4 metres (~13 feet) of rain on average. So we know that the LW is not simply going into evaporation.
w.
Mr Eschenbach, I did not mention anything to do with LW, I was merely pointing out that water does not need to get hot to evaporate.
So all the calculations to show “100C” were very nice but totally immaterial to evaporation.
The other day when this thread first appeared, I went and reviewed what occurs in the situation where water evaporates off of a cool surface, because no one can deny that a wet shirt or a mass of water will indeed create water vapor without ever getting anywhere close to 100° C.
A shirt will dry out.
A puddle on the floor will evaporate, unless the R.H. is 100%
There are tables for the amount of energy required to evaporate water at various temperatures.
It takes more energy to evaporate cool water than to evaporate hot water.
Water can evaporate, as I understand it, without being hot, because molecules are not all moving at the same velocity in a liquid.
Some have enough energy to escape from the surface.
When relative humidity is at 100%, the same number of molecules of water are leaving the surface of the water as are entering it from the air (ignoring supersaturation).
Comparison of the oceanic surface fluxes of latent and sensible heat Q is available in global maps shown on pp. 41-42 of:
ftp://ftp.iap.ac.cn/ftp/ds134_OAFLUX-v3-radiation_1_1month_netcdf/OAFlux_TechReport_3rd_release.pdf
Please, Scott, stay away from the Principia crackpot disinformation website, and their sky dragon book. They kill brain cells.
I came up with a thought experiment a while back which when presented to even ardent believers in this idea of thermodynamic impossibilities, convinced them they were mistaken.
Here it is:
Consider two stars in space, each in isolation.
Both have the same diameter.
One star is at 4000°K, and the other is at 5000°K.
Each is in stable thermal equilibrium between heat produced in the core, transferred via radiation and convection to the surface, and radiation of this energy into space.
Now, bring these two stars into orbit with each other, such that they are as close as possible without transferring any mass.*
Now describe what happens to the temperature of each star?
Each now has one side facing another star in close proximity, where before they were each surrounded by empty space.
What happens to the temperature of each of the stars?
Can anyone seriously think that the cooler star does not cause the warmer star to increase in temperature and reach a new equilibrium, at a now higher temperature?
If so, what becomes of the photons from the cooler star that impinge upon the hotter star?
In truth, the interaction would be complex, but the scenario described is a common one which has long ago been observed and described by astrophysicists.
The details are homework for anyone still thinking that the laws of thermodynamics operate as believed by dragonistas.
*Alternative scenario: Postulate further that they are white swarf stars, cooling so slowly that they stay the same temp for the interval of the experiment.
Too much like LM
Serving ping pong balls from a vat pressure driven with 300 balls added each minute.
Now have someone hit 1 in 3 back into the vat.
Result pressure driven vat serves out at a rate of over 400 balls a minute in equilibrium.
Mods,
I believe I have a comment in moderation bin posted here a day or so ago.
Thanks.
Nicholas, I just looked in both the Pending and the Spam lists, no posts from you. Might have posted it in some other location or thread by mistake …
Sorry,
w.
Ok, thanks.
Sometimes I change my mind after writing something.
Angech,
What is LM?
The question is clearly presented, and has nothing to do with vats full of ping pong balls and pressurized air.
Photons are not little balls of solid matter being propelled by a jet of air.
I will accept your expertise on the subject of vats full of ping pong balls, and assert that it has nothing to do with what happens to stars in space and the photons of electromagnetic radiation they emit and absorb.
The warmer star will cool less quickly, it will not get warmer.
If the energy being generated by the first star stays the same, adding new energy from a second star, regardless of the second star’s temperature will cause the first star to warm.
“The warmer star will cool less quickly, it will not get warmer.”
Do you care to support this assertion with any rationale for believing how and why it may be so?
For one thing, stars are highly stable with regard to their temperature at the radiating surface, over vast stretches of time.
What do you mean when you assert a star is cooling?
Is the Sun cooling over time?
Not according to currently accepted astrophysics.
For one thing, the energy radiated away at the surface takes tens of thousand of years to get from the core to the surface…first through the radiative zone and then through the convective zone.
There are parameters which can vary in my thought experiment which are not delineated:
– Are the stars rotating, and if so how fast?
– How massive are the stars? Stars smaller than 0.3 solar masses are thought to be entirely convective, and those larger than about 1.2 solar masses are thought to be entirely radiative. Those in between are like the Sun, with an inner radiative zone and an outer convective zone.
But regardless of these factors, when the stars were in isolation, surrounded by empty space, they were in equilibrium between energy generated in the core and energy emitted at the surface.
Bring another star into close proximity changes the amount of energy in the outer layer of the star…it increases.
So the star is no longer in equilibrium.
Instead of cold space and no influx, one side of the entire star now has a huge influx of energy from the second star.
Consider some other cases: What if the two stars are initially identical in temperature?
Then what happens to each?
Now consider the case where one is only slightly cooler than the other.
How is what happens in the case when they are identical changed to any significant degree?
I am curious to know how well you are considering the actual situation described.
Paper titled “Reflection effect in close binaries: effects of reflection on spectral lines”:
“The contour maps show that the radiative interaction makes the outer surface of the primary star warm when its companion illuminates the radiation. The effect of reflection on spectral lines is studied and noticed that the flux in the lines increases at all frequency points and the cores of the lines received more flux than the wings and equivalent width changes accordingly.”
https://link.springer.com/article/10.1007/s10509-013-1660-6
True. I discuss this question at length in my post “Can A Cold Object Warm A Hot Object“. The answer, of course, is “compared to what”?
w.
Hi Willis,
Not sure if this response in directed to me, but if so…
I devised my thought experiment after participating, but mostly just reading the back and forth of others who frequent WUWT, many of the discussions on your threads on this topic and those of some other contributors.
At first I did not know what to make of the ongoing disagreements among people who are apparently very knowledgeable on the subject of radiative physics.
I thought…how can it be that there is this basic disagreement about something that should be able to be settled by easily devised experiments or observations?
After a while, I decided to think of a dramatic case of two objects at different temps, in close proximity, and how they would be different than if each was in isolation.
At one point I even found out decades old astrophysics papers on this exact situation, although not any that were written with the goal of answering this question.
I will see if I can find that material.
Hi Dave,
A few comments below, Willis posted a link to one of his articles from 2017.
I had participated in that discussion (I used to use the handle “Menicholas”) but had apparently not stuck around until the thread was no longer accepting new comments.
Anywho…I missed your reply to the example I gave to respond to one of the people who assert that CO2 is in too small of a concentration to have much effect on…I am not sure what, radiation, optical properties, etc.
I am not anywhere close to having enough expertise to jump in on one side or another of many of the issues of radiative physics, but whenever possible I try to add something, or ask a question, in those instances when I am not following a line of logic or if I have info that someone else may not have considered.
Here is the comment, about using lake dyes like Blue Lagoon to dye an entire pond or lake in order to inhibit growth of aquatic plants and/or algae.
I just wanted to say, I agree with your assessment that the dye molecules are obviously absorbing the photons and so are almost certainty warming the pond.
Beyond that…I am not sure what it says about any of the basic disagreements about physics that are ongoing.
I am only hoping one day to be around when everyone finds some way to agree on such questions.
https://wattsupwiththat.com/2017/11/24/can-a-cold-object-warm-a-hot-object/#comment-2219952
You replied:
“What an interesting comment, menicholas! I had never heard of Blue Lagoon and products like it. Thank you for teaching me something.
Let’s do the arithmetic. Four acre-feet = 5,213,616 gallons. So 1 qt / 4 acre-feet = 0.1918 ppmv, blocks enough light from passing through 4 feet of water to prevent algae growth on the bottom. Impressive!
A column of the Earth’s atmosphere has about the same mass as a 30 foot column of water. So blocking the light through just four feet of water should require an even darker tint than blocking the absorbed shades of light through the Earth’s atmosphere.”
And most of the quart of Blue Lagoon (and there are plenty of other such dyes) is water and possibly other solvents…so the concentration is very small indeed.
You should see what happens when a tech spills some on his clothing or skin!
When will they start using the Jeff Severinghaus proxy I wonder.
https://tambonthongchai.com/2019/09/08/severinghaus/
And when will they other sources of heat into account?
https://tambonthongchai.com/2018/10/06/ohc/
I think the error bars back near 1960 should be a lot larger.
“Perhaps there are some process engineers out there who’ve been tasked with keeping a large water bath at some given temperature, and how many thermometers it would take to measure the average bath temperature to ±0.03°C.”
Willis:
I spent my 40 year career in laboratories where tight temperature control and precise measurement were often key requirements. Not many cases where control better than +/- 0.1 C was necessary or possible. Liquid baths are easier to control than air due to thermal mass/inertia, but precision requires good continuous mixing. Without mixing, it would take an array of sensors distributed both vertically and horizontally to obtain an accurate average. Sensors with resolution in the hundredths to thousandths of a degree range are quite expensive. Much cheaper to stir the bath to assure a uniform temperature. A good example is a combustion calorimeter which uses a small propeller type stirrer and, in the old days, a single high resolution mercury in glass thermometer (read with a microscope) or, these days, an RTD. Of course in a calorimeter we just want to measure temperature change and not control it. Control of temperature to thousandths of a degree is incredibly difficult and only attempted were large budgets are available in my experience. Small commercial lab temperature baths are typically accurate to about 0.1 C and cost several thousand dollars.
Thanks, Rick. I figured that was the case, but you have the experience to support it.
w.
I neglected to add that often when you dig into calibration certificates you find that the Measurement Uncertainty of your high resolution instruments is much bigger than the you might expect. 0.1 C resolution may come with +/-1.0 C MU.
This rubbish has been running on Sky News UK all day and it was in the Guardian yesterday. I noticed John Abraham is in the list of authors, he of the Guardian now defunct “Climate Consensus – the 97%” that he ran with Dana Nuccitelli.
Abraham did something similar in the Guardian in January 2018 concerning 2017.
https://www.theguardian.com/environment/climate-consensus-97-per-cent/2018/jan/26/in-2017-the-oceans-were-by-far-the-hottest-ever-recorded
Old propaganda beefed up.
Yes, there is a historical sequence of implausible papers. Good that Willis exposed the flaws in this one. In 2018 it was Resplandy et al. which Nic Lewis critiqued and a year later it was retracted. In the meantime Cheng et al 2019 made the same claims of ocean warming drawing upon Resplandy despite its flaws. Benny Peiser of GWPF protested to the IPCC for relying on Cheng (2019) for their ocean alarm special report last year. Nic Lewis also did an analysis of that paper and found it wanting. The main difference with Cheng et al. (2020) is adding a bunch of high-profile names and dropping the reference to Resplandy.
https://rclutz.wordpress.com/2020/01/14/recycling-climate-trash-papers/
Thanks Ron.
” “The quality of research varies inversely with the square of the number of authors” … but I digress.”
Ha ha ha ha ha ha ha ha ha ha ha ha ha!
This looks like yet another ‘study’ in which the likely errors are significantly greater than the tiny result obtained heralded as catastrophic. The ambitious claim that such a totally trivial temperature alteration is (mostly) due to human activities, rather than being caused by variations in cloud cover, or some El Nino/La Nina cycle, or in the activity of tropical thunderstorms is pure nonsense.
So Willis (my hat’s off to you) says the oceans absorb 6360 units, while the total created by man is .6 units (please correct me if I’m wrong), meaning that the anthropogenic contribution potential is .0094% of the total.
That seems reasonable given the .003deg accuracy coming from the 3858 Argo bouys wandering about.
Finally, the missing heat Trenberth was moaning about…
So how exactly does this differ from the
IPCC’s AR4 Report Chapter Five Executive Summary Page 387
where it says:
The oceans are warming. Over the period 1961 to 2003, global ocean temperature has risen by 0.10°C from the surface to a depth of 700 m.
Really? 0.10° not 0.11 or 0.09 but 0.10° degrees of warming in 42 years. That’s real precision, that’s for sure.
The mistake Eschenbach makes here is to confuse 0.1 degree of warming in the first 2000m of the ocean as UNIFORM warming across those 2000m.
Unfortunately for us land dwelling creatures, the temperature of the ocean at 5m is a lot more important than at 1675m. And we’re all perfectly aware that surface ocean temperatures have already warmed by 1 degree. This is basic knowledge that Eschenbach stealthily avoids by pretending that first the ocean must warm by 1 degree at a depth of 2000m before we are allowed to say
So here’s a question for Eschenbach. Yes, lets say it’ll take five centuries for the ocean down to 2000m to warm 1 degree. By what amount do you believe that the ocean surface will have warmed in order for the average warming through 2000m to be 1 degree? Right now we’re at surface: 1 degree, 2000m: 0.1 degree. So my naive guess is 10 degrees.
When considering a depth of two kilometres, an average warming of 0.1 degree is truly remarkable.
Butts January 14, 2020 at 2:03 pm
Grrrr. This is why I ask people to QUOTE MY DANG WORDS!! I made no such claim and I have no such confusion.
“Warmed by 1 degree” since when? Our data older than about forty years is very uncertain. The Reynolds OI SST data says that since 1981 (the start of their dataset) the ocean has warmed by 0.4°C.
However, if you can accept greater uncertainty, the HadCRUT SST dataset says that the SST has warmed 0.7°C since 1870 …
So no, Butts, we’re not “perfectly aware” of any one-degree rise in SST for a simple reason … it hasn’t happened. It’s just more alarmism.
w.
Willis wrote: ” HadCRUT SST dataset says that the SST has warmed 0.7°C since 1870 …”
What about the data back to the Medieval warm period? That is what we need in order to tell if it is anything unusual.
Jim, the whole question of paleo SSTs is fraught with complexitudes … there’s a good paper called “Past sea surface temperatures as measured by different proxies—A cautionary tale from the late Pliocene.”
The abstract says:
Hmmm …
w.
Willis wrote:” whole question of paleo SSTs is fraught with complexitudes …”
Which, as far as I can tell, means we have no way of knowing if the current ocean temperature is unusual. If it is not, then it cannot be used as evidence of CO2 causing unusual warming.
“Which, as far as I can tell, means we have no way of knowing if the current ocean temperature is unusual.”
Oh yes, we have. It is not unusual. The proxies do have large margins of error (on the order of 1-2 degrees at two sigmas), but not so large that it isn’t easy to show that ocean temperatures were much lower during glacials and significantly warmer during peak interglacials, including the warmest part of this interglacial 8-10.000 years ago.
And there are qualitative “climate proxies” that are pretty definitive, like fossil coral reefs, or glacial dropstones or iceberg ploughmarks.
Oh, snap!
Someone get a bucket of water to revive Butts with!
I’d suggest a bucket used to measure SST…
As Willis correctly asserts, the notion of measuring the top two kilometers of the whole ocean volume to such precision is ludicrous.
For the study authors to assert any sort of confidence in the accuracy of the result is even worse, IMO.
And several reasons for these doubts exist, some of which are not even debatable:
-The ARGO floats are not evenly distributed; each one covers a stupendously huge volume of water.
-There are large area where there are zero floats, including the entire Arctic Ocean, all of the coastal regions, any areas of the sea that are shallow banks and continental slopes.
-The floats do not go all the way to the bottom, where there are large variations in water temp over the global ocean, and so the import of the results, even if they are as asserted, are dubious at best…even if it were not such a tiny change in actual temp.
– The floats are not checked or recalibrated in any sort of systematic or ongoing basis.
– And perhaps the worst indictment of the methodology and results is, that when the results of the ARGO floats were first analyzed after deployment had reached what was considered a sufficient number of floats to be meaningful, what they showed was that the ocean was actually COOLING! Since that was not what was desired…or as they phrased it, what was “expected”, it was assumed the result was erroneous and the raw data was adjusted upwards until it showed warming!
So ever since, all the data has been adjusted upwards, guaranteeing that warming would be what was shown, no matter what was actually measured, let alone what the reality in the ocean was.
It matters not at all that they were able to come up with a justification for making the adjustment.
Everyone knows that the results would not have been adjusted downwards for any reason, even a legitimate and obvious one.
What they did was look at other data sets to find out they could use for calibration…and they found it in a TOA measured energy imbalance…which was incredibly tiny in terms of total flux, but had the correct sign.
For anyone who doubts this, I used to have a link saved on my computer that was to the article detailing the original finding and how it was subsequently “adjusted” to comport with preconceived expectations…but a recent reset of my computer erased all of my saved links.
However, the reason I am aware of all of these factoids is because it was all discussed in quite a bit of detail in a previous post by Willis on this same topic…discussed in the headline article and even more extensively in the lengthy and information comments thread on the article.
Here below is a link to that article, and I urge anyone interested in this topic to read the article and all the comments. I have read the whole thing several times over the intervening years.
Here it is (I think this is the one, but I’ll double check and locate that specific link to the adjustments made after cooling was initially found):
https://wattsupwiththat.com/2019/01/11/a-small-margin-of-error/
The upshot is…nearly everything published or asserted by the warmistas climate mafia is either wrong, incredibly dubious, or a deliberate lie, and that is my opinion but I think it is a virtual fact.
Here below is a link to the article describing how the original finding of cooling was “corrected” (translation: fudged) by the person responsible for doing it…the warmista True Believer named Josh Willis.
It is not an overstatement to describe this person as an extreme climate alarmist.
Article titled “Correcting Ocean Cooling”, by Josh Willis
https://earthobservatory.nasa.gov/Features/OceanCooling/
And here is another link to the comment thread and the specific comment where I personally originally came upon this inconvenient tidbit of information:
https://wattsupwiththat.com/2019/01/11/a-small-margin-of-error/#comment-2585471
“CECTERAM CENSEO CARTHAGENUM ESSE DELENDAM” Cato, the elder.
(It is also my opinion that Carthage must be destroyed.)
Thank you for the quote, and causing me to look up the reference.
Interestingly (or not), I have recently watched several entire series’ of TV shows about this period of the Roman Empire, around the time of Julius Caesar crossing the Rubicon and all of that.
Binge watch mode it was.
But I missed this quote, although I am pretty sure this individual was one of the characters portrayed.
Now I have to check on that.
Now if I can only deduce what exactly you mean to say…
Hmmm… *walks away scratching head*
PS…just checked…in my favorite series, the one called “Rome”, Cato the Elder was already dead, but Cato the Younger had a prominent role…he was referred to as Porcius Cato in the series.
The series is free for anyone with Amazon Prime…it was a great watch.
https://www.imdb.com/title/tt0384766/?ref_=ttfc_fc_tt
In the presence of a vertical temperature gradient, the ability to accurately measure temperature at a particular depth requires *both* a very accurate thermometer *and* a very accurate depth gauge.
The Argo floats accuracy is described as: “The temperatures in the Argo profiles are accurate to ± 0.002°C and pressures are accurate to ± 2.4dbar. ” 2.4dbar is about 2.5 meters. So in areas where the temperature gradient is more than 0.002°C/2.5m, or 0.8°C/1000m, the errors in depth swamp the errors in temperature. The tropical ocean has a difference between surface water and 1000m water of about 20°C or more, which makes the temperature error due to depth error 25 times greater than the temperature error itself, or +/- 0.05°C.
Refs:
1) http://www.argo.ucsd.edu/Data_FAQ.html#accurate
2) http://upload.wikimedia.org/wikipedia/commons/e/e7/Temperaturunterschiede_Ozeane.png
(Rescued from spam bin) SUNMOD
Since the temperature changes with depth and the ARGO probe is travelling upwards through the water while taking measurements, does the ARGO probe travel slowly enough to allow the temperature probe to stabilize before measurements are taken?
On the ARGO website, they mention that the results obtained (raw data) are “processed” in various ways and for several reasons…one of which is when the buoys are travelling through regions of rapidly changing temperatures.
Of course this makes the results obtained a modelled result, not a measured result.
But hey, we know they get everything exactly right when they “correct” data, no?
Their guesses at how to properly correct the measured numbers are so exact and perfect it has no effect on the uncertainties they report!
So much so that their calculated ocean heat content numbers for the entire planet are very close to the theoretical laboratory calibrated measurement resolution of the sensors on the probes.
They so smart!
Let’s not make it sound worse than it is. A thermometer that moves up from a cold layer to a warmer one will take time to equilibrate, but the surrounding temperature can be derived from the current reading *plus* the *rate* at which the current reading is changing in a well-defined way, since the thermal mass of the device is known. Of course, none of this is within +/- 0.002ºC when depth measurement error is taken into account. The bigger the temperature gradient, the bigger the error.
Due to the thermosteric expansion of sea water, it is easier to detect a rise in sea level than it is to detect a 0.003C/year rise in temperature. If the rise of the oceans since 1900 at a fairly steady 2mm/year were 100% thermal expansion, with no melting glaciers, etc., then given the average ocean depth of about 4000m, 0.002m/4000m = 0.5ppm/year. That translates to a temperature change of 0.5ppm/(150-300ppm/°C) = 0.0033 to 0.0067°C/year. If you multiply that by the ocean volume of 1.37×10^9 cubic km at 1cal/degree/cc, and divide by the surface area of the Earth, you get (1.37×10^24 cc)(1cal/degree/cc)(4.184watts/(cal/sec))(0.0033 degrees/year)/(31,536,000 seconds/year)(5.1×10^14m2) = 1.18 – 2.36 W/m2.
The total net anthropogenic radiative forcing is estimated by the IPCC to amount to 1.6W/m2. So, if all that heat going into the ocean, it accounts for just about all of the sea level rise, with no room for ice to melt.
It is even easier to precisely and accurately measure the rotational rate and the changes in that rotation, of the whole planet, and thus reveal if there is indeed even possibly such changes occurring.
Careful studies of this parameter reveal that it is impossible that was is being asserted by the alarmists is taking place in reality.
I will look for that link, but maybe someone else has the info handy.
And then there are also influences from salinity and the dynamic influences on ocean heights from surface gyres.
Willis, thanks for calingl BS on this paper. Your comments and observations re. the inherent impossibility of measuring what they think they’re measuring are spot on.
Argo floats are nifty, but methinks their utility has been over sold. Not sure what the purpose is other than to provide endless amounts of data to be molested by serial data molesters.
Nick Stokes, my friendly email guy with connections to Australia’s CSIRO, has made many useful and perceptive comments about accuracy here on WUWT.
I used to own a laboratory, one of the first with NATA certification in NATAs formative years. We had expensive thermometers traceable to international reference gear and we had constant temperature water baths. There was and still is, great difficulty in achieving stability better than 0.1 degrees C.
I took several visits to the National Measurement Laboratories to see how it was done with other peoples’ money. They had a constant temperature room that could be adjusted for each person entering the room, maximum 4 folk. They got to 0.01 degrees C.
My neighbour worked elsewhere on accurate measurement and standardisation procedures and we chatted about relevant problems.
Nick, I do not know your personal experience in any detail. However, this matter of true accuracy of Argo floats cries out for a comment from top research bodies. Maybe you have already donned your Lone Ranger mask and are on the trail to a Nick Stokes WUWT comment.
Looking forward to reading it. Cheers, Geoff.
Willis,
Your concerns about this data and its presentation are spot on. However, here is something worth quibbling about.
This is only strictly true if the measurements are independent and identically distributed, or IID. Unless this is so one cannot factor out a constant variance in the propagation of error, which leads to a factor (1/n). It would take a lot of effort to convince me this is true of the Argo data set. This is only one instance of the many ways I hate how climate science uses statistics.
True, Kevin. I didn’t want to open that whole can of worms, in particular since it can only make things MORE uncertain. I settled for looking at the minimum error, since that can’t be argued with.
w.
“In general, if we increase the number of measurements we reduce the uncertainty of their average.”
In all the statistics classes I ever took – as an engineer – it was ALWAYS argued that the reduction in uncertainty is ONLY achieved if the measurements are made using the same equipment, in the same environment (the same piece of water), at virtually the same time. Clearly a practical impossibility with temperature of seawater measurements at ANY depth. Thus, adding and averaging a multitude of readings taken at different places at different times does NOTHING to improve the uncertainty.
I the sailing days, the midshipman dipped a bucket in the ocean and measured it with a thermometer that could perhaps be read to fractions of a degree but how close that was to the ‘real’ temperature was probably not much better than 2 deg.
It took me about 300 million nanoseconds to read this article. Does that make me an extremely slow reader? — according to fourteen unnamed authors, YES.
Yes, but the large number of separate readings taken by each of your Mark 1 eyeballs means that you read the article with an extreme degree of precision and accuracy!
Yay for you!
w. ==> I quite agree that the amazing thing about Earth’s climate is its long term stability. The stability of the Climate System [the whole shooting match taken all together] is, in my opinion which is shared by a few others, due to the stability inherent in chaotic non-linear dynamical systems [ see Chaos Theory]. See my much earlier essay “Chaos & Climate – Part 2: Chaos = Stability” .
Of course, the Earth climate also exhibits a two-pole “strange attractor-like” character, shifting between Ice Ages and Interglacials.
The claim to any knowledge about the “average temperature” or “heat content” of the Earth’s oceans [taken as a whole] is silly buggers scientific hubris writ large. The zigs and zags in the early parts of the paper’s heat content graph are “proof” that the metric is non-scientific and does not trepresent any kind of physical, real-world, reality.
Short and sweet and well said, Kip!
I wonder if the 0.03 degree uncertainty is more related to the 0.02 degree resolution of the argo instrumentation.
Since argo sensors began to be deployed in 2000, what was the source of data from pre-2000 measurements and what assurance is there that those measurements are accurate?
John, pre-Argo we had scientific expeditions using Nansen bottles. Note that they say that pre-1960, less than 10% of their monthly gridcells had any data at all …
w.
Have there been any changes to the design of the ARGO probes over time?
Yes, Mark, they have been modified and improved over the years…and also made and programmed to go deeper.
Initially they only went to 1000 meters, for one thing.
In the just below this one are links to the ARGO website and there is a lot of info there and at various other sources that can be found with a web search.
I am sure one of the improvements was giving them better batteries.
When deployment first began around 2001-2002 or so, and floats were gradually added after that…lithium ion batteries were not nearly as good as the best ones available today, IIRC.
BTW the way everybody…just in case anyone is unaware of it…the ARGO buoy project was not even conceived of until the late 1990’s (1999 to be exact), and the first float deployed several years after that.
The number of buoys deployed only reached what was deemed to be an operationally meaningful(3000 floats were deployed as of 2007) number of units around 2009…IIRC, and for many of the years they have operated, they only went down to 1000 meters, not the 2000 meters they were only recently reprogrammed to dive to.
In 2012, the one millionth measurement was taken…so if one assumes 4000 floats, that would be 250 measurements as of 2012 per float…each of which measures some 90,000 square kilometers of ocean, and only does so every days tens (36 measurements per year) at best.
One might wonder where all the rest of the data came from?
What about before the first float was launched in the early part of the 2000’s?
How about between then and when there was enough to be considered even marginally operational in 2007?
What is going on with mixing up numbers from when we used to only measure the surface with buckets and ship intakes at random places and intervals, with measurements taken prior to 2009 when the ARGO buoys only went to 1000 meters, and then since then when they were gradually reprogrammed to go down to 2000 meters?
The truth is, all of this information (and it is a lot of information, do not get me wrong) is being reported as if everything is known to chiseled-in-stone certainty, exactly as reported in the papers and relayed in graphs and such.
It aint!
To be scientific, information must be reported as measured, and all uncertainties and shortcomings revealed and accounted for…at a bare minimum. Even then, conclusions and measured results can still easily be wrong.
But without meeting those bare minimum standards, the results can in no way be considered scientific.
It barely qualifies as informed speculation.
Some more random bits of info and the sources of what I am opining on here:
– As of today, January 14th of 2020, the official ARGO site says they deploy 800 new units per year, and there are 3,858 in service at present. Hmm…that sounds like even the huge amount of coverage per unit reported is overstated.
– The official ARGO site reports that the accuracy (the word they use…wrongly) of the temperatures reported is + or – 0.002° C, as quoted here from the FAQ page:
“How accurate is the Argo data?
The temperatures in the Argo profiles are accurate to ± 0.002°C and pressures are accurate to ± 2.4dbar. For salinity,there are two answers. The data delivered in real time are sometimes affected by sensor drift. For many floats this drift is small, and the uncorrected salinities are accurate to ± .01 psu. At a later stage, salinities are corrected by expert examination, comparing older floats with newly deployed instruments and with ship-based data. Corrections are made both for identified sensor drift and for a thermal lag error, which can result when the float ascends through a region of strong temperature gradients”
– Each float lasts for about 5-6 years, as they report, and other info on their site puts the actual number of units gathering data as 3000 at any given time, gathering about 100,000 measurements every year. 4000 units with one reading every ten days would give far more…144,000 readings…so…yeah. (Also from the FAQ page)
– There are large gaps in the spacing of the units, and entire regions with none, and none of them are near coastlines, and none in the part of the ocean with ice part of the year. Ditto for the entire region between southeast Asia, Sumatra, and the Philippines…clear north to Japan.
I could go on all day with criticisms, all from their own source page…but I gotta sometimes.
ARGO site and page with current map:
http://www.argo.ucsd.edu/About_Argo.html
FAQ page:
http://www.argo.ucsd.edu/FAQ.html
Lots more info and a bunch of references here:
https://en.wikipedia.org/wiki/Argo_(oceanography)
Willis
I have been following your thermostat theory, and offer the following for your consideration.
IMO your theory is stage two of the thermostat. The first consideration should be – what percentage of the gross energy presented at the ocean / atmospheric interface is actually transported away. Therefor the first stage is the release capacity into the atmosphere.
Considerations could include
1 – wind speeds have reduced by about 15% over the modern warming period.
2 – Tropical cyclones have decreased over the same period due to such things as a weaker Arctic
Your charts identify a significant increase at 26C surface temperature. But what percentage of the energy presented at the surface at that temperature and higher, is actually transported away, given that extremely high relative saturation exist at the ocean / atmosphere interface.
Why do Tropical Cycles exist –
They exist to transport area’s of very high humidity away from areas of high thermal release as the two natural transports of vertical and horizontal are insufficient to accommodate. They step in where the primary mechanisms of transport lack capacity.
What do Tropical Cyclone do –
They transport energy from the tropics both vertically and horizontally.
This in turn allows retention of ocean heat for mixing then raising the average however small. The release of which occurs on much longer time scales.
Ocean heat content increase is not the outcome of CO2 etc, it simply can’t escape during certain climate states due to lack of transport capacity.
With regards
Martin
Thanks, Martin, interesting ideas. I’ll need to ponder on that.
w.
Climate science is the only field in which you can take one temperature measurement in one place, then use a second thermometer to take a reading 100 miles away, and then claim that the existence of the second measurement makes both measurements more accurate.
Yes indeed Mark.
Anyone using statistical techniques to improve the reliability of measurements needs to know this.
This method is only considered to be valid if the measurements were each a separate measurement of the same thing!
Measuring different parcels of water with different instruments can never increase the precision and accuracy of the averaged result.
The water temp is different in ever location and depth.
The temperature in the same location and depth is different at different times.
Everything is always changing, and yet they use techniques that are only valid in a particular set of circumstances and conditions as if it was a general property of measuring things!
And that is only one of the many ways what they are doing does not stand up to even mild scrutiny.
Nicholas McGinley January 14, 2020 at 6:35 pm
Mmm … not true.
Consider a swimming pool. You want to know the average temperature of the water. Which will give you a more accurate answer:
• One thermometer in the middle of the pool.
• A dozen thermometers scattered around the pool.
Obviously, the second one is better, despite the fact that no two of them are measuring the same parcel of water.
See my post on “The Limits Of Uncertainty” for further discussion of this important question.
w.
I think two different things are being talked about here.
You can not increase the precision, nor the accuracy of one thermometer’s measurements by using measurements from a different one in the group of twelve. You can not adjust the reading from one thermometer by the reading of another thermometer in a different location.
If you make multiple, independent measurements of the same thing and you are assured that the “errors” are random, i.e. you have a normal distribution of “true value + errors”, then the mean of the readings will provide a “true value”. Please note it may not be accurate, nor will it have better precision than the actual measurements.
Just in case, the Central Limit Theory DOES NOT allow one to increase the precision of measurements.
No matter how many readings taken, you can never improve your uncertainty beyond the limits of your thermometers.
If you managed to measure every single molecule of water in a pool, with thermometers that are accurate to 0.1C, you will know the temperature of the whole pool, with an accuracy of 0.1C. As you reduce the total number of thermometers you ADD uncertainty as you increase the amount of water that isn’t measured.
The accuracy of individual probes is the base for your uncertainty. You can only go up from there, you can never go down.
If you had 100 probes measuring the same molecule of water at the same time, then you could use your equation to calculate the reduction in uncertainty.
However, if you take 100 probes to measure 100 molecules of water, then your equation does not apply.
There are two types of uncertainty.
There is uncertainty in the accuracy of the reading of an individual thermometer.
There is uncertainty in whether the readings taken, regardless of how many, accurately reflect the actual temperature of the entire pool.
Adding more thermometers can reduce the second uncertainty, it can never reduce the first uncertainty.
Mark,
Adding more thermometers will only improve a result under certain conditions.
For one thing, they must all be accurate and precise, that is, have sufficient resolution and be properly calibrated…and then they have to be read by a competent observer.
IOW…if all of the thermometers are mis-calibrated, it will not matter who reads them or how many one has…the true temp of the pool will not be measured.
I made an unstated assumption that all the thermometers were identical and read identically.
Willis, In your swimming pool example, which I recall from the last time we discussed this several years ago…are you assuming the pool has a uniform temperature from top to bottom and that this is known to be true?
There are several separate things being asserted and discussed here, and conflating them all into one thing, in my opinion, is muddling the various issues.
How about if we make the swimming pool more like the ocean by making it a really big one, Olympic sized…50 meters long. And at one end someone is dumping truckloads of ice into it, and at the other end giant heaters are heating it, and at various places in between, cold air and hot air are being blown over the surface.
So no one knows what the actual average of the pool is.
And the heaters are being turned off and cranked to high over a period of years, randomly, and the trucks full of ice are of unknown size and temperature and frequency…but ongoing at various times, also over many years.
Ten thermometers will give one more information about what the average temp might be at a given instant, if they are all taken at once.
But suppose they are floating around randomly, and each one, on a different schedule, gives a reading every ten days of the top part of the pool only. Also instead of a regular pool it is a pool with steps and ledges of random shapes and sizes and depths…but none of the thermometers is in these shallower parts, and none of them can go where the ice is being dumped…ever.
So…will having ten instead of one give more information?
Of course.
Will ten readings on ten separate days let one determine the accuracy and precision of the measurement at other places and other days with a different instrument?
Can these readings by many instruments at many places but specifically not at certain types of other places, over many years, be used to determine more accurately the total heat content of the pool at any given time, let alone all the time…and how it is changing over time?
I am not disagreeing with you, I am saying that you have not delineated the question about the pool clearly enough for an answer that is, IMO, meaningful.
A swimming pool in a backyard is known to be roughly the same temp from one end to the other and top to bottom.
And one might assume that the ten thermometers would logically be read at the same instant in time…or at least close to that. But one on a cloudy day after a cold night, one on a day prior to that when it is sunny and had not been cold for months on end, and yet another at the surface while it is pouring rain?
No one knows the “true value” of the heat content of the ocean at an instant in time, so how exactly does one know how much uncertainty resides in a reported value such as a change in ocean heat content over time?
I have been reading and discussing this morass here for years, and I know you have been writing about it a lot longer than that.
I spent a bunch of years in college science classes and in labs learning the proper methodology for measuring things, calculating things, and reporting things based on what is and what is not known.
Then a lifetime of real world experience after that, much of which time I have spent ding my best to understand what we know and how that is different from what me might only think we know.
There are entire textbooks on the subjects of accuracy vs precision, but one can read several Wikipedia articles to get a good overview of the concepts.
Reading about it and keeping it all straight however…that is the tricky part.
I am gonna do something which may be annoying but I think is warranted…quote a page from an authoritative source on the interrelated topics of error, uncertainty, precision, and accuracy:
“All measurements of physical quantities are subject to uncertainties in the measurements. Variability in the results of repeated measurements arises because variables that can affect the measurement result are impossible to hold constant. Even if the “circumstances,” could be precisely controlled, the result would still have an error associated with it. This is because the scale was manufactured with a certain level of quality, it is often difficult to read the scale perfectly, fractional estimations between scale marking may be made and etc. Of course, steps can be taken to limit the amount of uncertainty but it is always there.
In order to interpret data correctly and draw valid conclusions the uncertainty must be indicated and dealt with properly. For the result of a measurement to have clear meaning, the value cannot consist of the measured value alone. An indication of how precise and accurate the result is must also be included. Thus, the result of any physical measurement has two essential components: (1) A numerical value (in a specified system of units) giving the best estimate possible of the quantity measured, and (2) the degree of uncertainty associated with this estimated value. Uncertainty is a parameter characterizing the range of values within which the value of the measurand can be said to lie within a specified level of confidence. For example, a measurement of the width of a table might yield a result such as 95.3 +/- 0.1 cm. This result is basically communicating that the person making the measurement believe the value to be closest to 95.3cm but it could have been 95.2 or 95.4cm. The uncertainty is a quantitative indication of the quality of the result. It gives an answer to the question, “how well does the result represent the value of the quantity being measured?”
The full formal process of determining the uncertainty of a measurement is an extensive process involving identifying all of the major process and environmental variables and evaluating their effect on the measurement. This process is beyond the scope of this material but is detailed in the ISO Guide to the Expression of Uncertainty in Measurement (GUM) and the corresponding American National Standard ANSI/NCSL Z540-2. However, there are measures for estimating uncertainty, such as standard deviation, that are based entirely on the analysis of experimental data when all of the major sources of variability were sampled in the collection of the data set.
The first step in communicating the results of a measurement or group of measurements is to understand the terminology related to measurement quality. It can be confusing, which is partly due to some of the terminology having subtle differences and partly due to the terminology being used wrongly and inconsistently. For example, the term “accuracy” is often used when “trueness” should be used. Using the proper terminology is key to ensuring that results are properly communicated.”
I think we all have trouble making sure our commentary is semantically perfect while discussing these things…because in everyday usage many of the words and phrases are interchangeable.
So…how well do the people writing up the ARGO data do at measuring the true value of the heat content of the ocean?
No one knows, of course.
But we would never be aware of that from reading only what they have to say about what they do and have done.
How many significant figures are appropriate, knowing that it is only correct to report a result in terms of the least accurate data used in the calculation…when large areas of the ocean are not even being sampled?
And the different floats are descending to different depths (I came across this eye-opening tidbit of info on the ARGO site just today)?
So, more quoted text:
“True Value
Since the true value cannot be absolutely determined, in practice an accepted reference value is used. The accepted reference value is usually established by repeatedly measuring some NIST or ISO traceable reference standard. This value is not the reference value that is found published in a reference book. Such reference values are not “right” answers; they are measurements that have errors associated with them as well and may not be totally representative of the specific sample being measured.”
“Accuracy and Error
Accuracy is the closeness of agreement between a measured value and the true value. Error is the difference between a measurement and the true value of the measurand (the quantity being measured). Error does not include mistakes. Values that result from reading the wrong value or making some other mistake should be explained and excluded from the data set. Error is what causes values to differ when a measurement is repeated and none of the results can be preferred over the others. Although it is not possible to completely eliminate error in a measurement, it can be controlled and characterized. Often, more effort goes into determining the error or uncertainty in a measurement than into performing the measurement itself.
The total error is usually a combination of systematic error and random error. Many times results are quoted with two errors. The first error quoted is usually the random error, and the second is the systematic error. If only one error is quoted it is the combined error.
Systematic error tends to shift all measurements in a systematic way so that in the course of a number of measurements the mean value is constantly displaced or varies in a predictable way. The causes may be known or unknown but should always be corrected for when present. For instance, no instrument can ever be calibrated perfectly so when a group of measurements systematically differ from the value of a standard reference specimen, an adjustment in the values should be made. Systematic error can be corrected for only when the “true value” (such as the value assigned to a calibration or reference specimen) is known.
Random error is a component of the total error which, in the course of a number of measurements, varies in an unpredictable way. It is not possible to correct for random error. Random errors can occur for a variety of reasons such as:
Lack of equipment sensitivity. An instrument may not be able to respond to or indicate a change in some quantity that is too small or the observer may not be able to discern the change.
Noise in the measurement. Noise is extraneous disturbances that are unpredictable or random and cannot be completely accounted for.
Imprecise definition. It is difficult to exactly define the dimensions of a object. For example, it is difficult to determine the ends of a crack with measuring its length. Two people may likely pick two different starting and ending points.”
“Precision, Repeatability and Reproducibility
Precision is the closeness of agreement between independent measurements of a quantity under the same conditions. It is a measure of how well a measurement can be made without reference to a theoretical or true value. The number of divisions on the scale of the measuring device generally affects the consistency of repeated measurements and, therefore, the precision. Since precision is not based on a true value there is no bias or systematic error in the value, but instead it depends only on the distribution of random errors. The precision of a measurement is usually indicated by the uncertainty or fractional relative uncertainty of a value.
Repeatability is simply the precision determined under conditions where the same methods and equipment are used by the same operator to make measurements on identical specimens. Reproducibility is simply the precision determined under conditions where the same methods but different equipment are used by different operator to make measurements on identical specimens.”
Right!
Now, which of us can keep all of this in mind…and it is only part of a single technical brief on the subject…while we read and comment on such things?
Who thinks anyone in the world of government funded climate science spends any time concerning themselves with repeatability and reproducibility, let alone the distinction between the two concepts?
Here is a link to the brief I quoted:
https://www.nde-ed.org/GeneralResources/ErrorAnalysis/UncertaintyTerms.htm
Now then, if you are still reading, I just realized I did not specifically answer your question about the pool.
I asked some questions back.
If the pool is not well mixed and the readings simultaneous, the ten thermometers are not reading the same thing, but a different thing…water in another part of the pool.
From the Wikipedia article Precision and Accuracy:
“The precision of a measurement system, related to reproducibility and repeatability, is the degree to which repeated measurements under unchanged conditions show the same results.”
It is impossible to measure using ten different instruments in ten places to say anything about the precision of the average of them, or how that compares to one reading.
Note that “repeatability” and “reproducibility” are distinct and separate concepts and both relate to precision and accuracy.
I am gonna skip the links to each of these articles or this comment will go into moderation. I’ll include them in a separate comment after.
Nicholas –> One point. A lot of folks make the mistake that with random error and a sufficient number of measurements, one can make the assumption that the “true value + random error” develops into a normal distribution. This lets you take the average and use the assumption that the random errors cancel out.
This doesn’t mean three different measurements. This means a lot of measurements. It doesn’t mean measurements of different things at different times combined into a population of data (like temperatures). It means the same thing. with the same device.
This means you must be sure that the random errors are random and form a normal distribution so they cancel out.
Overall, one must be cognizant of uncertainty when combining non-repeatable measurements, i.e., temperature measurements versus measurements of the same thing with the same device. Temperature measurements at different times, different locations, and with different devices combine uncertainty a whole lot differently than multiple measurements of the same thing with the same device.
Hi Willis,
I first want to thank you for your reply, which I neglected to do in my first go at responding.
Then I wanted to answer again after rereading your comment, because I think I replied the first time with what was on my mind at the time I read your comment.
So, you asked:
“Consider a swimming pool. You want to know the average temperature of the water. Which will give you a more accurate answer:
• One thermometer in the middle of the pool.
• A dozen thermometers scattered around the pool.”
I agree that the second choice is “better”, all else being equal.
But how about this choice:
Which is better, measuring a swimming pool in ten places by one person at the same time by walking around the pool and using the same thermometer, or having ten people read ten different thermometers at ten random times over a one week interval?
(I have another question for anyone who would like to consider it: How long would it take to read the Wikipedia article on accuracy and precision, and then read all of the reference material, and then read each of articles for the hyperlinked words within the article, and read it all enough times that you have it all clear in your mind?)
Thanks again for the response, Willis.
P.S.
Have you reread the comment section of the article you linked to?
I used to post under the name Menicholas back then, when I was working for a private company and had to worry about getting fired for being a d-word guy.
Hi again Willis,
I am glad you linked to that article, “The Limits Of Uncertainty”, for several reasons, and one of them is because I never got a chance to clear up something regarding a question I asked you, and you answered, here in this comment:
https://wattsupwiththat.com/2018/12/20/the-limits-of-uncertainty/#comment-2563304
You missed that I was quoting that guy Brian!
I never said that, he did.
It was in his first paragraph.
He said all sorts of stuff that made no sense, and several things that were flat out wrong, and I just wanted to make sure I was not the one who was not thinking correctly that night.
You thought I believed that, and I never got a chance to clear it up…and I hate it when that happens, so…
That was a particularly fun discussion, for me anyway.
Thanks for clarifying that, Nicholas, appreciated. And I agree with you that getting tight uncertainty bounds on even a swimming pool is tough, much less the real ocean.
Regards,
w.
You are partially wrong there Willy. More measurements will very likely increase accuracy in your example, but it will not increase as the root of the number of measurements. This only applies to the decrease of random measurement errors of independent measurements of the same quantity.
In all other cases the increase will be less, often much less.
If the ocean is heating up, then one should see an increase in water/water vapor circulation. One would likely measure this as rainfall – I am not sure how cloud cover would correlate. So unless average rainfall has increased to match this additional heat, I would remain highly skeptical of their study.
The problem is, of course, how does one come up with a worldwide average rainfall accurate to within 0.003%? One doesn’t, so their study is safely tucked away from being disproved (at least through this route).
I think I looked up the accuracy of the Argo temperature data once before… and there is no way it can provide an accuracy of 0.003%. If I remember right, they use salinity as a proxy for temperature? Or maybe to correct the temperature measurement…can’t remember.
In any case, the Argo floats do not work under ice nor where the ocean is shallow – they require 2000m depth. This means even if you have a lot of floats, you will not measure a significant amount of the ocean area. The floats are “free ranging” and so one cannot expect them to keep a regular dispersal – there will be clumps and voids over time
Yup!
here is the map, supposedly updated in real time.
There are huge voids and dense clumps.
Large areas regions have zero floats.
Look at the area north of Australia, all the way up to Japan.
Nothing!
Look at the area West of Japan.
Jammed with floats.
There are numerous dense clumps and many areas, some nearby to these clumps, that have none.
And it can be seen that the Arctic has few…although it deos appear there are some under the ice north of the Bering Straits. I am thinking it may be hard to get a reading from those ones!
Arabian Sea…jammed up with them.
http://www.argo.ucsd.edu/About_Argo.html
Actually there are probably more floats in the arctic, but only those that happen to surface in a polynya manage to transmit data.
The “jam” west of Japan is due to a separate Japanese research program, parallell to ARGO proper.
Unfortunately this does not extent to the Sea of Okhotsk, north of Japan, which is completely unsampled.
And unfortunately this uneven sampling is not random. There are huge areas that have never been sampled:
Yep. 1.5mm pa increase in rainfall over the last 60 years, as the planet increases its cooling cycle.
Thanks Willis from a climate layman.
“….warmed a little over a tenth of one measly degree.”
But a long writeup to say “meh”. (smile)
I am not a scientist but an expert in brute force logistics with a scientific mind. I understand data and statistics and appreciate the power of good analysis. BUT….I’ve had to listen to a host of “experts” expounding on suggested improvements that will not make a hill of beans. Their suggestions, assertions and supporting arguments typically fail when I ask penetrating questions about terms of references, assumptions, data, analytical methods…. and what the hell is the marginal improvement, the necessary investment, and the payoff. I suspect it is the same in all endeavors, including as I have seen, in my admittedly imperfect understanding of climate.
Hi Willis,
Great work, and very illuminating to this retired IT guy.
I understand that seawater contains lots of dissolved CO2, and releases it to the atmosphere as the water temperature rises (and vice-versa).
Can you calculate (or even estimate) how much CO2 may have been released by the oceans if the claimed temperature rise had in fact happened, and of course how that compares with claimed’man-made’ CO2 emissions over the same period?
Cheers from smoky Oz.
But if oceans emit CO2 when they get warmer how can they in the same moment absorb all that man made CO2 ?
https://www.businessinsider.es/oceans-absorb-carbon-emissions-climate-change-2018-10?r=US&IR=T
And how can we have Ocean Acidification in a warmer CO2 outgassing ocean?
https://www.ucsusa.org/resources/co2-and-ocean-acidification
BoyfromTottenham January 14, 2020 at 4:25 pm
I understand that seawater contains lots of dissolved CO2, and releases it to the atmosphere as the water temperature rises (and vice-versa).
Only if there is no other source of CO2 in the atmosphere (Henry’s Law)
Can you calculate (or even estimate) how much CO2 may have been released by the oceans if the claimed temperature rise had in fact happened, and of course how that compares with claimed ’man-made’ CO2 emissions over the same period?
As I recall an increase in SST of 1ºC leads to an increase in pCO2 of 16ppm, since 1960 the pCO2 has increased by ~100ppm.
Sounds like a scientific audit of NOAAs climate data is needed
I searched the PDF of the study for the words “solar” and “sun” but found none, they did not even bother to say “Pay no attention to that bright object in the sky”.
Off topic but of great interest. James Delingpole at Breitbart.
Delingpole: Greta Thunberg’s Dad Writes Her Facebook Posts
“Greta Thunberg doesn’t write her own Facebook posts. They are largely written for her by grown-up environmental activists including her father Svante Thunberg and an Indian delegate to the U.N. Climate Secretariat called Adarsh Pratap.
The truth emerged as a result of a Facebook glitch revealed by Wired. A bug made it briefly possible to see who was really running the accounts of celebrity puppets like Greta.”
https://www.breitbart.com/politics/2020/01/14/greta-thunbergs-dad-writes-her-facebook-posts/
Who’da thunk it?
This is like week old news now. You’re at least the fourth person to post it OT to various threads. I don’t really find it a big deal.
No, anybody with a functional forebrain must have realized this long ago.
“Perhaps there are some process engineers out there who’ve been tasked with keeping a large water bath at some given temperature, and how many thermometers it would take to measure the average bath temperature to ±0.03°C.” Been there, done that with relatively small baths of 30 liters. This is quite challenging and expensive. The platinum resistance thermometers and associated electronics (fancy ohm-meters) adequate to do this job are about $3500 per set. Then you’ll need one standard platinum resistance thermometer (SPRT) to check all the others. It’s $4000 to get a good one and another $4000 to get a top metrology lab to calibrate it using fixed point standards. Then a $5000+ ohmmeter to read it. The idea that they have this kind of precision and accuracy is laughable.
Willis – to test their precision, you could use the densest grid of Argos floats, calculate the heat content and temperature of the ocean in that grid, drop 99% of them, and recalculate the temperature. It should not vary by more than ±0.03 K from the denser grid.
Fantastic article,
I see it mentions _<ohc anomaly on the y axis,
why does everyone use 'anomaly'
I refer to the super 'Philosophical Investigations' videos
https://youtu.be/S50_juP5S5U
using just the real data points would make the increase even les dramatic!
Willis,
For the sanity of the world, thank you for another common sense zinger.
I’ve often wondered how the argo bouys will end up being distributed over time
GIven your life experiences I’m sure you have also sat on the banks of a stream or river and watched the flotsam collects in eddies and stagnant points.
Now imagine the same situation for the Argo bouys and what It might mean for their data , and yes, that is a challenge to your inquisitive nature.
And the end result is very far from evenly distributed, or even random:
“PS: As is my habit, I politely ask that when you comment you quote the exact words you are discussing. Misunderstanding is easy on the intarwebs, but by being specific we can avoid much of it.”
“Next, I’m sorry, but the idea that we can measure the temperature of the top two kilometers of the ocean with an uncertainty of ±0.003°C (three-thousandths of one degree) is simply not believable.
https://yourlogicalfallacyis.com/personal-incredulity
Disbelief can arise as a result of knowledge, Steve. As in the case of disbelieving that the uncertainty global average ocean temperature is ±0.003 C.
Steve, first, if you go to your doctor and tell him you think you have copronemia, and he says “Based on my experience, I find it unbelievable that you have copronemia”, do you bust him for personal incredulity? Probably not. Experience is sometimes the finest guide that we have to the truth of some claim.
Next, if I tell you “I can high jump 4.6 metres”, you’ll tell me you don’t believe me for one minute. Why? Personal incredulity. Is that a fallacy? Hell, no. It’s good judgment based on your experience.
Me, I have what I call a “bad number detector”. When it starts ringing, I pay attention. I often have no idea why it’s ringing, but I trust it.
Why do I trust it? Because with very few exceptions, it has turned out to be right in the long run. How do you think I can so quickly identify flaws in published work? I know where to look because I trust my bad number detector.
However, I don’t depend just on that. As you point out, that would be foolish. So next, I went on to show exactly why it is not believable. I used a form of “reductio ad absurdum”, I’m sure you’re familiar with that.
Note that this is a valid form of argument, and at the end of the day, it relies on personal incredulity that something that is totally absurd could be true.
Go figure.
I demonstrated that if their claim is true that you can get an uncertainty of 0.003°C from 4,000 Argo floats, then an uncertainty of 0.03°C could be gotten from forty Argo floats. I assume you know enough statistics to know that that is a true conclusion from their 0.003°C claim.
And if you believe that absurd conclusion, then you desperately need to get your bad number detector checked and re-calibrated.
Finally, Pat Frank pointed out that Argo measurements don’t agree with in-situ measurements …
Error of plus or minus six tenths of a degree … doesn’t bode well for 0.003°C …
All the best,
w.
I think Mosher just likes having his behind handed to him, in shreds, by Willis.
You know Willis, the Argo project was designed and dimensioned by very smart guys, professional experienced oceanographers with thorough training and experience in math, physics , and oceanography.
I works fine, as it was planned to do. There were pressure sensor problems the first few years, but since 2007 (when the Argo array reached target deployment) everything is OK
These guys are also much smarter with data than you. ( They don’t whine and claim “we can’t do this and we can’t do that”) They remove all “known” variance that stems from season, location and depth, which greatly reduces the uncertainty about large scale temperature or heat content changes.
You know, Olof, when you can point out some actual scientific error I made instead of writing a meaningless scientific hagiography of the Argo designers and bitching about how dumb I am by comparison with them, come on back and we’ll talk about it.
In the meantime, you might do well to ponder the comment by one of our most brilliant scientific minds, Richard Feynman, who said:
Wake up and smell the coffee. Recent studies have shown that depending on the field, up to half of peer-reviewed papers in the scientific journals can’t even be replicated … and the amount of crap scientific claims in climate is stunning.
Finally, the folks writing this paper are NOT the designers of the Argo system you refer to, they’re nowhere to be seen. These authors include the noted fabulist Michael Man, inventor of the bogus Hockey Stick and data-hiding Climategate unindicted co-conspirator … smarter than me? He’s not as smart as a bag of ball bearings.
Best regards,
w.
Well, You say that the 0.003 C uncertainty for an annual global average is somehow ridiculous, which should mean that the difference between 2019 and 2018 (~0.004 C, or 25 zettajoules) isn’t statistically significant.
Try to prove the alleged statistical insignificance with a simple nonparametric approach: Compare 2019 vs 2018 month by month, data here:
http://159.226.119.60/cheng/images_files/OHC2000m_monthly_timeseries.txt
What is the outcome of the 12 comparisons? Oops, 12 out of 12 indicate that 2019 is warmer. That is very significant according to Chi-square, binomial tests, etc
Thanks, Olof. There are two issues with that.
The first is that the Cheng data is the most autocorrelated dataset I’ve ever seen. It has a Hurst Exponent of 0.97. This means that you can’t use normal statistical tests on the series. They assume an IID distribution of the data, and this is far, far from IID.
The second issue is that your nonparametric test result would be the same if the uncertainty were twice the claimed amount or half the claimed amount, or if the overall trend were twice or half that of the data.
So you can’t use your test to say anything more than that in general the ocean is warming … but then we knew that …
My best regards to you,
w.
First, sorry for the 0.004 C, the difference between 2018 and 2019 is more like 0.010 C (I think my memory switched the conversion figures from 260 to 620)
I also found that IAP has a depth averaged temperature dataset so conversion between OHC and temperature is not necessary
http://159.226.119.60/cheng/images_files/Temperature0_2000m_monthly_timeseries.txt
http://159.226.119.60/cheng/images_files/Temperature0_2000m_annual_timeseries.txt
Anyway, I don’t think oceans warm by autocorrelation, but rather by physics (heating). Actual temperatures, with a pronounced seasonal signal, are of course autocorrelated. Anomalies does not always remove the seasonal signal, because seasons may have drifted from that of the base period. I think this is true for OHC etc, where the seasonal variation in the southern hemisphere has become more prominent in the recent 10-15 years, compared to the base period.
Hence, the statistically most powerful way to compare years, is to do it pairwise, for example rather a pairwise t-test than the normal t-test.
Regarding the IAP dataset, I believe that it is a little bit special, more like a reanalysis. It’s a observational dataset infilled by CMIP5 model patterns. I don’t know how this affect autocorrelation, but IAP diverge from other datasets during the Argo era when oceans are well sampled.
The problem is that they have no training in metrology, laboratory science, statistics, trending/forecasting, and quality control. It’s not a matter of smart, it is a matter of ignorance. I have seen PhD’s divide numbers with one decimal point and simply copy down the calculator answer with 9 decimal places. Ok for counting numbers, but not for physical measurements.
Willis has done a great job using logic. It doesn’t agree with the paper because the paper is based on Mannstistics – a new realm of mathematical discovery that is difficult for traditionally educated people to understand but which is a very powerful in realizing a new understanding of how the universe operates. Mannstictics explains why, contrary to modern science, CO2 will bring Armageddon at 4:45 June 17, 2030. Only socialists and barely functional academics will survive.
Not sure averaging helps your tolerance. I was always taught that the instrument has a default tolerance, that all measurements will have some error based on the instrument. Averaging multiple measurements together will yield a higher accuracy of the measurement but will NOT decrease the tolerance of the measurement. So you make be able to go from 10.2 +/- 0.5 deg C to 10.1855 +/- 0.5 deg C – the accuracy of the average measurement is improved but the tolerance is not.
The precision is improved, but the accuracy (±0.5 C) is not.
You’ve put your finger on the problem of limited instrumental resolution, Shanghai Dan.
That concept is evidently beyond everyone at Berkeley BEST, UKMet, UEA Climatic Research Unit, and NASA GISS. But every freshman undergraduate in Physics, Chemistry, and Engineering is expected to come to grips with it, and does so.
Actually averaging multiple measurements will not result in a higher precision, i.e. more decimal places. This is what significant digits is all about.
Averaging will provide a “true value” (actually best guess or estimate), without random measuring error if the errors are random and enough measurements are taken of the same thing. You can’t say it provides better accuracy because that is systemic and ALL measurements will off by the systemic accuracy error value.
Tolerance is more generally used as an allowed variation in a product. Tolerance can be affected by a number of measuring uncertainties, both systemic and random.
Willis,
Reading Cheng et al 2020 and your excellent critique of it took me back to the Wong-Fielding ‘three questions’ in Australia of June 2009.
This unique exchange of Questions and Answers between Senator Fielding’s four Scientists, Robert Carter, Stewart Franks,William Kinninmonth and David Evans with Chief Minister Penny Wong and Chief Scientist Penny Sackett, Will Steffen and others was the first occasion to my knowledge when air temperature measurements were essentially discarded in favour of OHC measurements in considerations of global warming.
See http://members.iinet.au/~g lrmc/2009%2008-10%20Fielding%2ODDR%20v.2%20on%20Wong-Steffen%20.pdf
See also David Evans’ post on Jo Nova of his personal views of the meeting.
http://joannenova.com.au/2009/06/the-wong-fielding-meeting-on-global-warming
Now look at the comments on the Argo buoys and the lack of warming shown.
Ever since I have been intrigued to learn what is the actual warming in degrees C shown by the Argo buoys since 2003-04 but like you I ran into zetajoules and such at Argo.net
Trying to get the answer at say NASA.Giss has been equally fruitless.
Recently some climate scientists have claimed Argo readings have swung from negative to positive.
Thanks again for your expose.
February 25, 2013 Your old comment.
“to convert the change in zeta-joules to the corresponding change in degrees C. The first number I need is the volume of the top 700 metres of the ocean. WE has a spreadsheet for this. Interpolated, it says 237,029,703 cubic kilometres. multiply that by 62/60 to adjust for the density of salt vs. fresh water, and multiply by 10^9 to convert to tonnes. multiply that by 4.186 mega-joules per tonne per degree C. it takes about a thousand zeta-joules to raise the upper ocean temperature by 1°C. ”
–
That I believe was for the first 700 meters.
–
I guess you have done similar work here and obviously the 2000 meters requires 2 x more energy than 700 meters so 3000 zeta joules would be needed raise the upper 2000 M by about 1°C.
–
I jut thought that having these figures out for the top 700 meters and 2000 meters makes your explanation clearer when we are trying to convert zeta joules to degrees C.
–
The point should be made that the heat is regulated by the whole of the ocean so there may be a few zetajoules lower down that they missed in this study
“… obviously the 2000 meters requires 2 x more energy than 700 meters…”
Is that obvious?
The radius gets smaller with depth. So the same linear depth as from the surface, at depth, includes less water.
The first 700 m of the ocean contains about 3.2E8 cubic km. The first 2000 m contains about 9.2E8 cubic km.
The 1300 m difference contains about 6E8 cubic km, and so requires about twice the energy of the first 700 m.
Thank you Pat.
I did not mean to imply that I dispute the assertion, only questioning how obvious it is, particularly to anyone who has not had a close look at the numbers for the volumes of the various slices of ocean depth.
I have not had a careful look at them myself, but just from a general knowledge of ocean bathymetry it is readily apparent that much of the ocean is not very deep, and the deeper one goes, the smaller the volume of water in each, for example, 1000 meter layer is.
Descending downwards, first one leaves behind all of the areas that are shallow banks, such as around the Bahamas, Southeast Asia, and around Great Britain, to name a few. Then one leaves behind the continental slopes, shrinking what is left of the ocean basins still further.
Islands and small land areas are all wider at the bases than at the surface, as well.
And before one gets to the bottom of the continental shelves, there are various features protruding up from the ocean bottom…seamounts, and large areas of ridges, of which the spreading center ridges are the highest and the widest.
Below about 6000 meters, only the trenches remain.
I am not so sure the radius of the planet is a big factor…it is difficult for me to visualize the scaling of the actual planet compared to the depth of the ocean, but I do know that the radius of Earth at the equator is ~6380 kilometers, while the deepest trenches are about 11 or 12 km deep.
( In the past, I once found myself checking on the assertion I had once heard that, if an exact model of the Earth was scaled to the size of a billiard ball, and one held it in one’s hand, it would feel smoother than an actual brand new polished billiard ball!
One person who has done the calculation found that, to scale, the crust of the Earth is about as thick as a postage stamp on a soccer ball.
I think I concluded that on a two inch billiard ball, the Marianas trench properly scaled would be two one thousandths of an inch deep scratch. A human hair is about two to two and a half times this distance. So I think that would be easily feelable if you have sensitive hands, especially with Mount Everest so close by with a bump as thick as half a sheet of copy paper.
Graphic of this:
http://i.imgur.com/1oLog.png )
Beyond that…I would not want to be nitpicking…but I would be kind of surprised if the actual ratio was in quite so round of numbers as noted by Angtech.
Thank you for the reply Pat…and thank you so much for the link to your article re your 2015 talk in Sicily and those calibration experiment findings!
Head spinning for sure.
For many of us here, I am sure it confirms what we have always suspected, and some of us have had some knowledge of.
I for one had noted all that way back over 20 years ago that a lot of warming seemed to have appeared when the LIG thermometers inside of Stevenson Screens were replaced with the new units such as the MMTS’s. IMO they should have added the new units and kept the old ones in place for a bunch of years before even thinking about using the data the new units collected.
If anyone think Argo can tell us in within a degree 1 C what going on the ocean is fool, you cannot measure the ocean with a bunch of random measure in less than small percentage of the ocean. The majorty of surface measurements of the earth is less that 3% of the earth, the ocean measurements are less. That not science, the reality is a multiple drops of dice might tells us as much.
Since you asked:
The problem with a temperature sensor is that it reports the temperature of the sensor and one tries to infer some truth about the medium into which it’s been immersed. One doesn’t equip large vessels with multiple TE’s (Temperature Elements: thermocouples, RTD’s take yer pick…); rather, it is better to circulate the vessel contents such that the volume flows often enough past the sensor that there is adequate confidence to have “sampled” the temperature of every gallon. It’s tough enough to keep one sensor calibrated to 0.1C, I’d cringe to think about an instrument with 0.01C or better resolution times the number of them you’d need to “sample” even a modest stretch of ocean as you described.
The other reason designs eschew multiple TE’s (beyond a single redundant unit) is common mode failure. If two properly spec’d, installed and maintained units don’t get the job done, more won’t help.
Depending on the vessel size, one can consider either an immersion mixing impeller (selected for flow and not shear) or an external circulation loop equipped with an eductor return to mix the vessel contents. For a modest size liquid mass (example: Baltic Sea), the immersion impeller is probably a bit past, er, practical. So, you’ll want to go with the circ-pump design.
The flow rate of the loop is determined by the time scale on interest. If one is trying to control a reactor with a nicely exothermic reaction, you’ll want the TE to look-over the vessel contents pretty frequently. However, in your application, an hourly temperature assay will likely do nicely. I would recommend a liquid turn-over of 3-5 turns per hour to provide an adequate level of confidence. If that pump is a bit over your capital budget, you could back it way down to 3-5 turns a day and get a daily temperature.
You’ll want the pump with the two-belt drive.
“we could measure it to one decimal less uncertainty, ±0.03°C, with a hundredth of that number, forty floats.”
How may for 0.3 pseudo-degrees C pseudo-precision?
And how many for a 3 pseudo-degrees pseudo-precision?
Willis, You state “But the reduction only goes by the square root of the number of measurements.” This applies only to homogeneous data. Ocean temperatures are not homogeneous.
Phil Jones made this error many years ago in claiming super high accuracies for Hadcrut data.
In the same way, one could claim a very high accuracy of atmospheric temperatures by getting 8 billion people to put a finger in the air …
Oceans act as a buffer to store energy.
Land surfaces not so much.
More land surface area in the northern Hemisphere.
Larger ocean surface in the southern hemisphere (SH).
Perihelion presently early in the month of January in SH summer.
Oceans gaining heat.
What else would one expect?
http://astropixels.com/ephemeris/perap/perap2401.html
The main problem with ARGO is that the measurements are not randomly distributed. For various oceanographic reasons (currents and sea-ice in particular) measurement are very unevenly distributed, and something like 10% of the ocean is never sampled:
The unsampled areas include almost all continental shelves, but also several areas with deep ocean, e. g. most of the Arctic Ocean, much of the Southern Ocean, the sea of Okhotsk, the Bering Sea, the Norwegian Trench and several deep basins in Indonesia.
The lack of sampling in arctic areas and on shelves are very serious, since these areas may well have a different thermal history. Also the lack of measurements below 2,000 meters of course make any claims of measuring ocean-wide temperatures completely meaningless.
The area of the world’s oceans is estimated at 361 million km^2 = 3.61(10^14) m^2. The volume of the top 2 km would then be 3.61(10^14) * 2000 = 7.22(10^17) m^3. Assuming a density of 1000 kg/m^3, the total mass of the ocean down to 2000 m depth would be 7.22(10^20) kg = 7.22(10^23) g. The heat capacity of water at 25 C is about 4.2 J/g-C, so it would take about 3.02(10^24) Joules, or 3,020 zettajoules, to heat up the top 2 km of the ocean by 1 C.
So if the estimated heat content of the oceans (relative to the datum) went from -80 ZJ in 1987 to +220 ZJ in 2019, the ocean would have gained about 300 ZJ in 32 years, which corresponds to an average temperature rise of about 0.10 C, as mentioned by Willis Eschenbach, or about 0.003 C per year.
But how can anyone guarantee that type of accuracy for a buoy that spends 9 days at 1 km depth, goes down to 2 km depth, then rises to the surface, constantly immersed in salt water? At 2 km depth, the pressure of the surrounding water would be about 19.6 MPa or about 2,850 psi, and the measurement device would have to withstand that pressure. Do we know that the temperature measurement devices perform as well under high pressure as they do near the surface? If the temperature is measured as an electrical signal, is any correction made for the resistance of transmitting the signal over up to 2,000 meters of vertical wire? How is power supplied to the measurement device, and is any correction made for the gradual voltage loss from a battery, or the increase in voltage when a partially discharged battery is replaced by a fully charged battery? Could there be some small stray currents caused by corrosion of the terminals of the thermocouple in salt water that affect the measurement signal?
How often are the measurement devices re-calibrated at the surface, in order to correct for signal drift? A signal drift equivalent to 0.1 C over 32 years, or less than 0.00001 C per day, may not be detectable by those who calibrate the instruments, but it could be responsible for the entire 300 zettajoules reported in the article.
Then there is the issue of spacing of the buoys. If there are currently 4,000 Argo buoys in 361 million km^2 of ocean, that’s about one buoy per 90,000 km^2, or an average spacing of 300 km if they were arranged in a grid. We could be completely missing a current of unusually cold or warm water up to 200 km wide, which would never show up in the data.
Has anyone applied the difference of gravity due to orbit changes of the planets vs the sun to these numbers? It seems to me that this might be a cause of the very slight ‘change’ and not anything man can do.
Excellent post, thank you Willis.
I have read the article in question, Cheng et al. 2020, freely downloadable and only 6 pages.
The following is a very revealing email exchange (total 3 emails) that I had today, with one of the authors (name replaced with XXXX, out of kindness):
EMAIL 3:
Thanks for your comment XXXX. Very illuminating
Quotes from Cheng et al. 2020:
“Human-emitted greenhouse gases (GHGs) have resulted in a long-term and unequivocal warming of the planet (IPCC, 2019).”
“There are no reasonable alternatives aside from anthropogenic emissions of heat-trapping gases (IPCC, 2001, 2007, 2013, 2019; USGCRP, 2017).”
IPCC is mandated to prove ‘man-made global warming’. Fatal bias.
IPCC also neglected to ask GEOLOGISTS, oops …
https://www.researchgate.net/publication/331974185_IPCC_Intergovernmental_Panel_On_Climate_Change_next_report_AR6_due_2022_-_784_authors_yes_784_but_again_NO_geologists
It gets worse …
Cheng et al. 2020:
“These data reveal that the world’s oceans (especially at upper 2000 m) in 2019 were the warmest in recorded human history.”
I assume this over-dramatic statement was intended to say “warmest since humans began reliably measuring ocean temperature, a few decades ago”; rather a big difference. The data in Cheng et al. go back to 1955, i.e. 64 years of data. Earth is 70 million (sic) times older (4.5 billion years old). Just maybe the ocean has been warmer in the past.
Love CO2 …
https://www.researchgate.net/publication/332245803_27_bullet_points_prove_global_warming_by_the_sun_not_CO2_by_a_GEOLOGIST_for_a_change
Cheers,
Roger
EMAIL 2:
From: XXXX
Sent: 15 January 2020 14:37
To: Roger Higgs
Subject: Re: [External] Sun not CO2 controls climate & sea level – New ResearchGate contribution
Thank you for my morning humor!
Sent from my iPhone
EMAIL 1:
On Jan 15, 2020, at 8:12 AM, Roger Higgs wrote:
bcc’d to dozens of colleagues …. (including XXXX)
Dear Colleagues,
You might be interested in this new item, uploaded today …
https://www.researchgate.net/publication/338556345_Synthesis_of_archaeological_astrophysical_geological_and_palaeoclimatological_data_covering_the_last_2000_years_shows_the_Sun_not_CO2_controls_global_temperature_and_portends_a_sea-level_rise_of_3_met
As always, your comments and suggestions for improvement would be more than welcome.
Best wishes for 2020. Please keep up the fight to expose the climate-change industry. In particular, society needs to hear thousands more geologists speaking out. As a group we’ve been strangely silent throughout this whole CO2 farce.
Roger
PS Howard, please forward to groups if appropriate.
Dr Roger HIGGS DPhil
Geoclastica Ltd, Independent Geological Consultant, UK
Dr. Higgs, please accept my apologies in advance for any discomfort you may experience here. Please don’t take this personally, as I respect your complementary research to mine. You made many good points regarding sea level.
I am an independent sun-climate researcher, a BSEE, and do all my own work, having spent many years doing sun-climate science and creating the solar/geo current conditions product linked to my name.
Your work came to my attention via a video of Suspicious Observers, Ben Davidson, who claimed you are the man responsible for discovering the solar modern maximum caused the 20th-century warming.
I dispute his claim vigorously along with several aspects of your work. I am the man who in 2014 determined the modern maximum mathematically and spoke of it often here and elsewhere in that year.
At the time I used Group sunspot number, later that year I used daily and monthly v2 SN to add one year at the start and end to make the Modern Maximum 1935-2004.
Another way to prove my claim is with web image search I did a minute ago for the words “solar modern maximum”, where only two images came up, mine. I couldn’t be prouder, my definition and depiction of the Modern Max and my proof of CO2 outgassing at 25.6C, two of my many discoveries.
Yahoo image search for just ‘modern maximum’ has my image at the #11 spot.
Svensmark is wrong, and there isn’t an 85-year lag as you claim. The sun’s magnetic field does control the climate with a much shorter lag but not according to cosmic rays or low clouds.
Today’s update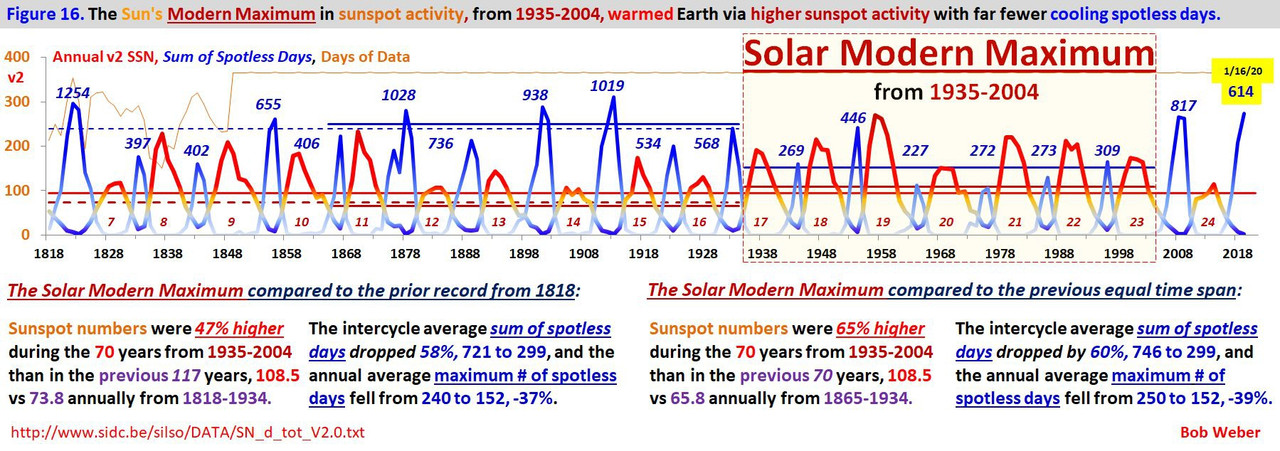
Bob, do you agree with Dr Higgs claimed 3 metres of sea level rise by 2100?
Hell no, but I do agree SL varies with OHC which varies with accumulated absorbed solar energy, but he didn’t say that, I did.
Thanks.
An excellent article well explained, but regrettably unlikely to be read or accepted by the madding crowd.
The reference frame is alarmist. The sun imparts 3,000 Hiroshima Bombs to the earth’s surface per second.
Of the 5 HBs/second they claim, they are probably exaggerating, so let’s say it is 3 HB/second of warming. Of those 3, probably 2 are background warming and 1 could be due to fossil fuel burning.
The 1 additional Hiroshima Bomb per second is 0.03% of the sun’s energy that hits the earth per second.
The sun imparts 100,000,000,000 Hiroshima bombs per year to the earth’s surface.
So basically propagandistic lies and alarmism aimed at taking your money and freedom to give to them for their wealth and power, same as it always was.
Upper OHC had essentially no change between 1963 and 1993 during the cold AMO phase, and has increased since then because of low solar driving a warm AMO phase which reduces low cloud cover. It’s a negative feedback.
Sorry I’m a bit late to the party.
This guy John Abrahams is a serial offender. He has been using the zettajoule scary graph for many years now and what offends me is he is using one of the most egregious of the misuses of graphs to misinform. In particular because it is ‘anomaly’ not ‘absolute’, the uninformed reader can think it is a huge change because he has effectively hidden the zero point on the graph.
He has trotted this out over the years with his pal Dana Nuttiness over at the Guardian and I used to call him out in the comments, asking, so, please tell us the absolute percentage change these ‘anomalies’ represent, and it is effectively a sparrow-farts worth of change.
Additionally, this is a Mechanical Engineer, so why should he be allowed to have a say?
He is one of the John Cook, Stefan Lewendowski crowed of agitators with no actual ‘science’ in their skillset.
Thanks Surfer Dave. Guess who was my sarcastic correspondent in the email exchange I described 4 posts above. Please keep up the great work.
“…plus or minus three-hundredths of one degree C”, etc. Mr. Eschenbach, I have only a very small nit to contribute, and one not at all important to this post (this post which I like tremendously): Back in my day as a practicing chemist, we chemists were taught that temperatures may be measured in “degrees Centrigrade”, but that temperature DIFFERENCES or temperature ERRORS need to be stated as “Centigrade degrees”. (I’m sure you get the point of that without any further elaboration on my part.) Thank you for this post.
Thanks for throwing some cold water on a growing number of Climate Catastrophe hot chicken heads..
I don’t see how they say it is warmer. I looked at the plotted temp anomaly for Nov 16,2004 zonal latitude averages for the 1,975 meters depth. The plot was almost a straight line at minus 0.3C. The same plot but for Nov.16, 2019 gave another ~ straight line but at anomaly close to 0.00. The anomaly is defined as over the average of the 12 year period 2004 -2016. Sure it was slightly cooler in 2004, but as of Dec 2019 the trend anomaly is 0.00. AM I MISSING SOMETHING HERE OR ARE WE GETTING CO2’d again?
Salvatteci et al. 2018 used alkenone proxies to show unprecedented cooling of the seas off Peru, caused by a cooling Humboldt current from Antarctica,
https://agupubs.onlinelibrary.wiley.com/doi/full/10.1029/2018GL080634
Here is figure 3 from this paper, (d) is the ocean temperature off Peru.
This cooling is without equal over the whole Holocene, as fig. 3d shows.
Cool surface waters in the Nino 1-2 region off Peru is the key ingredient in the Bjerknes feedback underlying the ENSO. So a cooling Humboldt might have contributed to some of the very large classic type (not Modoki like 2016) el Nino events such as in 1072, 1982, 1997.
It’s curious however that although Salvatteci et al shows Humboldt cold supply to be ongoing, there have been no big classic (Bjerknes) type el Nino events since 1997. (2016 was an over-rated el Nino of the Modoki type – no engagement of the trades-upwelling Bjerknes feedback, and exaggerated by the change to Pacific SST baselines in 2014 which gave an artificial step up to Pacific, and global, temperatures.)
At the same time that Trenberth trumpets ocean warming, Judith Curry’s site is discussing the recent Dewitte et al. 2020 paper that comes to a different conclusion. These Belgian authors corrected CERES data for instrumental drift, and found the following:
Both earth’s overall energy imbalance (EEI) and the time differential of ocean heat content (OHCTD) have decreased after ~2000.
There is another attempt to reconcile Dewitte et al.’s finding with other recent OHC data by Pierre Gosselin:
https://notrickszone.com/2020/01/02/unsettled-scientists-find-ocean-heat-content-and-earths-energy-imbalance-in-decline-since-2000/
This also reinforces D19’s conclusions.
So it’s not really clear if the oceans as a whole are warming, cooling or static in temperature and what if anything this means in a climate that is always chaotically changing.
This is an important point, especially in light of the fact that two separate measurements must be examined and compared to arrive at what is referred to as the EEI, Earth Energy Imbalance.
And each of them are very difficult to measure.
There have been many separate projects which measure the TSI, Total Solar Irradiance, and although each of them has consistency over the time horizon of the study period for that device, there is very poor agreement from one set of measurements to another.
Here is a graphic showing some of these measurements of TSI:
http://lasp.colorado.edu/media/projects/SORCE/images/news_images/Fig_2-Right_Kopp_final_thumb.jpg
It is readily apparent that whatever the measured imbalance is, if there even is one, is a matter of interpretation, or deciding which data set one wants to use for the incoming part of the equation.
So when the ARGO data initially showed cooling, and this result was deemed incorrect, the data was massaged by various methods, mostly, it seems may be the case, by tossing out data points that showed cooling, until the result agreed with what was expected given the EEI.
If this is how the final results for ARGO data collection are being compiled, that would surely explain how the increases have been so incredibly steady on the part of the graph when the trend became monotonic in an upward direction. They just toss data until ARGO matches EEI!
Read this, then read it between the lines, and consider what it says about the results Willis critiques in this article.
These guys can get any results they want, and coincidently, their conclusions always agree with their prior assumptions perfectly!
They so smart!
https://earthobservatory.nasa.gov/Features/OceanCooling/
Oops, forgot the link…read this I said:
https://earthobservatory.nasa.gov/Features/OceanCooling/
Regarding “Let me close by saying that with a warming of a bit more than a tenth of a degree Celsius over sixty years it will take about five centuries to warm the upper ocean by one degree C … “: So, is this the top 2,000 meters? I haven’t seen anyone else using the term “upper ocean” to refer to that deep a layer of ocean.
Referring to a diagram of the total water column of the ocean, it is readily apparent that a vast amount of water exists below the 2000 meter line.
Here is one such diagram, linked below.
The average depth of the ocean, according to the most recent estimates (and this number changes with every estimate) is nearly twice 2000 meters.
Large areas, the so-called abyssal plains, are at 6000 meters of depth, and the trenches are in places well over 5 times as deep as the ARGO buoys sample to. Note as well that only some of them go to 2000 meters…many are in locations, at any given time, that are not that deep.
2000 meters is very deep, but not compared to the whole body of the ocean.
http://www.seasky.org/deep-sea/assets/images/ocean-layers-diagram.jpg
Here is another diagram, with more scale and additional details:
http://static4.businessinsider.com/image/53b30bda69bedd9c7b39a7d5-1200-/lakes_and_oceans_large.png
“Upper ocean” has a usual meaning of being the ocean above the thermocline. The thermocline is poorly defined in a few places and at least essentially absent in a few others, but in most of the ocean’s area it is identifiable and much closer to the surface than 2,000 meters down. An alternative meaning of “upper ocean” is the ocean that is not below a common depth of the thermocline, and as for numbers for that “one size fits all” I have heard 600 meters a little more than anything else, also 700 meters, and some common mention of 200 meters as a common thermocline depth. I am aware of some small thermocline existence as deep as 1800 meters, but 800 and 1000 meters are examples of numbers cited as below the thermocline in most of the area of the oceans. In a WUWT article more recent than this one (a 1/18/2020 reposting from drroyspencer.com by Charles Rotter), 2000 meters down is referred to as “deep ocean”.
And one more, with less vertical compression in the scaling:

As I have stated before, I prefer the metric of megachicken (the heat generated by 1M standard chickens) or gigaweasel (heat from 1B weasels) when it comes to ocean heat content.
If you want to compare the CO2 forcing with the atmospheric/oceanic response you need to use the time-rate-of-change of the atmospheric/ocean heat content. The following graphs show that the observed rate-of-change of the total ocean heat content is consistent with the observed rate-of-change of the atmospheric heat content.
h/t Javier
I believe that this is strong evidence that most of the warming of the oceans and the atmosphere in the late 20th and early 21st centuries is not being driven by CO2.
Catherine Zeta-Joules IS hot; maybe it her fault.
Good piece of work. Thank goodness all that energy has gone into the oceans. Imagine what the temperature of the atmosphere would be if it had gone there.
Regarding error bars of global Sea Level monitoring: If the widely publicized (scary) signal is SL rise of 1-3 mm/yr, can this be determined with confidence if the uncertainty in satellite obs is 3 cm? How about signal to noise issues? More ‘homogenizing’ like the air temperature fudges?
It seems impossible but the following item appears to have been drawn from the same paper:
https://www.sciencealert.com/the-ocean-is-warming-at-a-rate-of-5-atom-bombs-per-second-says-study
Any comment W ?