January 14th, 2020 by Roy W. Spencer, Ph. D.
In 2017, Christy & McNider published a study where they estimated and removed the volcanic effects from our UAH lower tropospheric (LT) temperature record, finding that 38% of the post-1979 warming trend was due to volcanic cooling early in the record.
Yesterday in my blog post I showed results from a 1D 2-layer forcing-feedback ocean model of global-average SSTs and deep-ocean temperature variations up through 2019. The model is forced with (1) the RCP6 radiative forcings scenario (mostly increasing anthropogenic greenhouse gases and aerosols and volcanoes) and (2) the observed history of El Nino and La Nina activity as expressed in the Multivariate ENSO Index (MEI) dataset. The model was optimized with adjustable parameters, with two of the requirements being model agreement with the HadSST global temperature trend during 1979-2019, and with deep-ocean (0-2000m) warming since 1990.
Since the period since 1979 is of such interest, I re-ran the model with the RCP6 volcanic aerosol forcing estimates removed. The results are shown in Fig. 1.

Fig. 1. 1D model simulation of global (60N-60S) average sea surface temperature departures from assumed energy equilibrium (in 1765), with and without the RCP6 volcanic radiative forcings included.
The results show that 41% of the ocean warming in the model was simply due to the two major volcanoes early in the record. This is in good agreement with the 38% estimate from the Christy & McNider study.
It is interesting to see the “true” warming effects of the 1982-83 and 1991-1993 El Nino episodes, which were masked by the eruptions. The peak model temperatures in those events were only 0.1 C below the record-setting 1997-98 El Nino, and 0.2 C below the 2015-16 El Nino.
This is not a new issue, of course, as Christy & McNider also published a similar analysis in Nature in 1994.
These volcanic effects on the post-1979 warming trend should always be kept in mind when discussing the post-1979 temperature trends.
NOTE: In a previous version of this post I suggested that the Christy & McNider (1994) paper had been scrubbed from Google. It turns out that Google could not find it if the authors’ middle initials were included (but DuckDuckGo had no problem finding it).
Google is becoming more and more partisan with its AI-tuned to produce a biased search engine.
I use DuckDuckGo or Bing for anything related to climate or political.
Google is just a band of partisan hacks who wants the world to turn to socialism.
Yep DDG usually finds things. Google meh!
I have DDG as a default search engine, but often enough it happens that it returns a blank page to a query , i recon the average frequency of that happening is about 1 out every 5 queries so i usually just repeat the search with google , but when i really want to find something without any google profiled infection or i use a search engine called mojeek or mojeek UK , that one does not try to profile you and or push some politically correct s..te on top of what it returns.
Björn
That’s odd because behind the panel, DDG uses Google. It just doesn’t filter or apply political and ideological bias.
Crispin,
That is incorrect. When asked directly, this is what the DDG developers had to say:
“No, we do not use Google search servers or algorithms. The only thing from Google that we currently use is we anonymously search YouTube on your behalf to display video results, which is necessary because, unfortunately, that is the only place where that content resides.”
My experience with DuckDuckGo confirms this as I can get quite different results from the two, depending on the search criteria. The only place where DDG is insufficient is that it does not provide an advanced search capability that lets you have more control over the search terms and the sites searched. When I need this kind of control, I use google search.
On a volcanic cooling note, another Philippine volcano, Mt Taal, appears to be getting ready to blow its load like Mt Penatubo did in June 1991.
Water… meet molten caldera. Water happens next?
https://www.newsweek.com/future-taal-volcano-eruptions-could-cause-tsunamis-dangerous-lava-mixture-flows-experts-warn-1482095
Solar minimums are so much fun for volcano watchers.
I wanted to comment when I first read your spin.
I waited for lunch and a glass of wine.
What evidence do you have to point minimums to earthquakes?
Best,
John
The sample size is small but there does appear to be a correlation between solar minima and geologic activity. Of course correlation does not equal causation. While interesting I think the jury is still out on that one.
John,
Did I mention earthquakes?
Maybe you need another glass of wine? And some reading glasses.
Joel
“Solar minimums are so much fun for volcano watchers.”
Please explain.
So, 40% of the warming was due to the major greenhouse gas, water vapor, condensing due to the colder atmosphere, thus resulting in the coolant, sulfur dioxide being washed out.
Now all that needs to be demonstrated is that, CO2, that rises, when it is warm, into the upper atmosphere and transports water vapor with it, mechanically helps the process of the water vapor to condense after radiating heat into space, and thereafter falling back to the ground, cooling it, as snow or rain.
CO2 is a mechanistic coolant. Also notable in the ice record where the temperature drops AFTER the CO2 rises.
I’ve been wondering for while if there is some property or process associated with atmospheric CO2 that produces a cooling effect.
My thoughts were triggered by a Tony Heller video (I think) that pointed out that ice ages appear to start when CO2 levels were high, and CO2 was low when they ended.
The fact the earth is still here, pretty much unchanged after millions of years and umpteen (relatively) cool and hot periods, must mean there are some huge negative feedback loops at work in the atmosphere or on the planet. Is one of them CO2 levels? The planet gets hot, CO2 levels rise as a consequence, until a point where there’s enough of it to produce a profound cooling effect. A cold period follows, and the CO2 levels fall as a result. Etc
PS I’m not any sort of scientist, so apologies is the above is twaddle – it was just musings.
Chris R January – 15, 2020 at 1:43 am
A cooling effect, … yes. CO2 is a radiant gas, same as H20 vapor. The sun heats the surface and the surface “radiates” IR energy that the radiant gases can absorb and re-radiate. If the re-radiated IR is toward space it is a “cooling” effect. If re-radiated horizontal or back toward the surface, it is a “warming” effect.
The heated surface also “conducts” energy to any and all atmospheric gas molecules (N2, O2, etc.) that make contact with the surface. When those heated gas molecules make contact with the atmospheric CO2, thermal energy will be “conducted” to the CO2. And the CO2 re-radiates that energy up, and down, and all around, as stated above.
Actually “No”, CO2 is not one of them. And you are correct, atmospheric CO2 ppm increases lag behind ocean water and near-surface temperature increases. And likewise, atmospheric CO2 ppm decreases lag behind ocean water and near-surface temperature decreases. The ocean is the greatest “CO2 sink” ever, and when it warms up it outgasses copious amounts of atmospheric CO2. And conversely, when it cools it ingasses copious amounts of atmospheric CO2. Plus, every raindrop that falls contains CO2 (carbonic acid) which most end up in the ocean.
Sailing from Auckland New Zealand to Norfolk Island the engine temp. went up several degrees. Checking the problem it was found that it was the sea water temp. once this was established the sulphur smell became obvious . Continuing on about 10 miles away looking back you could see a bulge on the horizon, as we were not on a regular shipping route we could find no documentation on this volcano ( water depth (from memory ) 2-3 miles , there must be hundreds of such around the world, and the green idiots? do they also have a solution for extinguishing volcanos ??
Indeed, David S.
The effect of CO2 aiding radiative cooling of saturated water vapor is not something much discussed wrt climate models. Of course, this also brings one into the realm of understanding how much, when and whether water vapor becomes more supersaturated or condenses. It might or might not happen at temperatures as low as less than -50 Celsius, but they still cannot predict it with any useful certainty. That in itself ought to be enough to reject climate models outright.
This data analysis should convince reasonable people [though fewer of this animal is around today] that the increase in warming is a natural phenomenon and NOT man-caused. For the moment, dollars and ideology continue to blind people to truth.
Hello D T.
I don’t think that Volcanoe cooling is the whole story though.
Unless Volcanoes can cause clouds to reduce for 20 years.
Which also happened during the 80s and 90s causing more Ocean warming.
Not really since it only looks at one dataset. You need to do a lot more work than this to present a convincing attribution model. It’s part of the reason why the Christy paper he cites only a couple of cites
https://link.springer.com/article/10.1007%2Fs13143-017-0070-z/metrics
when you do good science other people use it and build on it.
Not unless it promotes warming due to CO2. Anything that doesn’t follow the mantra will be ignored by researchers.
There’s a lot more to science than citations.
Steven
do you think that we have catastrophic global warming in our future?
…unless the good science contradicts the prevailing “consensus”. No government funding for that. You get Semmelweiss’d for that ….
How many papers did Einstein cite when he postulated photons?
I assume you are referring to his 1905 paper on the subject?
In which case:
M. Planck, Ann. d. Phys. 4 (1901): 561
P. Lenard, Ann. d. Phys. 8 (1902): 169 and 170.
P. Lenard, Ann. d. Phys. 8 (1902): 165 and 184, Table I, Fig. 2. 2P.
P. Lenard, Ann. d. Phys. 8 (1902): p. 150 and pp. 166-168
P. Lenard, Ann. d. Phys. 12 (1903): 469. 2
J. Stark, Die Elektrizität in Gasen, p. 57. Leipzig, 1902
This was not bad. About three out of four sentences were begun with a capital letter and ended with a period. They also contained a subject and verb. There was a little problem with the grammar, such as “he cites only a couple of cites” and the period was missing on that sentence, but “It is” was properly contracted in the following sentence.
“when you do good science other people use it and build on it.”
horse crap….when you do good science you don’t cherry pick 1979 as your start date
…and totally ignore the previous 40 years when temps fell
Scratches head, it appears Dr. Spencer is pointing out skewed conclusions due to cooling periods which aren’t properly managed in relation to warming trends.
Remove the influence of volcanic cooling and the warming trend declines over short periods like 1979 to present.
Remove volcanic activity 1939 – 1979 would be interesting.
Dr. Mosher, Dr. Spencer’s process / methodology is “good” science. If one dataset indicates a reasonable outcome isn’t it reasonable to test the others individually to determine bias before combining the results?
Maybe I’m missing something important.
Who is “Dr” Mosher?
Steven M. Mosher, B.A. English, Northwestern University (1981); Teaching Assistant, English Department, UCLA (1981-1985)
http://www.populartechnology.net/2014/06/who-is-steven-mosher.html
Satellite measurements of temperature only began in 1979, Latitude.
At the bottom of a warming trend – go figure 😂
Ok, tree rings appear on the charts – need I say more?
Guessing I should, remove the volcanic influence by decade and let’s see what warming trend occurs.
Seems logical and Dr. Mosher can use each of the data sets to find a logical bias. He’s really good at that!!!
when you do good science other people use it and build on it.
ROFLMAO. Naive much? Do you wear rose-colored glasses?
Unfortunately the proportion of ‘reasonable’ people is diminishing due to the CAGW propaganda campaign. It long ago penetrated academia, particularly the ‘arts’ and ‘social science’ departments and has now taken that vector to get into the media, the corporate sector where the fear of CAGW has established itself as a serious perceived corporate risk consideration. The bushfires in Oz have now seen senior members of the federal governing parties, the Liberal-National Party coalition, come out publicly to be seen to kow tow to the ‘climate change’ mob and try to be seen to not confront their crap but at least pay lip service. Perhaps to be expected given the magnitude of the fires and the smoke haze of most of SE Australia.
It seems to me that the net effect of the exposure of the human brain to silicon based media technology and communications channels has led to a widespread outbreak of a mental health disease I term “Imbecilicosis”. Talk about a ‘first world’ epidemic.
You hit a nerve – congrats!
Soft Science to Hard Science, the use of terms like truth, beauty, quality, good, bad, etc. are meaningless unless defined.
This necessary aspect of communication has nothing to due with the tools we use.
The horrific fires in Australia are a misery. I’ve posted several comments on JoNova related to mitigation for the future. Preventing inadvertent fires could save lives.
https://news.stanford.edu/2019/09/30/new-treatment-prevents-wildfires/
September 20, 2019
Stanford researchers have developed a gel-like fluid to prevent wildfires
Scientists and engineers worked with state and local agencies to develop and test a long-lasting, environmentally benign fire-retarding material. If used on high-risk areas, the simple, affordable treatment could dramatically cut the number of fires that occur each year.
Best Regards,
John
Due s/b do
I’ll proof my comments before posting in the future.
Due s/b do -John McClure
To be or not to be -Shakespeare
To do is to be -Descartes
Do be do be do -Sinatra
Due s/b do -McClure
To be or not to be -Shakespeare
To do is to be -Descartes
Do be do be do -Sinatra
Dr Ed Berry has this important paper in preprint. Salby, Berry and Harde reach similar conclusions – that the observed increase in atmospheric CO2 is primarily natural.
From the Abstract: “Human emissions through 2019 have added only 31 ppm to atmospheric CO2 while nature has added 100 ppm.”
Our following conversation in the Comments is of interest.
Regards, Allan
PREPRINT: “THE PHYSICS MODEL CARBON CYCLE FOR HUMAN CO2”
by Edwin X Berry, Ph.D., Physics
https://edberry.com/blog/climate/climate-physics/human-co2-has-little-effect-on-the-carbon-cycle/
ABSTRACT
The scientific basis for the effect of human carbon dioxide on atmospheric carbon dioxide rests upon correctly calculating the human carbon cycle. This paper uses the United Nations Intergovernmental Panel on Climate Change (IPCC) carbon-cycle data and allows IPCC’s assumption that the CO2 level in 1750 was 280 ppm. It derives a framework to calculate carbon cycles. It makes minor corrections to IPCC’s time constants for the natural carbon cycle to make IPCC’s flows consistent with its levels. It shows IPCC’s human carbon cycle contains significant, obvious errors. It uses IPCC’s time constants for natural carbon to recalculate the human carbon cycle. The human and natural time constants must be the same because nature must treat human and natural carbon the same. The results show human emissions have added a negligible one percent to the carbon in the carbon cycle while nature has added 3 percent, likely due to natural warming since the Little Ice Age. Human emissions through 2019 have added only 31 ppm to atmospheric CO2 while nature has added 100 ppm. If human emissions were stopped in 2020, then by 2100 only 8 ppm of human CO2 would remain in the atmosphere.
COMMENTS
ALLAN MACRAE
JANUARY 11, 2020 AT 6:14 AM
https://edberry.com/blog/climate/climate-physics/human-co2-has-little-effect-on-the-carbon-cycle/#comment-78884
[excerpt]
Hello Dr Ed Berry,
Thank you for your latest paper. I have been pondering this subject for ~12 years and am still doing so. I wonder if the following close relationship of dCO2/dt vs Temperature from my 2008 paper is helpful to your hypothesis. Please consider and advise.
In my January 2008 paper, the close correlation of the velocity dCO2/dt and delta Temperature proves that atmospheric CO2 changes lag atmospheric temperature changes by ~9 months in the modern data record, and this observation suggests Climate Sensitivity to Atmospheric CO2 must be very small, and may not even exist in measureable reality.
This plot approximates the dCO2/dt vs T correlation. Major volcanoes El Chichon (1982) and Pinatubo (1991+) disrupt the relationship.
http://www.woodfortrees.org/plot/esrl-co2/from:1979/mean:12/derivative/plot/uah6/from:1979/scale:0.22/offset:0.14
DR. ED
JANUARY 12, 2020 AT 3:51 PM
https://edberry.com/blog/climate/climate-physics/human-co2-has-little-effect-on-the-carbon-cycle/#comment-79027
[excerpt]
Dear Allan,
Thank you for your comments.
In my opinion, you have done an excellent job of showing how temperature drives CO2 concentration. Your 2008 paper predates Salby’s video presentations where he also shows how the rate of change of CO2 is a function of temperature.
By the way, it appears that you and Salby used different mathematical approaches to show the same result. If you would like to explain how your approach differs from Salby’s, you are welcome to do so.
You wrote, “I wonder if the following close relationship of dCO2/dt vs Temperature from my 2008 paper is helpful to your hypothesis. Please consider and advise.”
I think our papers together help form a consistent argument. My paper shows that human emissions are, at most, an insignificant contributor to the increase atmospheric CO2 based on carbon cycle calculations. Your paper shows that temperature change is the dominant cause of changes in atmospheric CO2.
Allan,RE Dr. Berry pre=print:
Leif Åsbrink January 7, 2020 at 3:39 pm states,
“Question: In Figure 18, how did IPCC get the 66 percent of human carbon in the atmosphere?”
Answer: The about 1 degree higher temperature is caused by humans according to IPCC and therefore the changed equilibrium between ocean and atmosphere is human. The entire increase of CO2, 133 ppm is therefore human even though a lot of it comes from the ocean….
The fundamental problem is to what extent CO2 causes the observed warming. I do not think IPCC is describing well what they are doing….
Note: IPCC says 133 ppm from ocean is human, Berry says natural. To this layperson much ta do about nothing, how can either position be proven right or wrong and in the real world why does it matter?
Dennis you wrote:
“Note: IPCC says 133 ppm from ocean is human, Berry says natural. To this layperson much ta do about nothing, how can either position be proven right or wrong and in the real world why does it matter?”
My comment:
The cause of increasing atmospheric CO2 matters because the basis of the global warming/climate change scare is the IPCC’s ASSUMPTION that the CO2 increase is primarily due to fossil fuel combustion. If the IPCC is wrong in this assumption then their entire scary narrative fails.
The IPCC’s scary narrative fails in any case, because it is overwhelmingly obvious that climate sensitivity to increasing atmospheric CO2 is far too low to cause catastrophic global warming or more chaotic weather.
To date, many trillions of dollars of scarce global resources have been squandered on the false CAGW/wilder weather scare, electrical energy grids have been destabilized and many millions of lives have been destroyed. That matters to me.
Regards, Allan
The vast majority of the CO2 pulse (130 ppm) since the 19th century is due to human fossil fuel burning.
Berry, Harde & Salby are either confused or are being deliberately misleading.
The fact that most of the atmospheric CO2 is from natural sources is irrelevant. This is easily explained by the natural annual carbon cycle during which around 25% of CO2 is absorbed by vegetation and the oceans and replaced by a fresh 25% or so from the same sources (+ fossil fuel burning). The inevitable result is that CO2 will accumulate in the atmosphere while the proportion of human CO2 will settle to a level which is the same as the annual proportion of emissions (about 4%).
Berry confuses the CO2 molecule residence cycle with the adjustment time. The adjustment time is the time taken for the ‘pulse’ to decay. Berry’s C14 argument is drivel. C14 is being removed from the atmosphere because it’s not being replaced by the nuclear bomb tests so a significant proportion will be removed each year – and not replaced by C14 molecules.
They will, though, be replaced by other CO2 molecules so the pulse will not decay at the same rate.
Quoting ALLAN MACRAE – January 15, 2020 at 2:01 am
“Yes”, …. temperature change is the dominant cause of changes in atmospheric CO2, …. but it’s the temperature change of the ocean water, ….. not the temperature change of the near-surface atmosphere.
And the following commentary which cites factual evidence substantiates the above claim, to wit:
Posted by Donald L. Klipstein – January 9, 2020 at 10:43 am
I agreed with what Donald L. Klipstein stated because it has been my learned opinion for the past 20+ years that the temperature of the ocean surface water is the “control knob” for atmospheric CO2 ppm quantities as defined by NOAA’s Mauna Loa Record and/or Keeling Curve Graph.
So, getting a clue from what Klipstein stated above, I extracted 2 consecutive years of “monthly CO2 data” from NOAA’s data bases as noted below, to wit
NOAA monthly average CO2 ppm 1971 – 1972
@ Barrow, Alaska ……. @ Mona Loa, Hawaii …… BRW is > MLO
BRW 1972 1 333.49 —— MLO 1972 1 326.77 …….. 6.72 ppm difference
BRW 1972 2 334.17 —— MLO 1972 2 327.63 …….. 6.54
BRW 1972 3 334.11 —— MLO 1972 3 327.75 …….. 6.36
BRW 1972 4 334.52 —— MLO 1972 4 329.72 …….. 4.80
BRW 1972 5 335.58 —— MLO 1972 5 330.07 …….. 5.51
BRW 1972 6 333.54 —— MLO 1972 6 329.09 …….. 4.45
BRW 1972 7 324.88 —— MLO 1972 7 328.05 …….. -3.17 (BRW < MLO)
BRW 1972 8 318.78 —— MLO 1972 8 326.32 …….. -7.54 (BRW < MLO)
BRW 1972 9 321.86 —— MLO 1972 9 324.93 …….. -3.07 (BRW < MLO)
BRW 1972 10 327.08 —– MLO 1972 10 325.06 ……. 2.02
BRW 1972 11 330.51 —– MLO 1972 11 326.50 ……. 4.01
BRW 1972 12 333.37 —– MLO 1972 12 327.55 ……. 5.82
BRW 1973 1 334.67 —— MLO 1973 1 328.54 ……. 6.13
BRW 1973 2 335.34 —— MLO 1973 2 329.56 ……. 5.78
BRW 1973 3 336.44 —— MLO 1973 3 330.30 ……. 6.14
BRW 1973 4 336.94 —— MLO 1973 4 331.50 ……. 5.44
BRW 1973 5 336.54 —— MLO 1973 5 332.48 ……. 4.06
BRW 1973 6 334.28 —— MLO 1973 6 332.07 ……. 2.21
BRW 1973 7 327.83 —— MLO 1973 7 330.87 …… -3.04 (BRW < MLO)
BRW 1973 8 322.30 —— MLO 1973 8 329.31 …… -7.01 (BRW < MLO)
BRW 1973 9 323.48 —— MLO 1973 9 327.51 …… -4.03 (BRW < MLO)
BRW 1973 10 328.36 —– MLO 1973 10 327.18 ……. 1.18
BRW 1973 11 331.93 —– MLO 1973 11 328.16 ……. 3.77
BRW 1973 12 334.92 —– MLO 1973 12 328.64 ……. 6.28
According to the above “monthly” CO2 ppm data, both the Barrow and Mauna Loa data has an identical bi-yearly (seasonal) cycle, wherein the CO2 ppm increases from the end of month 9 (September) to mid-May (month 5), ….. at which time the CO2 ppm starts decreasing and will bottom out at the end of September, thus completing its “yearly cycle”.
Also according to the above “monthly” CO2 ppm data, the Barrow CO2 ppm is consistently greater than the Mauna Loa “monthly” CO2 ppm data, ….. with the difference denoted in the right-hand column.
Consistently greater than ….. except for the summer months of July (7), August (8) and September (9) …. at which time the Barrow atmospheric CO2 ppm “goes negative”, decreasing below the Mauna Loa CO2 ppm quantities.
And the only actual, factual, logical reason for the Barrow CO2 ppm to go “negative” (compared to Maun Loa) …… is exactly what Donald L. Klipstein stated in his above quoted comment.
Around the 1st of July, as soon as the sea ice melts at Barrow, the extremely cold surface water ….. “starts sucking up CO2 out of the lowest part of the troposphere in that area”, …. which causes the Barrow CO2 ppm to go “negative” relative to Mauna Loa CO2 ppm quantities.
”HA”, there sure nuff isn’t enough “green-growing biomass” in Barrow, Alaska to suck ¼ ppm CO2 out of the atmosphere, let alone 7.54 ppm (August 72).
And it is a biological impossibility for the wintertime microbial decomposition of dead biomass in the Northern Hemisphere to result in an average 8 ppm increase in Mauna Loa measured atmospheric CO2 quantities as defined by the MLR and/or KCG.
“HA”, how is it possible for the Northern Hemisphere biomass to ingas an average 6 ppm CO2 in the summertime ……. and outgas an average 8 ppm CO2 in the wintertime?
Live plants grow and dead plants decompose ….. in the warm, moist spring and summer.
Cheers, …… Sam Cogar, …… AB Degree -Biological and Physical Science – GSC 63’
.
Why do you think this is relevant? We know CO2 accumulates at a faster rate during warm periods (more emission – less absorption). These are the natural fluctuations in CO2 levels. However this doesn’t explain the long term trend. ENSO can cause global temperatures to vary by 0.5 deg. This, in turn, can cause rate of CO2 (dCO2/dt) accumulation to vary. A 0.5 deg increase might increase CO2 by 2 ppm or thereabouts. Since 1850 global temperatures have increased by 1 degree so we might expect an extra few ppm from warming alone.
Ice core data suggests that CO2 levels increased by 100 ppm following the LGM in response to a 5+ deg increase. But this process took thousands of years, i.e. enough time CO2 to be ‘dug out’ from the deep ocean.
CO2 does cause the earth to warm. There is no doubt about this. It might be worth reading through Jack Barrett’s website ( http://www.barrettbellamyclimate.com/ ) . Jack is far from an alarmist, he has been a prominent critic of GCMs, but he has a deep understanding of molecular spectroscopy.
Sam and John – you boys (and some others) are quick to ASSUME what I am saying – but you could actually KNOW what I am saying if you read this paper and study the spreadsheet – but then that would take some effort on your part.
CO2, GLOBAL WARMING, CLIMATE AND ENERGY
by Allan M.R. MacRae, B.A.Sc., M.Eng., June 15, 2019
https://wattsupwiththat.com/2019/06/15/co2-global-warming-climate-and-energy-2/
Excel: https://wattsupwiththat.com/wp-content/uploads/2019/07/Rev_CO2-Global-Warming-Climate-and-Energy-June2019-FINAL.xlsx
______________________________
John and Sam – You might check Dr Ed Berry’s academic background and his career accomplishments before you “shoot from this hip” in his direction.
https://edberry.com/about-page/berry-cv/
The tone of your supercilious comments reminds me of that bombastic cartoon character Foghorn Leghorn:
“Any of this getting through that little old blue bonnet of yours?
Boy’s gotta mouth like a cannon, always shootin’ it off.
He’s about as sharp as a bowling ball.
I say, boy, pay attention when I’m talkin’ to ya, boy.
Kid don’t quit talkin’ so much he’ll get his tongue sunburned.
Now looka, I say looka here.
Pay attention to me boy! I’m not just talkin’ to hear my head roar.
Smart boy, got a mind like a steel trap – full of mice.
That boy’s as strong as an ox, and just about as smart.
This boy’s more mixed up than a feather in a whirlwind.”
– Foghorn Leghorn
If he’s wrong – he’s wrong. That applies to Ed Berry as well as any other academic. Berry’s case is seriously flawed.
From your WUWT link
In reality, atmospheric CO2 changes lag global temperature changes at all measured time scales.
And what if humans are producing a new source of CO2 production which is independent of temperature?
Several lines of evidence suggest the response of CO2 to temperature is about 16 ppm per deg C, e.g.
1. Henry’s Law
2. Increase of ~100 ppm of atmospheric CO2 in response to a 5-6 deg increase in global temperature following the LGM.
The post-1850 temperature rise of ~1 deg C cannot explain the 130 ppm increase in CO2.
John, as I stated in my 10January2020 paper, I have thought about this issue for 12 years since my January 2008 paper and I am still agnostic, because I have not studied the carbon balance issue in detail.
However, when some of the most intelligent people I know tell me they have finally been convinced by Berry’s latest paper, I have to take notice, and now I have to study his paper in detail. For me, that entails reproducing every line of logic, and it takes time. I am not so quick to dismiss Salby, Berry and Harde, who are all of the same opinion.
It is notable that Kuo (1990) and Keeling (1995) came to the same conclusion (CO2 lags temperature) and their papers in Nature have been carefully ignored by the warmist camp.
ALLAN MACRAE – January 15, 2020 at 7:20 pm
Allan, ….. I assume nothing. I have read most all of your postings and have found them quite lacking in common sense thinking, logical reasoning and/or intelligent deductions. The biggest majority of everything that you have posted claiming to be scientific facts and evidence, is, in actuality, nothing more than AVERAGE proxy data, associations, correlations, estimations, insinuations and imaginations.
Allan, such as the following nonsense, to wit:
FOOEY.
First of all, the Mauna Loa and Barrow CO2 records, as noted in my above post, is factual proof that atmospheric CO2 has a 6 months (seasonal) or biyearly cycle time of increases/decreases, ….. not 9 months as you have been testifying too. The Mauna Loa Record and KCG also proves you wrong.
And secondly, the “control knob” for the ingassing/outgassing of atmospheric CO2 is NOT the near-surface air temperatures that you and a zillion other science illiterates believe it to be.
The “control knob” for the ingassing/outgassing of atmospheric CO2 is the temperatures of the surface waters of the world’s oceans, with the Southern Hemisphere water being the “primary” driver. The Northern Hemisphere is 60% land and 40% water. The Southern Hemisphere is 20% land and 80% water.
And Allan MacRae, ….. my AB in Biological and Physical Science …… “trumps” your ….. BA in Science and Mechanical Engineering. You have no formal education in/on the biology of the natural world of planet earth so don’t be trying to educate me on what you think it is.
Allan, you can prove yourself right, …. and me wrong, ….. but to do that you must first prove that the Barrow, Alaska, atmospheric CO2 ppm doesn’t actually go “negative” during July, August and September, ……. and secondly, offer factual proof and evidence that the following cited graph of 1979-2017 UAH satellite global lower atmosphere temperatures & atmospheric CO2 ppm data …… is nothing more than fake, bogus, junk science agitprop because the plotted rise in atmospheric CO2 does not “lag behind” and/or “track” the plotted increases/decreases in near-surface atmospheric temperatures, ……… as you claim they are actually doing.
Allan, you and Ferdinand E are like “two peas in a pod”, ……. you compose and publish papers based on questionable data and “fuzzy’ math calculations ….. and then launch “personal attacks” against anyone that criticizes or disagrees with your opinion/results. Doing the aforesaid “attacks” will not prevent your loss of “professional creditability” when the factual science is finally recognized by the populace.
ALLAN MACRAE – January 15, 2020 at 8:12 pm
Allan, are you getting hyper and/or mentally unstable in your haste to defend your actions and/or CYA for your rambling, pseudo fact filled comments concerning earth’s climate?
Allan, I don’t ever recall mentioning anything about Dr Ed Berry, …..not his name or anything about him. And, ps, … career accomplishments impress me, ….. but only iffen they are actual, factual “science based”, ……. but most anyone, if they have the money, can “purchase” an academic background of their choice.
Well now, Allan, …. as the ole folks say, …… “If you got it, flaunt it”.
And Alan, when it comes to the Biology of planet earth, ……. and the science of the natural world around us, ……. I know damn well that I am better educated, more qualified and with my vastly 70+ years of greater ‘learned’ experiences than you will ever hope to have, ….. so “YES”, my supercilious comments are right on target.
So cease with the “personal attacks” and provide facts and/or evidence that my posted science is wrong.
Hello Sam:
https://www.youtube.com/watch?v=0Z8g-smE2sk&w=560&h=315%5D
In this video, produced by the American Museum of Natural History,
at 1:57 it states: “May CO2: CO2 builds up after Winter decay of plants”
and at 2:10 it states: “October CO2: Plant regrowth removes CO2 from air”.
Sam, you have vehemently opposed this assessment of the Keeling Curve on many occasions, often ranting that this assessment is my own personal delusion, when in fact it is the assessment of the scientific community starting with Charles Keeling himself. To my recollection, that is the only significant point that you have made to date.
To be frank, I don’t really care about you and your rants – there is a high probability that you are wrong, but even if you are correct you have provided inadequate scientific evidence – just your usual bombastic, abusive blathering.
There are a number of competent scientists who participate in this forum. I doubt that any of them are persuaded by your ability to speak more loudly, incoherently and offensively than anyone else.
ALLAN MACRAE – January 16, 2020 at 11:46 pm
Allan, I’m pretty sure that iffen you do a Google search you can find 10,000+- other citations that say the same thing.
But Allan, to improve your creditability among learned individuals, I suggest that you pay attention to what I’ve been telling you and what the United States Department of Agriculture Food Safety has to say about microbial decomposition of dead biomass (meats, fish, plants, vegetables, etc.).
“DUH”, the American Museum of Natural History does not think up, create or enforce the Public Health Laws in the US of A, ……. but the USDA sure as hell does, with assistance from State Public Health Department.
“YUP”, shur nuff, Allan, …… plant growth and regrowth remove CO2 from the air during the daytime only. And that same plant growth and regrowth emits CO2 back into the air during both daytime and nighttime (24/7). And iffen it is “warm & wet” enough for plant metabolism, ….. then it is “warm & wet” enough for microbial metabolism of any and all types of dead biomass.
Allan, do you own (or rent) a refrigerator (or freezer)? I’m sure you do, … so tell me, … what the hell is your reason or purpose for owning such a device? Surely not for making ice cubes to cool down your “hot toddies”.
“YUP”, shur nuff, Allan, …… because that assessment is FUBAR and cannot be correlated or directly associated with any known scientific facts associated with the natural world. The bi-yearly (seasonal) cycling of the Keeling Curve Graph has been “steady & consistent” for the past 62 years, ….. and the changing of the equinoxes, which governs the “warming & cooling” of the ocean water is the ONLY “steady & consistent” natural cycle that exists on planet earth.
And don’t be fergettin, Allan, …… 100% of the “experts” disagreed with Marshall and Robin Warren as to the cause of “peptic ulcers”, adamantly sticking to the old belief that they were caused by stress and lifestyle. All those “experts” were completely ignorant of the fact that the bacterium Helicobacter pylori was the culprit.
Yes Sam,
Doctors were wrong about stomach ulcers, geologists rejected continental drift, and 100 scientists opined that Einstein was wrong (Einstein replied “One would be enough”).
So maybe you are correct, Sam. I have not studied your hypothesis and will not likely do so. Good luck with it.
Allan, I hope that your decision does not have repercussions that will affect your future endeavors.
It is interesting to see the “true” warming effects of the 1982-83 and 1991-1993 El Nino episodes, which were masked by the eruptions.
Pinatubo volcanic cooling was vastly overtaken by falling solar output.
Your volcanic forced warming trend is spurious.
1991-92 and 2015-16 were El Nino years. The similarity of the trend is more likely due to that than solar activity. Pinatubo could have lowered the 1991-94 base temperatures.
That said, I’m not convinced the Pinatubo (or El Chichon) effect lasted long enough to distort the long term trend too much – but it’s possible. Solar activity has been at pre-1900 levels for at least a decade and has had no effect on the warming trend.
1991-92 and 2015-16 were El Nino years. The similarity of the trend is more likely due to that than solar activity.
They were El Nino years because of solar max TSI.
TSI drove eq. OHC during the 2015/16 El Nino per my predictions, and then SST fell with TSI per my Dec 2015 prediction during the subsequent multi-year decline in solar activity.
The 1991/92 situation was no different except for TSI development.
Solar activity has been at pre-1900 levels for at least a decade
Vague and untrue statement. What matters to decadal warming is whether SC sunspot activity exceeded the warming threshold of 95 spots I established in 2014/15, which it did.
Volcanic cooling is vastly overrated – it’s overwhelmed by TSI cooling.
TSI effect on eq. OHC during the SC24 max to cause the 2015/16 El Nino:
It happened according to my 2014/15 work on SN, F10.7cm flux, and SORCE TSI:
They were El Nino years because of solar max TSI.
And what caused the EL Nino in 1997-98?
Vague and untrue statement
Solar Cycle 24 was similar in strength to late 19th century cycles. So NOT “untrue”.
Solar cycles cannot explain the warming trend ove rthe past century.
Solar activity has been at pre-1900 levels for at least a decade
Your statement was truly “untrue”.
Sunspot activity pre-1900s averaged 74.4, post-1900 it was 85.9, and for four years, 2011-2014, it averaged 93.2. The late SN peak in 2014 drove the lagging TSI peak in early 2015. Peak SC24 solar activity was sufficiently high for warming, but I repeat myself.
The reason for everyone’s confusion is the non-linear TSI wrt SN.
And what caused the EL Nino in 1997-98?
Tropical impulse response to solar cycle 23 onset TSI under clearer skies.
So sea temperatures are driven by SW, visible light, which we know increased due to sun spots to about 1980, but because of volcanic activity not all this increase in SW was let through the atmosphere, delaying the temperature increase.
Makes sense, and why warming has gone on past the sunspot peak, and defeats this used as an argument against solar warming.
I remember Suzuki going on about the massive release of CO2 when Pinatubo blew its top, and how the world was going to come to an end etc as a result. And all that happened was that we had a .5 degree drop in temp for about two years and pretty sunsets.
I wrote to him several times asking him why he still sees fit to lecture us about CO2 and climate change when his ideas were proven so utterly wrong at that time by fact. I did not receive an answer.
Does anyone have a link to Suzuki’s insane blathering’s at the time? I looked a while back and couldn’t find anything, funny that, you couldn’t get away from it at the time. I’ll try again, its worth a look, total panic and dire predictions…the full hysterical emotional blowout….highly amusing.
Posts from 2016 and 2017:
https://wattsupwiththat.com/2017/10/25/study-ice-sheets-may-melt-rapidly-in-response-to-soot-from-distant-volcanoes/comment-page-1/#comment-2645637
Let’s do a full-Earth-scale test to eliminate scale-up uncertainties:
Century-scale volcanoes like El Chichon in 1982 and Pinatubo in 1991 caused global cooling of about 0.5C, which then dissipated over several years. That global cooling was the NET EFFECT of ALL factors, including the reduced transparency of the atmospheric due to airborne volcanic aerosols and particulates (the dominant factor) and lesser impacts such as ash darkening of ice sheets that caused some melting.
In summary, the NET EFFECT of large-scale volcanoes is temporary global cooling – there is no evidence of any runaway warming effects from volcanoes.
Regards, Allan
https://wattsupwiththat.com/2017/09/20/from-the-the-stupid-it-burns-department-science-denial-not-limited-to-political-right/comment-page-1/#comment-2616345
NOT A WHOLE LOTTA GLOBAL WARMING GOIN’ ON!
Unlike the deeply flawed computer climate models cited by the IPCC, Bill Illis has created a temperature model that actually works in the short-term (multi-decades). It shows global temperatures correlate primarily with NIno3.4 area temperatures – an area of the Pacific Ocean that is about 1% of global surface area. There are only four input parameters, with Nino3.4 being the most influential. CO2 has almost no influence. So what drives the Nino3.4 temperatures? Short term, the ENSO. Longer term, probably the integral of solar activity – see Dan Pangburn’s work.
Bill’s post is here.
https://wattsupwiththat.com/2016/09/23/lewandowsky-and-cook-deniers-cannot-provide-a-coherent-alternate-worldview/comment-page-1/#comment-2306066
Bill’s equation is:
Tropics Troposphere Temp = 0.288 * Nino 3.4 Index (of 3 months previous) + 0.499 * AMO Index + -3.22 * Aerosol Optical Depth volcano Index + 0.07 Constant + 0.4395*Ln(CO2) – 2.59 CO2 constant
Bill’s graph is here – since 1958, not a whole lotta global warming goin’ on!

My simpler equation using only the Nino3.4 Index Anomaly is:
UAHLTcalc Global (Anom. in degC, ~four months later) = 0.20*Nino3.4IndexAnom + 0.15
Data: Nino3.4IndexAnom is at: http://www.cpc.ncep.noaa.gov/data/indices/sstoi.indices
It shows that much or all of the apparent warming since ~1982 is a natural recovery from the cooling impact of two major volcanoes – El Chichon and Pinatubo.
Here is the plot of my equation:
https://www.facebook.com/photo.php?fbid=1106756229401938&set=a.1012901982120697.1073741826.100002027142240&type=3&theater
I added the Sato Global Mean Optical Depth Index (h/t Bill Illis) to compensate for the cooling impact of major volcanoes, so the equation changes to:
UAHLTcalc Global (Anom. in degC) = 0.20*Nino3.4IndexAnom (four months earlier) + 0.15 – 8*SatoGlobalMeanOpticalDepthIndex
The “Sato Index” is factored by about -8 and here is the result – the Orange calculated global temperature line follows the Red actual UAH global LT temperature line reasonably well, with one brief deviation at the time of the Pinatubo eruption.
Here is the plot of my new equation, with the “Sato” index:
https://www.facebook.com/photo.php?fbid=1443923555685202&set=a.1012901982120697.1073741826.100002027142240&type=3&theater
I agree with Bill’s conclusion that
THE IMPACT OF INCREASING ATMOSPHERIC CO2 ON GLOBAL TEMPERATURE IS SO CLOSE TO ZERO AS TO BE MATERIALLY INSIGNIFICANT.
Regards, Allan
Century-scale volcanoes like El Chichon in 1982 and Pinatubo in 1991 caused global cooling of about 0.5C, which then dissipated over several years. That global cooling was the NET EFFECT of ALL factors, including the reduced transparency of the atmospheric due to airborne volcanic aerosols and particulates (the dominant factor) and lesser impacts such as ash darkening of ice sheets that caused some melting.
In summary, the NET EFFECT of large-scale volcanoes is temporary global cooling
It’s not often that I disagree with you Allan.
Hi Bob,
Please see Section 5 of the Summary spreadsheet here, which explains my rationale:
https://wattsupwiththat.com/wp-content/uploads/2019/07/Rev_CO2-Global-Warming-Climate-and-Energy-June2019-FINAL.xlsx
The difference between the purple-symbols curve (UAHLT calc w/o Sato) and the blue-symbols curve (UAHLT Global measured) is attributed to major volcanoes El Chichon and Pinatubo.
Including the Sato adjustment in the red-symbols curve (UAHLT calc w/Sato) causes the red (calculated) and blue curves (measured) to converge.
Re your analysis – the issue for me is the vertical offset of the temperature curves due to stratospheric aerosols – I agree with you that the slopes of the cooling curves post-El Nino are similar in your examples.
Best personal regards, Allan
It is always amazing for me to look at head posts or comments telling us that if the volcanoes hadn’t erupted at the beginning of the satellite era, the past would be warmer and thus the trend lower.
As if the trend was in their life the only thing that would matter ever.
The trend would have been lower as well if the two big El Ninos wouldn’t have happened, and of course higher without the La Ninas these people always ‘forget’:
Thus
– either you keep the UAH temperature series as it is,
– or you remove volcano and ENSO signals.
Exactly that was done by Grant Foster and Stefan Rahmstorf for surface series in 2011, and by Benjamin Santer, Celine Bonfils & al for the lower troposphere in 2014.
The latter group used RSS rev. 3.3 which has been nearly identical to UAH6.0.
Their result: the residual trend after removal was about 0.09 C / decade (vs. 0.12 C for the original data at that time). This means that volcanoes and Ninos and Ninas account for about 30 % alltogether.
Exactly that you would obtain with UAH6.0 LT.
Rgds
J.-P. D.
Dr. Spencer’s analysis showing the volcanoes of the 1980s and early 1990s contributing 40% of the warming, confirms the work done by Christy and McNider, using different methods.
That UAH 6.0 data that says that temperatures have increased at 0.128 C per decade since 1979. Based on the impact of stratospheric volcanoes, that increase would drop to 0.0768 C per decade. That amounts to < 1C per 100 years versus 1.54 C per 100 years.
Stratospheric volcanoes can impact temperatures downward but are otherwise causally unrelated to climate. Therefore we need to consider how volcanoes have influenced the temperature record and might skew long term trends. ENSO, however, is likely causally related to climate – part of the ocean – atmosphere feedback system. Therefore ENSO events should not be treated as outside events that effect climate the way volcanoes do.
All the really big volcanic eruptions in the recent past have occurred during solar minimums. A lot of theories why but no one has really come up with one that sticks. https://pubs.giss.nasa.gov/abs/st07500u.html
Magnetic force may affect them?
Yes I wish I had saved every valuable paper I have come across because Google is certainly making them hard to find, perhaps impossible unless you remember the authors first middle and last name because apparently remembering most of the title doesn’t work.
By their nature, volcanic eruptions are not predictable, long term. To create scenarios of the impact of volcanic aerosols, one can rely on statistical averages of the past. However, there is no guarantee that ‘the recent past is the key to the near future.’ It has often been remarked that civilization, as we know it, would have been impossible during periods of much greater volcanic activity in the distant past. Mann famously hypothesized a significant volcanic event (circa 2014) that lowered his 1988 temperature predictions for his “Draconian Reductions” scenario — an event that did not take place!
Volcanic eruptions that have global impacts can and do take place at unpredictable times and places, lowering global temperatures for a couple of years. That results in most scenario-driven, average global temperature predictions being an upper-bound, because there are no natural (or man-made) discrete phenomena of similar frequency or magnitude that cause warming. One might argue that the quasi-periodic El Nino/La Nina events have a comparable impact. However, they have opposing effects and are somewhat predictable. In that sense, volcanic eruptions are uniquely asymmetric in their impacts, leading to unpredictable, punctuated cooling.
Clyde Spencer January 15, 2020 at 10:06 am
By their nature, volcanic eruptions are not predictable, long term. To create scenarios of the impact of volcanic aerosols, one can rely on statistical averages of the past. However, there is no guarantee that ‘the recent past is the key to the near future.’ It has often been remarked that civilization, as we know it, would have been impossible during periods of much greater volcanic activity in the distant past. Mann famously hypothesized a significant volcanic event (circa 2014) that lowered his 1988 temperature predictions for his “Draconian Reductions” scenario — an event that did not take place!
Actually he hypothesized three volcanos: 1995, 2015, 2025
Pinatubo was covered by the 1995 case.
Phil
Since he had no way of reliably predicting any of them, he obviously got lucky with the Pinatubo event. However, I’m cynical enough to suspect that the whole point of creating a scenario of three volcanic events was to drive down the predicted temperatures to make it look like “Draconian Reductions” of fossil fuel emissions was the only salvation for humanity, when it was really the volcanoes doing the heavy lifting.
Clyde Spencer January 15, 2020 at 7:50 pm
Phil
Since he had no way of reliably predicting any of them, he obviously got lucky with the Pinatubo event. However, I’m cynical enough to suspect that the whole point of creating a scenario of three volcanic events was to drive down the predicted temperatures to make it look like “Draconian Reductions” of fossil fuel emissions was the only salvation for humanity, when it was really the volcanoes doing the heavy lifting.
Judging by your comment I take it that you haven’t read the paper?
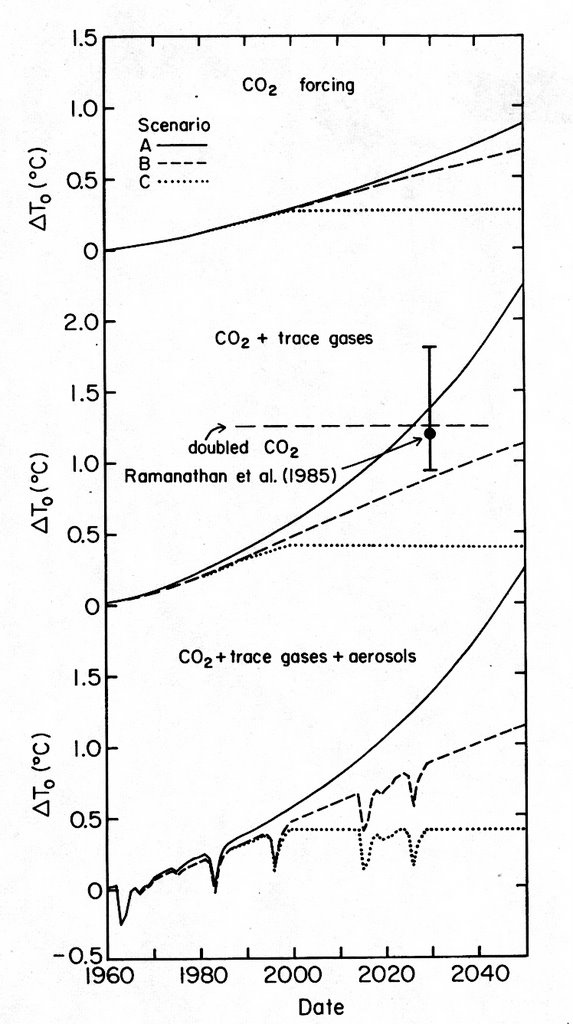
Fig 2 from Hansen 88 rebuts your assertion of “it was really the volcanoes doing the heavy lifting.”
Phil
The graph you provided looks different from what he used in his 1988 Senate testimony, which is what I used for my analysis. Among other things, it didn’t go out to 2025, and wasn’t as flat in the years between assumed eruptions.
https://wattsupwiththat.com/2018/06/30/analysis-of-james-hansens-1988-prediction-of-global-temperatures-for-the-last-30-years/
Clyde Spencer January 16, 2020 at 7:07 pm
Phil
The graph you provided looks different from what he used in his 1988 Senate testimony, which is what I used for my analysis. Among other things, it didn’t go out to 2025, and wasn’t as flat in the years between assumed eruptions.
Yes it’s from his paper on the subject and clearly shows that the volcanoes are not doing the ‘heavy lifting’. You presumably are referring to Fig 3 from his testimony which was part of Fig 3 from his paper. It clearly supports the Fig 2 I posted, the Scenario C curve supports that it was “flat in the years between assumed eruptions”.
A reading of the paper would suggest that rather than ‘driving down the predicted temperatures’ large volcanoes like El Chichon only result in a short lived reduction in temperature followed by a return to the previous trajectory. So your cynicism appears to be ill founded.
Phil
What you fail to acknowledge is that any linear regression fitted to the curve (C), in order to simplify or smooth it, will be dragged down by the hypothesized volcanic eruptions that didn’t take place as postulated. Incidentally, he didn’t get Pinatubo right because it happened in 1992, not 1995 as you assert. That it was even close, was just dumb luck. By 1995, the effects were pretty much gone.
If you haven’t yet seen it, I suggest reading McKitrick’s analysis at: https://judithcurry.com/2020/01/17/explaining-the-discrepancies-between-hausfather-et-al-2019-and-lewiscurry-2018/
Clyde Spencer January 17, 2020 at 9:59 am
Phil
What you fail to acknowledge is that any linear regression fitted to the curve (C), in order to simplify or smooth it, will be dragged down by the hypothesized volcanic eruptions that didn’t take place as postulated.
You don’t understand what is being presented in the paper, I suggest you read it.
The graphs from Fig 2 are the forcings based on the emission scenarios and stratospheric aerosols (due to large volcanoes), they are not smoothed.
Incidentally, he didn’t get Pinatubo right because it happened in 1992, not 1995 as you assert. That it was even close, was just dumb luck. By 1995, the effects were pretty much gone.
The point is that he showed the result of a hypothesized volcano before the cessation of the growth in forcing in 2000 (scenario C), one actually occurred in 1995. The expected behavior occurred, a small, short-lived reduction in temperature followed by a return to the previous trajectory. It certainly doesn’t support the ideas that “it was really the volcanoes doing the heavy lifting”.
If you haven’t yet seen it, I suggest reading McKitrick’s analysis. I took a look at it, he gets it wrong.
He says “To make trend comparisons meaningful, for the purpose of the Hansen (1988-2017) ……… interval comparisons, the 1992 (Mount Pinatubo) event needs to be removed since it depressed observed temperatures but is not simulated in climate models.” But that is exactly what Hansen did, he did simulate the effect of a 1995 volcano in his model for scenarios B and C, so why on earth does it need to be removed for the purpose of comparison?
I am curious about how the weather data gets manipulated to show temperature changes over time.
Are researchers using the daytime high and low or are they taking an hourly average over the day. In North American the daily high is often a short term spike and not indicative of the days heat.
So,when we hear that we are having the highest temperature months and years on record…what exactly is their point of measurement? Are the recording stations in cities and airports and are they accurately reading the true temperature or an asphalt influenced false high?
Has anyone been able to get funding money to really study this.
From the article: “The peak model temperatures in those events were only 0.1 C below the record-setting 1997-98 El Nino, and 0.2 C below the 2015-16 El Nino.”
An upper boundary on warming here? Temperatures reach these high levels, which are within one-tenth of a degree C of each other, and then the temperatures fall off for decades.
Lower boundary, the cool of the 1910’s and 1970’s?
Here a U.S surface temperature chart to illustrate the possible boundaries of our current temperature record.
Like Trump says (paraphrasing): The temperatures go up, and then they go down, and then they go up again.
They do this within certain bounds it seems. Trump didn’t say that part. 🙂
SST changes are bounded by TSI changes, bounded by changes in the sun’s magnetic field.
Climate extremes are limited by the duration and magnitude of solar extremes.
“It is interesting to see the “true” warming effects of the 1982-83 and 1991-1993 El Nino episodes, which were masked by the eruptions.”
There would not have been El Nino episodes in 1982-83 and 1991-92 without the eruptions, they were a response to the volcanic aerosol cooling. The solar wind speed was increasing in 1982 and 1991, the wrong direction for El Nino conditions.
As I have indicated in a reply before, we know that Milankovic cycles account for mid-term climate variability and Shaviv’s galactic orbit may account for long term climate variability. Short term cycles certainly exist but I’ve seen no convincing explanation as to why. Natural scientific curiosity leads me to wonder about whether the lunar orbit has an effect on climate. The reason may not be obvious, but the moon’s orbit determines the tides. In my part of the world, the tide varies by 6 feet over a 12 hour cycle. It’s hard to believe that if the tide is variable, that it has no impact on climate. Like the Earth’s orbit around the Sun, the Moon’s orbit is not perfect. Therefore, there is tidal variation. High tide and low tide vary. Wouldn’t it be interesting if climate variation came down to three astronomical factors, the Sun’s orbit around the galaxy, the Earth’s orbit around the Sun, and the Moon’s orbit around the Earth. .