reposted from Jennifer Marohasy’s blog

January 4, 2020 By jennifer
The word unprecedented is applied to almost every bad thing that happens at the moment, as though particular events could not have been predicted, and have never happened before at such a scale or intensity. This is creating so much anxiety, because it follows logically that we are living in uncertain time: that there really is a climate emergency.
The historical evidence, however, indicates fires have burnt very large areas before, and it has been hotter.
Some of the catastrophe has been compounded by our refusal to prepare appropriately, as is the case with the current bushfire emergency here in Australia. Expert Dr Christine Finlay explains the importance of properly managing fire loads in an article in today’s The Australian.
The situation is perhaps also made worse by fiddling with the historical temperature record. This will affect the capacity of those modelling bushfire behaviour to obtain an accurate forecast.
We have had an horrific start to the bushfire season, and much is being said about the more than 17 lives lost already, and that smoke has blown as far as New Zealand. Unprecedented, has been the claim. But just 10 years ago, on 9 February 2009, 173 lives were lost in the Black Saturday inferno. On 13th January 1939 (Black Friday), 2 million hectares burnt with ash reportedly falling on New Zealand. That was probably the worst bushfire catastrophe in Australia’s modern recorded history in terms of area burnt and it was 80 years ago: January 13, 1939. It was avoidable.
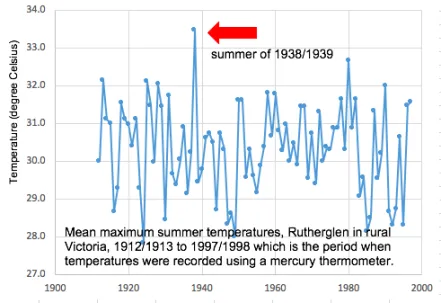
Last summer, and this summer, has been hot in Australia. But the summer of 1938-1939 was probably hotter — and back then more ferocious bushfires burnt larger areas. In rural Victoria, the summer of 1938-1939 was on average at least two degrees hotter than anything measured with equivalent equipment since, as shown in Figure 1.

Figure 1. Mean maximum summer (December, January February) temperatures as measured at Rutherglen in rural Victoria by The Australian Bureau of Meteorology for the period when mercury thermometers were used. Data unadjusted/not homogenised.
The summer of 1938-1939 was probably the hottest ever in recorded history for the states of New South Wales and Victoria. It is difficult to know for sure because the Bureau has since changed how temperatures are measured at many locations and has not provided any indication of how current electronic probes are recording relative to the earlier mercury thermometers.
Further, since 2011, the Bureau is not averaging measurements from these probes so the hottest recorded daily temperature is now a one-second spot reading from an electronic devise with a sheath of unknown thickness. In the United States similar equipment is used and the readings are averaged over five (5) minutes and then the measurement recorded.
The year before last, I worked with the Indonesian Bureau of Meteorology (BMKG), and understood their difficulty of getting a temperature equivalence between mercury thermometers and readings from electronic probes at their thousands of weather stations. The Indonesian Bureau has a policy of keeping both recording devices in the same shelter, and taking measurements from both. They take this issue very seriously, and acknowledge the problem.
The Australian Bureau of Meteorology has a policy of a three year period of overlap, yet the metadata shows that for its supposedly highest quality recording stations (for example Rutherglen), the mercury thermometer is removed the very same day an electronic probe is installed. This is a total contravention of the Bureau’s own policy, and nothing is being done about it.
I explained much of this to Australia’s Chief Scientist in a letter some years ago — neither he, nor the Bureau, deny that our current method of recording temperatures here in Australia is not covered by any international ISO standard. It is very different from methods currently employed in the United States and also Indonesia, and as recommended by the World Meteorological Organisation.
Then there is the issue of the remodelling of temperatures, I explained how this affects trends at Rutherglen in a blog post early last year.
The remodelling, that has the technical term of homogenisation, is a two-step process. With respect to the temperature maxima at Rutherglen, the Bureau identified a ‘statistically significant discontinuity’ in 1938–1939. Values were then changed.
It is somewhat peculiar that the Bureau did not recognise, in its process of remodelling the historical data for Rutherglen, that the summer of 1938-1939 was exceptionally hot because of drought, compounded by bushfires. Rather David Jones and Blair Trewin at the Bureau used the exceptional hot January of 1939 as an excuse for remodelling the historical temperature record at Rutherglen, with the changed values subsequently incorporated into international data sets.
These made-up values are then promoted by the United Nations. Hollywood superstars like Bette Midler and Bernie Sanders tweet misguided opinion back to the Australian Prime Minister. They have no idea of the extent of their ignorance.
After a recent Sky News Television interview that I did with Chris Smith several people have contacted me about the hottest day ever recorded in Australia. They have suggested it is 16th January 1889 being 53.1 degrees Celsius at Cloncurry in Queensland. A problem with this claim is that the temperature was not measured from within a Stevenson screen, though it was a recording at an official station. A Stevenson screen (to shelterer the mercury thermometer) was not installed by Queensland meteorologist Clement Ragge at Cloncurry until the next month, until February 1889.
The hottest temperature ever recorded in Australia using standard equipment (a mercury thermometer in a Stevenson screen) at an official recording station is 51.7 degrees Celsius (125 degrees Fahrenheit) at the Bourke Post Office on January 3, 1909.
We are all entitled to our own opinion, not not our own facts.
*****
The picture featured at the very top of this post is of grass trees at Scott River, Western Australia, taken in January 2007, following a “mild, patchy burn” by David Ward. David has contributed several articles on bushfire management to this blog, you can find some of the links here: http://jennifermarohasy.com/2009/04/the-mathematics-of-connectivity-and-bushfire/
Figure 1
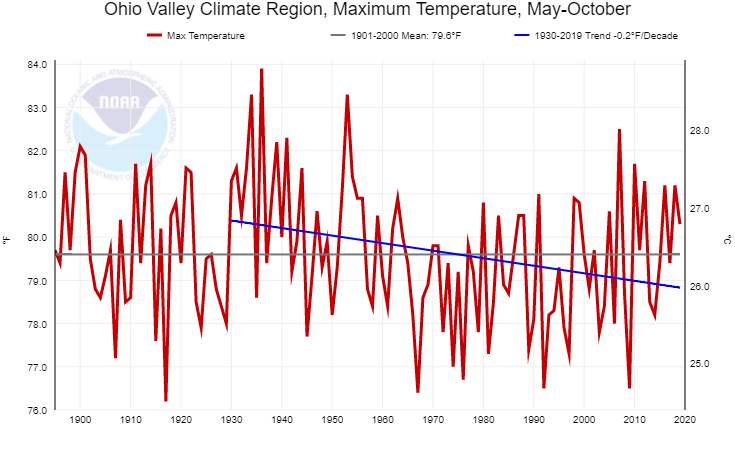
sure looks like a downward trend in maximum summer temperatures, similar to those that can be generated from NOAA’s Climate at a Glance
https://www.ncdc.noaa.gov/cag/national/time-series
for example:
Same is true for much of the South and Eastern United States.
Here is the average maximum temperature graph in Victoria.
It’s getting warmer.
But the article clearly states misgivings over the handling of the raw data by the .gov weather blokes.
Your comment does not refute that claim, it simply presents the Aussie data as if it were fact, ergo, you must be trolling, right ?
Nick, perhaps you can provide a logical explanation of why all adjustments to the Australian data create or increase a warming trend? .5 degree cooling trends become 1 degree warming trends. How?
Please also explain why meteorologists are becoming increasingly incompetent. When we look at aggregate adjustments we see that the only period not needing much adjustments were the 1980s. Since then readings have required increasing amounts of adjustment so logically, the meteorologists are becoming increasingly incompetent. Why?
So Nick, the “average temperature” for Victoria cuts across alpine areas, desert areas, coastal areas, and built-up urban areas.
What’s the ideal temp for each of these climatic zones?
No Nick. the BOM cut off the years before 1910.
Here is the picture of the warmest years being before 1920. So it is NOT getting warmer:
https://realclimatescience.com/2019/09/why-bom-hides-temperatures-before-1910/
So Tony Heller says the BoM hides Bathurst Gaol data before 1910? So where do you think he gets his data?
BoM!
Of course, the main thing about that pre-1910 Bathurst data is that they did not have a Stevenson screen, so it is influenced by radiant heat.
You would need to provide proof of that. I wouldn’t rely on –
https://cawcr.gov.au/technical-reports/CTR_049.pdf
Because all of their stations are either 1910 or later. 😉
Bourke had a Stevenson Screen in 1909, although the above reference says 1910.
“Since the installation of the Stevenson Screen, which is the universally accepted
cover for recording shade temperature, the highest reading is 125 degrees at Bourke, recorded on January 3, 1909.”
https://trove.nla.gov.au/newspaper/article/160501106?searchTerm=bathurst%20AND%20%22stevenson%20screen%22&searchLimits=exactPhrase=stevenson+screen|||anyWords|||notWords|||requestHandler|||dateFrom|||dateTo|||sortby
Same old spin, going nowhere.
Belief and sophistry overrule.
Nonsense.
“Bourke had a Stevenson Screen in 1909”
The background here is that Australia federated in 1901, but the Met Bureau became operational about 1908. Before that, each colony had its system. Remembering that records in those days mostly consisted of rooms full of handwritten logs, the upshot was that BoM doesn’t have very consistent records of measurement methods before 1908. Hence the use of a quality record starting 1910.
The fact that Bourke had a Stevenson screen by 1909 does not give confidence in the pre-1910 record, especially one (Bathurst) that goes back to 1856.
NS, “Hence the use of a quality record starting 1910.”
Why then if this was all quality controlled do we have the ACORN series of adjustments? Was their quality that lacking? And for statistical purposes? Although Mosh said if they were 8C higher they should adjust them.
Nick: Does not matter. ALL data that does not have the ORIGINAL and adjusted data, description of changes, etc MUST BE DISCARDED. NO adjusting. NONE. ONLY the raw data. Any altered data must be part of paper on why and how statistical adjustments are made to existing data, especially why they are made over and over again. Databases MUST be pure.
ALL DATA MUST BE PRESENTED UNADJUSTED (or with the adjusted data included and clearly marked) OR IT’S NOT SCIENCE. Adjusted data is NOT SCIENCE.
Now, go back to your faith-based adjusted lies and leave the science to scientists.
I agree with Sheri. Data is nothing without context. Any adjustment has to be explained and the original data has to be preserved, or it becomes just an interpretation of data and no longer valid for broad scientific use.
Interpretations can (and often are) wrong. One must be able to understand and challenge adjustments to original data or the mistakes just become part of a belief system outside of science.
Shame on people hiding original data and refusing to explain the changes, nor keep rigorous logs of changes. Note I did NOT call them scientists.
SOME did not have a Stevenson screen before 1910.
Yes, Nick, I know where Tony gets his data from. It was pointed out that they “hide” the data before 1910.
In some stations they adjust the data cooling the temperatures in the past to “create” warming. Most of Australis has NOT shown significant warming.
Adjusting temperatures is nothing new for NASA/NOAA:
https://realclimatescience.com/61-fake-data/
Hi Nick, thanks for the reply. I’m sure you know about averages, they lose a good deal of the information. For instance, the average of 49 and 51 is 50 and so is the average of 1 and 99. Two very different data sets same average. Here’s a cute illustration: “Beware of averages. The average person has one breast and one testicle.” Dixie Lee Ray
But you are right, average global temperatures a up about a degree since the 19th century. But as the IPCC
IPCC AR4 Report Chapter 10 Executive Summary under Extremes page 750
says:
Almost everywhere, daily minimum temperatures are
projected to increase faster than daily maximum temperatures,
leading to a decrease in diurnal temperature range.
That’s a bit different than average temperatures. You know when government funded scientists find the average station temperature for the day, then find the average station temperature for the year and take all the annual station averages from the equator to the poles winter spring summer and fall and compute the annual global temperature and claim it means something as in this case, causing all those bush fires in Australia.
Exactly my point about averages totally meaningless.
Nick, why does the graph begin in 1910 when the temperature record goes back to the nineteenth century? Is it because prior years were much hotter and then declined, so that 1910 was actually a low point? Is that the reason?
Nick Stokes January 4, 2020 at 3:19 pm
Here is the average maximum temperature graph in Victoria.
It’s getting warmer.
That’s for the whole year not just summer and the fire season. Figure 1 is (Mean Maximum Summer Temperatures)
If you want to measure how hot it got, you should measure how hot it got, not take the average of winter and summer.
Which years did AuBom switch from mercury to digital measurements?
Black Thursday, February 6th. 1851
The Black Thursday bushfires were the largest ever recorded in Australia, and were caused in part by an intense drought that had occurred throughout 1850.
Approximately 5 million hectares, or a quarter of Victoria, was burnt. Twelve human lives were lost, along with one million sheep, thousands of cattle and countless native animals.
I see that I missed that Nick said Average MAXIMUM temperature. Duh!
On our news channels here in North America the Catastrophic Spin is more heated than the Australian Fires.
Pure heart tugging tragedy,no criticism nor logic permitted.
Perhaps it is time to read that great poem,”We are doomed cried Hallaran”.
I am impressed by our media party marching in lockstep with the Gang greens,blaming and shaming the Australian PM for conditions outside his time and control.
That fire fuel grew on Gang Greens watch,people like the rabid environmental Ozzie Senators need slapped upside the head.
I love the way our progressive comrades cast blame,projecting their crimes onto their chosen scapegoats.
John,
The poem you refer to is “ Said Hanrahan”by Australian Bush poet John O’Brien the pen name of Catholic priest John Hartigan.
It was published in 1921 in the anthology “ Around the Booree Log and other verses”.
Americans will understand its significance if I say that it was as famous at one time in Australia as “ Casey at the Bat”.
The poem describes the recurrent natural cycle of floods droughts and bushfires in rural Australia as seen through the eyes of Hanrahan a pessimistic man of Irish descent.
“ We’ll all be rooned said Hanrahan”, an adage extracted from the poem has entered the Australian lexicon.
Unlike Casey of Mudville, all ends well with the arrival of the rains to confound Hanrahan.
A great piece of Australian poetry ( even if some cynics regard it as doggerel!)
Thanks Herbert,memory gets “better” every year.
https://www.youtube.com/watch?v=0lR7pDPy1PI
Nicely read over on the Tube 🙂
Here it is as text
https://en.m.wikipedia.org/wiki/Said_Hanrahan
thanks for the ref as it is not as famous as dorothea mckellar I love my sunburnt country, i wasn’t aware of it, but it makes the same insights
Any aussies here know of any other works of this nature?
Tonyb
The ABC Australia in reporting on the present bush fires, every second word seems to be “” Catostrophic “”
I also note that the map of the whole of Australia is frequently blood red.
I also suspect that some of the video cameras are using a yellow filter.
Between the “” ABC and the BOM”” we are being fed “”Fake News””
MJE VK5ELL
“I also note that the map of the whole of Australia is frequently blood red.”
Most of Australia is a desert and it’s summer. It’s the green strip around the edge that is where people live.
It’s all a game of ‘smoke’ and mirrors/
As I look outside now it looks like there is a yellow filter.
And I am in NZ.
We have had some very strange light the last few days.
There is nothing strange about it. The sun sets in the west and currently there are huge volumes of soot and ash entering the high atmosphere and you will see spectacular sunsets because of it. Just like when volcanoes erupt.
As Patrick MJD said, there is nothing strange about it. I have awesome pictures of the red suns and brilliant sunsets from when Yellowstone burned in 1988. One can quite accurately say if there are large fires by the blood red in the sun after it rises. It’s not strange. IT’S NATURAL. (In photography, I never use a filter. Even then, the camera cannot show what the eye sees. Red suns are much harder to photograph with digital, which may mean it’s not filtering, but crappy photography geared to the iPhone masses that create the false coloring or the intense but wrong coloring.)
In New England history there are some great old tales of “Dark Days”, apparently caused by tremendous forest fires in the west of the USA and Canada, back before those lands were settled or timber was harvested. In one episode “the sun turned blue at noon” in Boston. In another, back in the 1600’s, the day dawned bright and sunny and then grew darker and darker during the mid-morning, without any obvious clouds. Apparently the farmers and their wives freaked out, and everyone hustled to church. They had to use candles at noon. When it was sunny the next day they must have decided all their prayers were highly effective, and got back to work.
Seems to me those old timers got over their frights a lot faster than modern snowflakes do.
yeah I reckon they managed 50 unprecedenteds and as many catastrophics in a half hr report, abc unparallelled hysterics
everyone i know who tired to get news via the media got pissed off n turned it off due to the fearmongering and lack of cold hard factual reporting
ie decent maps of exactly where was burning without the hype.
Also, On ABC 24 they had a background of deep red (filter) with computer generated embers floating around for good measure.
Just stepping away from the pandemic of temperature records diddling for a moment, how do the climate hand-wringers think that Australia got to be virtually a monoculture of fire-dependent eucalyptus trees?
Maybe a new tax on rural land will arrest the spread of eucalypts across Oz?
(Oh c’mon – that makes just as much sense as a tax to reduce CO2 in the atmosphere 🙂 )
Forests burn naturally and this is part of their cycle.
If humans want to live near forests, the forests have to managed to stop catastrophic fires near habitation.
Of course, legions of galactically stupid greens have banned proper forest management, including the clearing of brush and preservation firebreaks both in Australia and in California.
Naturally, these fires have nothing to do with greenie management but everything to do with an insignificant rise in temperature.
There is no relation between temperaure and fire, only betwenn draught and fire.
And yes, pyrophytes prove, fire is natural in regions where they grow.
Yes of course. Forest fire season here in North America peaks in December, January, and February!
“The summer of 1938-1939 was probably the hottest ever in recorded history for the states of New South Wales and Victoria.”
Based on one data point at one station on a graph that ends 20 years ago? Doesn’t even pass the stink test.
Temperatures have be rising steeply for 70 years, to say otherwise is disingenuous, now at more than 2C/century and accelerating. https://www.eldersweather.com.au/news/australias-driest-and-hottest-year-on-record/530813
Yeah, increasing according to the joke of an ACORN dataset…which you provided for the whole of the continent and with annual data. NSW and Victoria are less than 20% of the continent, and the summer months are 25% of the year. Talk about “disingenuous.”
Loydo, just to help you round out your education a little (maybe a lot??), here is a rich resource you can use to quell your anxiety about how Australia’s landscape has weathered nature since civilization there started being recorded –
https://trove.nla.gov.au/newspaper/?q=
You’re welcome 🙂
No Loydo, you are wrong as usual:
https://realclimatescience.com/2019/09/why-bom-hides-temperatures-before-1910/
And more reading for Loydo:
https://realclimatescience.com/2019/12/record-heat-in-australia/
NOT ONE POINT, Loydo, BUT MANY STATIONS.
It is not one point at one station. But do not expect Loydo to figure that out.
My apologies Mr. Rotter and Ms. Marohasy, but I skipped the squabbling about temperature records and went straight to the gold nuggets in this essay: the series of posts by David Ward at jennifermarohasy.com linked to in the last line above.
David Ward’s discussions regarding anthropogenic fire in the Oz Bush are excellent, informative, and fair dinkum defo (definitely right).
Before Europeans arrived, Noongar people managed our south-west dry forests and woodlands very well without fire trucks, water bombers, helicopters, television journalists, concerned politicians, the Conservation Council, hundreds of firefighters, or the Salvation Army to give them all breakfast. They did this by burning frequently, in most places as often as it would carry a mild, creeping fire.
If you care about wildland fire in Australia or here, I strongly recommend reading Mr. Ward’s commentaries.
IMHO, indigenous burning is a past practice that cannot be exactly replicated today, but it can be mimicked using modern technologies. The point is that something like frequent restorative patch burning across landscapes is necessary to prevent infrequent hugely destructive mega fires — regardless of the temperature, whatever it is or was.
The difference is that today Australia is being displaced with fast growing weed species. A super continent of highly inflammable, super fast growing weeds.
Fire is the perfect opportunity to do follow up weeding. In my experience with bush regeneration, a controlled burn by CFA was gold and made our work effortless. After the burn, a mere weed wand is all that was required to apply herbicide to blackberry shoots coming up out of the charcoal.
The media has done everything possible in the last couple of years to confirm that they are the fake news.
Both my father and mother told me of the horrible fires and heat in Victoria and NSW in the late 30s, with my mum complaining that the skies over Sydney were always filled with smoke from Christmas until Easter in 1939. She said her family gave up roaming the outback in the late 30s due to the drought and dropped her off with family in Sydney (she would have been 10).
My dad spoke of the controlled burns his father did in and around the farms they had between Ballarat, Bendigo and Echuca in June 1938, which got his father into disputes with the authorities (he was fined), though it saved the farm and outbuildings because he would not allow any bush or brush within 100 yards of the buildings. He said his family lost many animals when the flames leaped the roads, jumping from gum tree to gum tree and igniting the pasture near Bendigo.
Loydo says to tell you that your mother was lying.
Homogenisation solves the temperature measurement problems.
Why do you only quote one weather station?
The current fire season easilyt eclipses the 1939 season and it is a long way from finished.
“Simon January 4, 2020 at 3:08 pm
Homogenisation solves the temperature measurement problems.”
The problem being there is nothing unusual about temperatures in Australia, or even globally. That’s why they need adjusting, or “Homogenisation” and once that is done, measurements don’t matter anymore.
Simon: “Homogenisation solves the temperature measurement problems.
Why do you only quote one weather station?
The current fire season easilyt eclipses the 1939 season and it is a long way from finished.”
It is naive to think that homogenisation solves temperature measurement problems. It simply converts real data to meaningless propaganda. If you look at the historical data, resiting a weather station by a few hundred metres can produce a variation of more than a degree. Changing the elevation of a station by a few metres can also have dramatic consequences. The notion that homogenisation can produce meaningful data over hundreds of thousands of square kilometres is at best fanciful.
“But just 10 years ago, on 9 February 2009, 173 lives were lost in the Black Saturday inferno. On 13th January 1939 (Black Friday), 2 million hectares burnt with ash reportedly falling on New Zealand. That was probably the worst bushfire catastrophe in Australia’s modern recorded history in terms of area burnt “
Not at all. According to Wiki:
“The 2019–20 Australian bushfire season has burned an estimated 6,300,000 hectares (16,000,000 acres; 63,000 km2; 24,000 sq mi),”
And it is only the start of January.
Do I understand that you are comparing a single fire with an entire season?
Black Friday was not a single fire. Nor was the damage confined to a single day.
When the police think almost all of the fires were arson…or man made/started
…you can not compare one fire season to another…ever
no two will ever be the same….and none of them are an indication of anything at all
“When the police think almost all of the fires were arson”
No, they don’t.
Australian Police Say Arsonists & Lightning to Blame For Bushfires, Not Climate Change
Authorities in Australia are working on the premise that arsonists and lightning strikes are to blame for bushfires that have devastated numerous areas of the country, not “climate change” as many global warming alarmists have claimed.
However, according to those tasked with investigating the fires, climate change has nothing to do with it.
https://summit.news/2020/01/03/australian-police-say-arsonists-lightning-to-blame-for-bushfires-not-climate-change/
Police close in on suspected fire arsonists
18/12/2019|1min
NSW Police could soon charge more than a dozen suspected arsonists allegedly responsible for deliberately lighting bushfires across the state.
At least 56 people have already been charged or cautioned with 71 bushfire-related offences since August.
There are 16 investigations underway into suspicious fires, amid one of the state’s worst bushfire crises.
https://www.skynews.com.au/details/_6116577785001
Arson, mischief and recklessness: 87 per cent of fires are man-made
https://www.smh.com.au/national/arson-mischief-and-recklessness-87-per-cent-of-fires-are-man-made-20191117-p53bcl.html
Three teenage girls have been arrested for arson over 13 grassfires police allege were deliberately lit on the New South Wales mid-north coast.
http://thedailychrenk.com/2020/01/03/australias-arson-crisis/
19-year-old volunteer fire fighter in Australia has been charged with arson and accused of lighting seven fires in the Bega Valley area, New South Wales.
https://www.telegraph.co.uk/news/2019/11/27/australian-firefighter-accused-arson-record-bush-fires-ultimate/
These are just cranky opinion articles. See if you can find an actual police statement that “the police think almost all of the fires were arson”.
“Prior to 13 January 1939, many fires were already burning. Some of the fires started as early as December 1938, but most of them started in the first week of January 1939. Some of these fires could not be extinguished. Others were left unattended or, as Judge Stretton wrote, the fires were allowed to burn “under control”, as it was falsely and dangerously called. Most of the fires, Stretton declared, with almost biblical gravity, were lit by the “hand of man”.[3][4]”
most of the fires were arson……or man made/started
https://en.wikipedia.org/wiki/Black_Friday_bushfires
That is the opinion of a judge in 1939!
“These are just cranky opinion articles. See if you can find an actual police statement that “the police think almost all of the fires were arson”.”
Nick, that’s the news stations reporting what the police have told them.
56 people have been charges already…the police are about to charge 12 more…and there are 16 investigations directed at even more people
your cranky opinion articles..are the news reporting what the police told them
sorry it’s not climate change….it just pain old every day arson
2009, 173 dead.
Black Friday 1939 71 dead and several towns destroyed.
Yet Nick measures disasters by area of bushland burned. Nice.
“Yet Nick measures disasters by area of bushland burned”
I was answering (and quoted) Jennifer’s explicit claim
“That was probably the worst bushfire catastrophe in Australia’s modern recorded history in terms of area burnt”
He (Nick) is just a master of conformation bias and no matter how many facts you present he will keep troling away.
You can’t compare fires by number of deaths. We have far better warning, fire-fighting, and transportation systems these days. The 1939 and 2009 fires were far smaller with 2019-20 and we’re a long way from finished.
As Black Thursday was not a single fire. Nor was the damage confined to a single day.
http://romseyaustralia.com/fire1851.html
The 1851 fires may have been less destructive than the current fires, mainly because there were fewer people living in forested areas, but the weather conditions in 1851 were broadly similar to current conditions.
The 1939 figure was for one single day and in Victoria only.
So there has been many years of fuel build-up, and another fire.
Until the fuel is reduced, expect bigger fires.
We are in the Era of MegaFires (EOM).
Get out of the way.
Black Friday was Victoria only not the whole of Australia.
“ On 13th January 1939 (Black Friday), 2 million hectares burnt with ash reportedly falling on New Zealand. That was probably the worst bushfire catastrophe in Australia’s modern recorded history in terms of area burnt “
https://en.wikipedia.org/wiki/Black_Friday_bushfires
:The Black Friday bushfires of 13 January 1939, in Victoria, Australia, were among the worst natural bushfires (wildfires) in the world. Almost 20,000 km2 (4,942,000 acres, 2,000,000 ha) of land was burned, 71 people died, several towns were entirely obliterated and the Royal Commission that resulted from it led to major changes in forest management. Over 1,300 homes and 69 sawmills were burned, and 3,700 buildings were destroyed. It was calculated that three-quarters of the State of Victoria was directly or indirectly affected by the disaster. The Royal Commission noted that “it appeared the whole State was alight on Friday, 13 January 1939”.[1]
This was for the state of Victoria only NOT the whole of Australia.
Nick
https://en.wikipedia.org/wiki/Black_Friday_bushfires
If I understood well, the 2,000,000 hectares burned in January 1939 in a much shorter time than those burning since beginning of October last year.
Right?
That of course doesn’t change a bit to the situation Australia experiences right now.
And conversely, I wouldn’t like to be in Djakarta these days…
Best regards,
J.-P. in a currently supermild Germany, free of ice, flood and… bush fires
“the 2,000,000 hectares burned in January 1939 in a much shorter time”
Yes, the fire in Jan 1939 was more intense. But Jennifer’s explicit claim was:
“That was probably the worst bushfire catastrophe in Australia’s modern recorded history in terms of area burnt”
Specifically area burnt, not intensity. 2 million Ha in Jan 1939 was pretty much it for the summer, and for the whole country. This is something else.
Another cranky opinion post by NS.
Nick has a comprehension problem again. The 2 million hectares was ONE DAY.
Good on you Jennifer, keep up your great work.
I recall, as a young boy in the early 60’s, steeping out of an air-conditioned train on to the platform at Cloncurry Railway Station. I don’t know what the official temperature (over 100F) was but I could not breath. Arriving at Mt Isa, a couple of hours later, it was still so hot and the air so thin and dry, for a kid used to southern climates, it was like hell. Hot as hell for days on end. Gradually I got used to it to the point that on a reverse trip some 10 years later, I got out of an air-conditioned bus at Melbourne. Again I could not breath it was so hot (less than 90F) and the air so thick and humid. Then the temperature dropped suddenly and it was cold and wet. I did not have a long sleeve shirt let alone a thick woolly jumper.
Climate change – hah, change of climate – certainly.
A a layman in these matters I share your skepticism of how BoM is managing the official records. If the old systems were no good either throw out the old figures or keep them but start again with new instuments. Where there is a difference declare it. Comparing new data to old data is difficult enough, but to adjust the old data and then use the adjusted data to declare trends seems very wrong to me.
Speaking about how humans can deal with “climate change”, I recall collecting a niece at Brisbane airport from a flight from London at Xmas back in the ’70s.
She descended from the airplane stairs wearing a heavy woolen coat, and nearly collapsed at the bottom in 34C and ~70% humidity.
She took a week to acclimatize, but did.
The photo at the top is a reminder:
While fires are burning it is hard to know what is going on. So we see maps with big splotches of red.
But not everything within those red areas burn.
Send in a team and determine how much and how seriously the terrain is damaged.
After fire-audits are often done.
The U.S. Forest Service does this on a regular basis. The results come a year after the fire so the MSM don’t notice. Those that look at these audits are surprised at how much is not burned and how quickly much of the rest regrows.
A case of confirmation bias?
https://tambonthongchai.com/2018/08/03/confirmationbias/
It reached 63c at Cabramurra NSW yesterday according to the official observations. I hope the BoM scrub that from the record! If you look at the ‘hour by hour’ readings, it was 32c for much of the day, but a bushfire went through the town just after midday which resulted in the temperature rising 30c over the course of an hour. As an aside, it just shows how even radiant heat from a bushfire can kill you.
It is important to note, that forest management has changed considerably in Australia since ~1980s, making any temperature changes minor in comparison.
I have never seen a graph of the relative change in logged versus conservation areas in Australia, but I can tell you very large areas which were previously logged and periodically thinned are now under conservation. I know this because I was directly involved in advising government of areas recommended for transfer to conservation estate, during a number of Regional Forest Assessments in the 1990s-2000s in eastern Australia.
The change from periodic logging and thinning to conservation in many areas has changed the fire regime in Australia. Some forested areas in the 1800s were specifically set aside as ‘timber reserves’ for townships, nobody back then imagined that these would later be unable to be touched or cleared and become tinderboxes to then turn burn down the adjacent towns.
Farmers and landowners were able to clear vegetation build up adjacent to their farms, this is no longer the case. The forest and undergrowth naturally expands every year, which is also why people in the Amazon and many tropical and warm temperature areas annually set fire to areas marginal to forest; it not only reduces wildfires, it protects their property from the encroaching forest and allows better grazing and cropping. When I asked people in Indonesia why they burn away the undergrowth on their property every year they said it is to stop the rainforest expanding, allow better grazing for animals, and to promote regrowth for cropping and grazing. Australia’s archaic and quaint anti clearing laws do not allow for any of this.
A change in land clearing laws is needed, along with buffer zones of 1-2km adjacent to farms and townships, much as the original settlers realised.
If you are interested in seeing the temperature for the hottest month, for every 5 x 5 latitude-longitude cell, then have a look at this coloured map:
https://agree-to-disagree.com/rats-average-daily-high-for-the-hottest-month
The temperature for the hottest month is the average daily high for the hottest month.
Notice how India, the Middle East, and northern Africa, get hotter than Australia.
Also, if you are interested, you can see the Winter-Summer temperature difference for every 5 x 5 latitude-longitude cell, on this coloured map:
https://agree-to-disagree.com/rats-winter-summer-temperature-difference
Have a look at the Winter-Summer temperature difference for Britain, compared to other countries at that latitude. The Gulf Stream stops Britain getting cold in Winter, and hot in Summer.
Actually the scientifically sound strategy is to increase the measurement error around the original measure if you have estimates that it may be different, based on additional data (though I would hesitate to call some of the extrapolations “data”). But that would reveal just how much uncertainty is involved in estimating (not measuring, as only local data is measured) aggregated temperatures (eg Melbourne, Victoria, the globe). It is pretty clear that measurement theory is not part of the “environmental science” curriculum.
“The historical evidence, however, indicates fires have burnt very large areas before, and it has been hotter.
1939 2 million hectares. Today? 6 million.
A good skeptical piece on WUWT would site the data, the sources, and the methods.
has it been hotter? definitely? err Nope. much harder to tell as there is some debate ( no settled truth) about some past DAILY temperatures. Basically if you look at daily data you are asking for trouble.
Steve, recorded max temps for each day can be very fleeting events.
Take a look at Cliff Mass blog today about a ~ 2 hour spike in NW USA region as a warm front came through – av temp rising from ~ 1C to up to 16C in some locations, but only for a 2 hour duration.
If this happened in Oz, the BoM would post 16C as the days’s max temp, and that would thereafter be used in all future comparisons. Even though for most of that day, the prevailing max temp was ~1C.
Bullsh1t pervades the climate capers.
**1939 2 million hectares. Today? 6 million.**
So what does that mean Steve?
Be specific. What time period id each? You are not reading.
edit
–
has it been hotter?
definitely?
Yep.
–
Not hard to tell as there are lots of past DAILY temperatures.
Basically if you look at daily data you will find thousands of hotter days in the past.
–
Widespread bushfires occurred in Victoria in early February 1851. The height of the destruction happened on Black Thursday, 6 February 1851. ‘Fires covered a quarter of what is now Victoria (approximately 5 million hectares).
Note, very hot over all that fire season in Australia and this was only in Victoria in one day.
In modern times in one day.
On 13th January 1939 (Black Friday), 2 million hectares burnt with ash reportedly falling on New Zealand.”
–
“The historical evidence, however, indicates fires have burnt very large areas before, and it has been hotter”.
–
Steven Mosher denies this
1939 2 million hectares. Today? 6 million.
–
“The 2019–20 Australian bushfire season has burned an estimated 6.3 million hectares (16 million acres; 63,000 square kilometres; [3.9 million from September 2019 to December 31 2019] The bushfires are regarded by some as one of the worst bushfire seasons in memory”
– So , not the worst
– So comparing a bushfire season to a single bushfire.
6 months to 1 day.
By a man who knows these facts and chooses to present them in this callous disregard
of truth and fairness.
To denigrate and deny the historical record..
Expected but scientifically sad.
–
This season has some time to go and it might end up as our worst recordable season for area lost but it has a way to go yet.
Misdirection and comparing an apple to watermelons is not science.
As of 1 January 2020, 3.6 million hectares (8.9 million acres) has been burnt [NSW]
Most of the area burnt was last year at the start of the fire season.
–
Using the same blatant misdirection as Nick Stokes.
The fire season and areas burnt are recorded for the fire season starting usually around September October of the preceding year.
Mr Mosher deliberately conflates the hectares burnt in late 2019 with those of 2020 for his figure of 6 million hectares when Today
rt
You could add that if you let fuel loads get that high, you get what you deserve.
Giglio et al 2013 created a global fire database based on MODIS data. https://doi.org/10.1002/jgrg.20042
According to the study the area burned in Australia and New Zealand during the years 1996 and 2011 was between 16.3 Mha (2010) and 83.2Mha (2011).
The area burned this season (ca 6 Mha) seems small on that context.
Those figures are useless when talking about forest fires. As the paper says:
“In terms of area burned, savanna fires were overwhelmingly dominant in both SH and NH Africa (90% and 82% of the total area burned, respectively) and somewhat less so in SH South America (65%).”
…
” Shrubland burning comprised a relatively small proportion of the area burned in all regions except Australia, where 37% of the area burned belonged to this category.”
Huge areas burn on the fringes of the tropical North after each wet season. There are also from time to time very large fires in semi-arid to arid land in inland NSW and Qld, again burning off growth from unusually wet seasons.
Most of the fires in Australia are bushfires and directly comparable to what is dicussed in that paper.
Nick Stokes January 5, 2020 at 12:48 am
“Those figures are useless when talking about forest fires”
–
Caught with your pants down you try to change from bushfires, the subject, to forest fires only.
“We have had an horrific start to the bushfire season,”
Not the “forest” fire season.
–
You are loose with your facts, inconsistent with your arguments
–
You quite happily claimed 6.3 million hectares of bushfire area over 5 months and then turn around to say you were only talking about “forest”fires.
–
You are a disgrace.
It is one thing to be a clever dickhead and try to win a debate on style and misdirection and fact misrepresentation.
It is another to try to debate honestly with the full and correct facts presented and compared.
–
No matter. One thing we all learn in life is that when we knowingly deceive ourselves and other people the fact that we have done so stays on and builds up.
You believe in your greater cause but deep down you know every time you are being clever, as you call it in your mind to disguise what it really is, you dig yourself deeper into the mire of consciousness.
Good luck with that.
–
Steven Mosher
“The historical evidence, however, indicates fires have burnt very large areas before, and it has been hotter.
1939 2 million hectares. Today? 6 million.
–
Baloney. Try 1975, Australia fire season 117 MILLION HECTARES, 44 million hectares in the Northern Territory alone.
–
“1975, the worst bushfire system the nation had faced in 30 years. Although there were just three deaths and about 100 injuries attributed to the fires, the Australian Institute for Disaster Resilience estimates about 15 per cent of Australia’s physical landmass, about 117 million hectares, had extensive fire damage.
–
Of course it was probably even bigger in the 1850-51 season Australia wise when 5 million hectares went up in only 1 day.
“Widespread bushfires occurred in Victoria in early February 1851. The height of the destruction happened on Black Thursday, 6 February 1851.’Fires covered a quarter of what is now Victoria (approximately 5 million hectares).”
–
Why do you do it?
Mislead purposely.
It should be beneath you.-
For general information Steve is deliberately comparing a 1 day figure in 1939 with what he knows is a current season long figure, 2019 -2012 fire season of 6.3 million hectares.
To make another wrong claim about historical data.
–
Worse he knows he is comparing seasons with days.
The proper figure for the 1938-39 season was possibly bigger than the current 2019-2020 figure.
-As for hotter
“The weather reached record extremes. By eleven it was about 47 °C (117 °F) in the shade. The air cooled to 43 °C (109 °F) by one o’clock and rose to 45 °C (113 °F) around four o’clock.
The intense heat could be felt 32 km (20 mi) out to sea where a ship came under burning ember attack and was covered in cinders and dust”
–
But nothing will save the Governor General.
–
Nick Stokes “the 2,000,000 hectares burned in January 1939 in a much shorter time”
Yes, the fire in Jan 1939 was more intense. But Jennifer’s explicit claim was:“That was probably the worst bushfire catastrophe in Australia’s modern recorded history in terms of area burnt”
Specifically area burnt, not intensity. 2 million Ha in Jan 1939 was pretty much it for the summer, and for the whole country. This is something else.-
–
First the misdirection.
Comparing a single month in 1939 to a whole fire season 2019-2020
The 1939 fire was part of the 1938-39 fire season.
Nick carefully avoids mentioning all the area burnt from September 1938 to Jan 1939 and what burnt after til April 1939.
Though I am sure he knows.
“Nick carefully avoids mentioning all the area burnt from September 1938 to Jan 1939 and what burnt after til April 1939.”
So what was it? Do you know of any other fire season in which over 6 million hectares of forest were burnt? I’m sure 1939 was not one of them.
According the Giglio et al mentioned above, every single season has more burned area than 6 million hectares.
For Nick.
–
“Largest fires recorded in the Australian Alps burnt 3.4 million ha in a continuous swathe between-Melbourne and Canberra killing 71 people in Victoria and destroying countless homes and entire towns. Although the fires burnt over the period of September through to March, the vast majority of country was burnt between 8 and 14 January 1939. ‘Black Friday’ (13th) saw most of the impact in Victoria, whereas the fire spread nearly 70 km in NSW the next day destroying several homes but taking no lives”
–
so much for the line ” 2 million Ha in Jan 1939 was pretty much it for the summer, and for the whole country.”
–
That was only Melbourne to Canberra. Who knows what happened in Northern and mid NSW and QLD as well in such a high fire season.
Let alone the “whole country”.
Just shameful.
Shameful misdirection.
From another who knows the true facts much better than most people.
“Evidence given to the NSW Parliament’s inquiry into the 2001 bushfires indicated that in 2000, NSW State Forests conducted hazard reduction burns across 100,000 hectares of the 2.8 million hectares it managed, in contrast to NSW National Parks and Wildlife Service’s (NPWS) 19,000 hectares of the 5.3 million hectares it managed. NSW State Forests lost 2,000 hectares by the bushfires in comparison to the 750,000 hectares of NPWS-managed land destroyed. “
Twenty years ago.
Prescient
Twenty years ago and we STILL haven’t learnt the lesson.
In 1974 about 29,000,000 hectares were burned in the Kalgoorlie fires.
In 2003 over 15,000,000 hectares were burned in WA – primarily from the Goldfields to down along the South Coast and in the Kimberley. From memory the flame front was about 1,500 km long at one point – from Sandstone to Cape Arid.
Yes, very large areas are burnt in savannah and scrub fires. This has nothing to do with forest fires, which are far more dangerous and of lasting effect.
1850-51 probable
1938-39 possible
1973/74 most likely 117 million hectares might include a little forest
are all possible.
NB the current fire season 2019-2020 has NOT burnt over 6 million hectares of forest as you well know.
A lot is forest and a lot is bush and scrubs.
Stop making up things.
Mr Stokes..
You have obviously never faced a running grass fire in heavy fuels on a bad day.
Any fire in heavy dry fuels on a bad day has an intensity and rate f spread that we cannot counter.
The real difference is that we typically get grass-fired under control on the first night because we can access them as soon as conditions moderate. Forest fires are often permitted to burn for days -sometimes weeks – because we cannot get immediate access as soon as this happens.
This failure to extinguish early under moderate conditions was identified by the McLeod Inquiry as the probable reason why the 2003 Canberra fires killed 4 people and destroyed 500 homes.
Low fuels, good fire-trails and significant firebreak make this possible.
Incidentally, the western half of NSW has less than 2% of the state’s fires, today. If you are going to blame “Climate Change”, explain to us why there is no Climate Change west of Dubbo. If hot and dry conditions are the most important factors, explain to us why there are fewer big fires where it is ALWAYS hotter and ALWAYS drier.
Hysteria over nature is common. That’s how we got rainmakers in the Old West (true believers, you can cash in on this today—people are too stupid to know or remember that humans don’t control the weather), sacrifices to gods for fair weather, etc. It’s just the Climate Cult’s sacrifices are human beings dying due to the stupid and cruel “solutions” proposed, the excuse of “global warming” to allow the government to kill via flooding and fire, and the intense hatred of humanity by this cult. It’s not new. Millions have died in allegiance to cults and always will. Humans really hate themselves. We have no “cure” for this and the destruction of the cult depends on the power and money invested. The Climate Cult has tons of money, owns the media, owns education and has bullying power everywhere. So expect millions, if not billions of deaths, at the hands of those who preach humans can control the weather. Another killer cult, another day in history. Nothing new.
I live on the NZ Nth Island west coast
I remember as a boy that it rained dry ash at our farm when I was a boy. If I held my hand out for a period of time some would settle in my palm. I was told that it was from Australia. I cannot remember the year though it was probably within the period 1960 – 1970
A combination of factors influence fire susceptibility and impact:
– A dry period
– Wind
– Heat
– The degree of infrastructure development and human activity
Like elsewhere in Australasia there has been a rapid increase in small rural lifestyle blocks where urban workers like to have some land. Aussies like to build among trees to provide shade. This increases both susceptibility and spark potential
Once it gets above 35 C (very common in Aus) a few degrees here or there is not going to make much difference IMO
Cheers
M
So, to be clear, Jennifer Marohasy is saying that, based on raw data from one location and ignoring the last 20 years of data, the hottest summer in Australia was probably 89 years ago?
Mmm, doesn’t seem to be a convincing argument.
Try actually reading it.
Your need to misrepresent Jennifer’s argument makes your counter look even less convincing.
According the Giglio et al mentioned above, every single season has more burned area than 6 million hectares.
This is off the subect but I need help. Is anyone out there aware if the IPCC has claimed a scientific consensus on CC, or (unlikely) denied it. I am an ex-journalist and I want to prepare an item on this subject. (I wonder if anyone has asked the IPCC its opinion on “the consensus). Any help would be appreciated. Thanks in advance.
Right now (09/01/2020) 98% of the fires in NSW are in the Eastern half. You can draw a line from Moree, through Dubbo and Wagga to Albury. There are 170 fires to the east of that line, and just 2 west of it.
Those wanting to blame Global Warming for these fires, must explain why there is no “Climate Change” west of Dubbo.
The irony doubles when you realise that the west has always been hotter and drier…..
Mr Roberts.
Your need to misreprent Jennifer’s argument tells us everything that we need to know about your inability to support your own.
The last 20 years of raw data is not comparable. It has not been collected according to any recognised international standard, uses data from stations that do not even meet the ABM’s own standards, and has been “adjusted” without valid reasoning or appropriate independent scrutiny.
Therefore YOU are the one ignoring the unreliability of the last 20 years.
So Jennifer prefers to use a subset of raw data to infer something that she has no basis for? If she thinks the data are unreliable, then she can’t make any inference at all. If she prefers the subset of raw data to the whole of the adjusted data, she needs to show why that subset of raw data is a better guide than the adjusted full data set that the BoM uses. Why is it more reliable (even though there are 20 years missing)?
Unlike the US, there are few met stations that have long historical temperature data and if they do the BoM throws out the data as being ‘unreliable’. Here is my graph of 6 rural stations with Summer month record Max temperatures (Dec-Jan-Feb taken from the BoM website records. Year of record at top of columns.
https://postimg.cc/ykQLV4J4
Make your own judgment. Unadjusted BoM, Ann mean Max temp, for Dubbo; Darling Street (1871-1999) & A/P (2000-2018) composite graph. Dubbo is a large (pop 38,000) town central-east rural NSW, 275m asl.
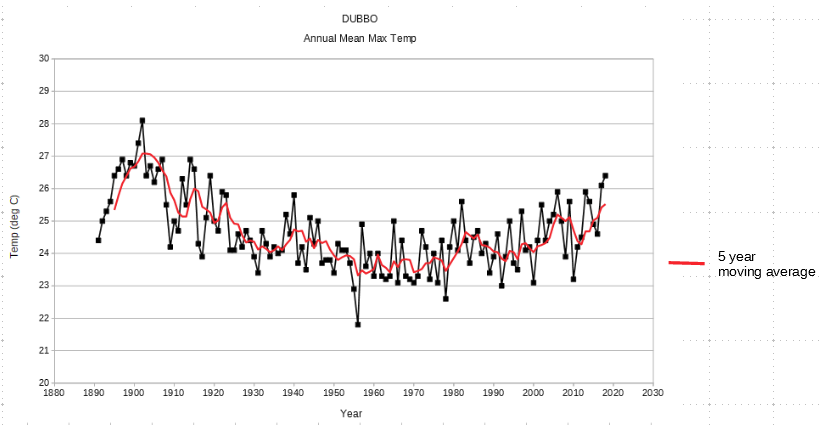
Of course, these temperatures are before adjustments by the BoM for their ACORN homogenized global warming series.