Dr. Tony Phillips writes:
A new solar cycle is coming. Today, two sunspots emerged on the solar disk. Their reversed magnetic polarity marks them as members of new Solar Cycle 25. This quickening of new-cycle solar activity suggests that the sun is not entering a new Maunder Minimum despite the recent scarcity of sunspots.

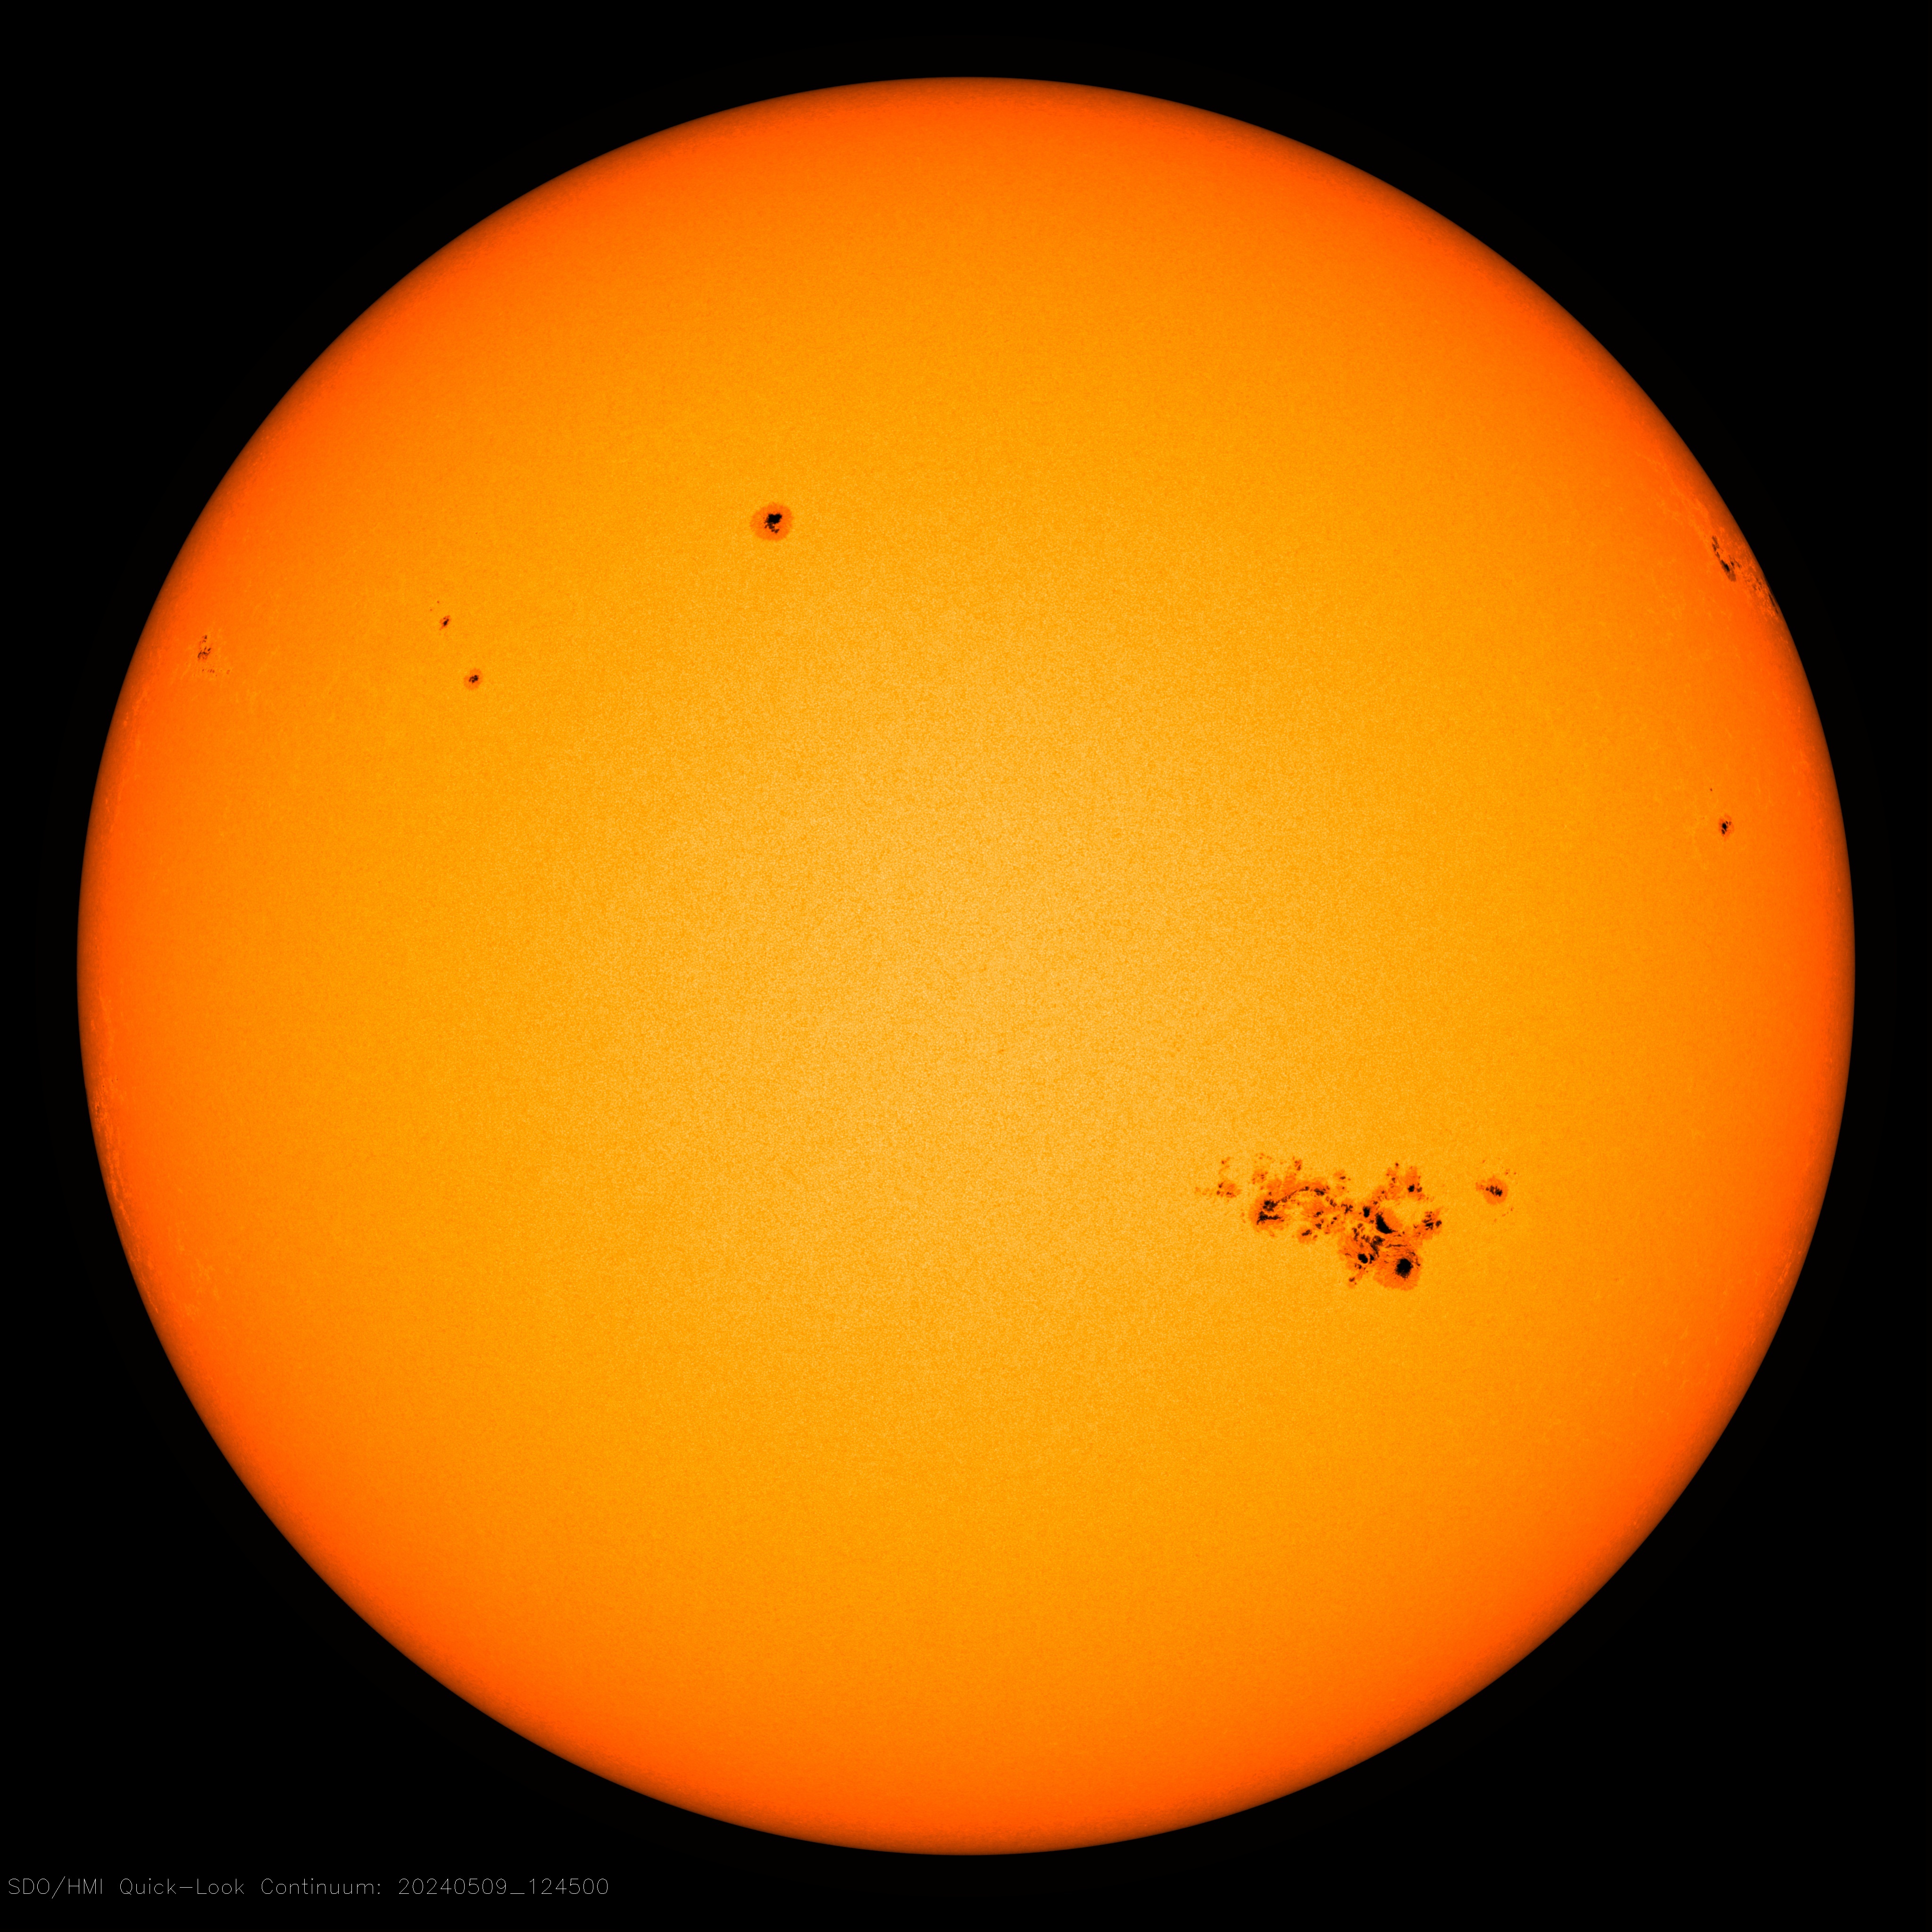
Today, for the first time, there are two new-cycle sunspots on the solar disk–one in each hemisphere. This map of solar magnetic fields from NASA’s Solar Dynamics Observatory shows their location:

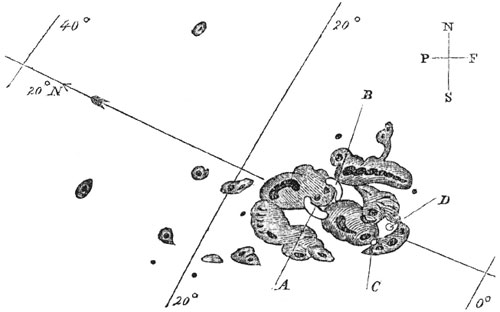
We know these sunspots belong to the next solar cycle because of their magnetic polarity. Simply put, they are backwards. According to Hale’s Law, sunspot polarities flip-flop from one solar cycle to the next. During old Solar Cycle 24, we grew accustomed to sunspots in the sun’s southern hemisphere having a -/+ pattern. However, look at today’s southern sunspot:

It is the opposite: +/-. This identifies it as a member of new Solar Cycle 25.
Likewise, today’s northern sunspot has a reversed polarity compared to northern spots from old Solar Cycle 24. It, too, therefore, belongs to Solar Cycle 25.
The sun is currently in Solar Minimum–the nadir of the 11-year sunspot cycle. It’s a deep Minimum, century-class according to sunspot counts. The scarcity of sunspots has been so remarkable that it has prompted discussion of a possible “extended Minimum” akin to the Maunder Minimum of the 17th century when sunspots were absent for decades. Such an event could have implications for terrestrial climate.
Today’s new-cycle sunspots (along with isolated new-cycle spots earlier this year) suggest that the solar cycle is, in fact, unfolding normally. A new Maunder Minimum does not appear to be in the offing. Forecasters expect Solar Cycle 25 to slowly gain strength in the years ahead and reach a peak in July 2025.
Full story and more at Spaceweather.com
Isn’t it too soon to know?
Unfortunately it is too late:
Well they sure didn’t last very long
makes it new cycle spot number 53., according to
https://solen.info/solar/cycle25_spots.html
so, indeed, cycle 25 is alive and well.
Jan Alvestad is on top of it. SWPC lags some.
SWPC finally gave both regions AR #’s today in their latest synoptic map:
https://www.swpc.noaa.gov/products/solar-synoptic-map
As Solen.info notes:
“12753 and 12754 are the most significant cycle 25 regions to date.”
https://solen.info/solar/index.html
The SH region at S29E56 as now AR 2753 (actually 12753, as they now drop the leading 1; this was Jan’s STAR# S6326 the previous day – 23 December).
The NH region at N26W14 is now AR 2754 (Jan first gave it his STAR designation as S6328).
Jan gave the SH AR 2753 a CRI descriptor.
http://www.solen.info/solar/images/AR_S6326_20191223_2345.png
SWPC gives 2753 and 27554 both a BXO designation.
https://www.swpc.noaa.gov/products/solar-region-summary
Jan Alvestad also gives the SH AR 2753 as capable of C-class Xray flares. Which the SWPC gives at 5% chance. 2753 has already been popping some low-level X-ray sparks in the SWPC GOES Xray plots. This will give the new GOES-16 XRS some comparison to the still operational GOES-15 sensor that has been a workhorse throughout SC24.
https://www.swpc.noaa.gov/products/goes-x-ray-flux
Looks to me like there will some calibration-reconciling issues between older GOES-15 XRS data and the newer, more sensitive GOES-16 XRS. Which one is right?
I’ve been expecting this solar SC25 activity uptick in late December for about 3 weeks now.Mentioned it here:
https://wattsupwiththat.com/2019/12/16/its-official-we-are-in-a-deep-solar-minimum/#comment-2872927
and here:
https://wattsupwiththat.com/2019/12/12/deep-solar-minimum-on-the-verge-of-an-historic-milestone/#comment-2869568
As I noted in my December 16 comment, my timing estimate is slightly off because I assumed too fast a flux tube rise speed. Apparently at minimum they are rising slower (on average), ~120 (±10) m/s vs ~140 (±10) m/s as typical during more active magnetic phase of the cycle. And the Carrington longitude for emergence estimated is very rough due to movement of rising flux tubes through 200 Mm of CZ and the original localization estimate uncertainty of the peak of the deep flux perturbing trigger.
Still the 2753 and 2754 triggers were strong about 3 to 3 1/2 weeks ago, so the current activity should continue on these regions through several Carrington rotations.
Additionally, I am predicting more SC25 NH active region(s) should emerge o/a 3 January 2020 based on a mildly strong trigger in mid-December, with some potential for a synchronous SH AR. And this Northern Hemisphere AR will continue with flaring potential through a solar rotation.
All in all, SC24 is done by my analysis. Still standing by my SC25 start projection as 1 January 2020 based on Southern polar field behavior.. we’ll see though when the dust settles some months from now.
And if you really want a way, way out star flaring forecast, I’ve got one — For June 2020.
Forecast: Proxima Centauri our nearest neighbor – Massive flares from this bad-boy M-class dwarf star, off-the-charts flares – 8 June 2020 (±2 days). (That should be a big clue).
Joel, your prediction was not far off. This SC25 activity is your gift this year.🎄
Successful prediction from a hypothesis is the corner stone of science, even if we do not understand the entirety of the underlying, deeper mechanisms of nature.
My March 2019 prediction was also dead on.
https://wattsupwiththat.com/2019/03/07/declining-solar-activity/#comment-2649814
“Prediction: March 21-22, an SC24 active region will rotate into view and go bgd-magnetic classification and pop-off a few M class flares between 22-27 March.”
Then > AR 12736, a SC24 AR, numbered by SWPC on 20 March 2019, went beta-gamma-delta on March 22.
https://solen.info/solar/old_reports/2019/march/20190322.html
It didn’t produce any M class flares but it was beta-gamma-delta and capable of such flares.
But the real test of my hypothesis is coming to us from 4.24 Ly away, our closest stellar neighbor, Proxima Centauri (PC). Predicting: 8 June 2020 (±2 days), massive super-flaring predicted from that M-class Dwarf star, similar to what was seen in March 2016 from PC. PC is already long noted a Flare Star. It is a Southern Hemisphere object (Dec = -62.68º) that requires a decent telescope to image at magnitude = ~11.
Some background on PC:
https://arxiv.org/abs/1804.02001
https://www.youtube.com/watch?v=wPel9qWi4iE
Tamitha Skov questions the spots in 19DEC19.
I published on December 13 on this website that we are using 300 year old methods and that Jan Alvestad has a better value with the high resolution sunspot calculations:
They GIVE a HIGH PROBABILITY FOR THE START IN MAY 2019!
This is what i wrote:
UPDATE with High Resolution Sunspot Calculations
Actually we see only 40-45 percent from the sunspot activity from the whole Sun, which makes the start of a sunspot cycle quite difficult. Complex sunspots on the limb and the Farside decreases the sunspot number on our side. For instance if you have a complex sunspot with a sunspot number of 35 on the limb, you see a much smaller sunspot number. If you have several of them in a few months, the sunspot number is lower than it actually is. A complex sunspot on the Farside that turns into a single sunspot on this side decreases it further. No paper has ever been written about this problem.
High resolution sunspots give a better value, but still don’t deal with the Farside problem. Anyway, they give a better value and seem to follow the ISN:
13 month smoothed values:
High resolution 2K
September: 15.9
October: 16.1
November: 15.6
December: 14.9
January: 14.5
February: 13.9
March: 13.1
April: 12.7
May: 12.4
The sunspot number in 2K for December 2019 has to be 15 to give the start for May.
High resolution 1K
September: 9.3
October: 9.5
November: 9.4
December: 8.9
January: 8.5
February: 8.1
March: 7.6
April: 7.2
May: 6.9
The sunspot number in 1K for December 2019 has to be 12 to give the start for May.
ISN
September: 6.5
October: 6.8
November:6.7
December: 6.0
January: 5.4
February: 5.0
March: 4.60
April: 4.30
May: 3.90
The ISN sunspot number for December 2019 has to be 10 to give the start for May.
SO YES, 2K gives a HIGH PROBABILITY for May 2019
1K: Probable for May, high for June 2019
Classic method: fail for May but probable for June 2019
Patrick,
It appears to me you are looking at the wrong ISN data.
This is the monthly ISN data from SIDC-SILSO:
http://www.sidc.be/silso/DATA/SN_m_tot_V2.0.txt
The 2nd half of 2019 has seen much lower monthly ISN’s than the first half of 2019.
2019 01 2019.042 7.7 0.8 841
2019 02 2019.122 0.8 0.1 1042
2019 03 2019.204 9.4 1.0 995
2019 04 2019.286 9.1 0.7 1039
2019 05 2019.371 9.9 0.7 1159
2019 06 2019.453 1.2 0.7 1273
2019 07 2019.538 0.9 0.2 1069 *
2019 08 2019.623 0.7 0.2 1157 *
2019 09 2019.705 1.1 0.1 992 *
2019 10 2019.790 0.4 0.1 857 *
2019 11 2019.873 0.5 0.1 693 *
These are the SMOOTHED SUNSPOTS!
The start of new sunspot cycles is always calculated with the smoothed values!
The high resolution calculations give the start of Cycle 25 in MAY 2019!
The big boys from NASA put it somewhere in 2020!
Who will be right?
Jan Alvestad or NASA?
Your comment still doesn’t get around the hard FACT that the 2nd half of 2019 had a much lower ISN than the first half of 2019.
So that when the 13 month smoothing gets done, 1 November 2019 could be the low spot. Non-smoothed, it will be either 1 December 2019 or 1 January 2020 if activity continue to pick up from here.
Makes arguing that June 2019 could be the minimum easily wrong.
The Butterfly diagram discrimination of spots by solar cycle (thus by latitude) is also key beyond just an ISN.
And the F10.7 average for October was extremely low.
As far as your observation that we don’t count the FAR side spots would only matter if there was reason to believe we couldn’t just 2x the count if we wanted to get a real Sun average total. To believe otherwise would be to assume solar magnetics are somehow different for the 180º of longitude not facing the Earth at any given moment.
Do you think Solar Magnetics are statistically different for the side not facing the Earth from the side we see, at any given time?
Joel,
You miss some basic knowledge. The formula for smoothing is the following:
As an example, the formula for calculating the smoothed value for August 2018 adds half of the Feb 2018 value plus the sum of the April through Jan 2019 values plus half of the Feb 2019 value and divide the sum by twelve:
Example formula:
[ (n1/2) + (n2+n3+n4+n5+n6+n7+n8+n9+n10+n11+n12 ) + (n13/2) ]/12
(where n1 = value for Feb 2018, n7 = value for August 2018 and n 13 = value for Feb 2019)
If you fill in an Sn of 10 for the ISN than the SMOOTHED value for June becomes ABOVE the one from May 2019!
The high resolution sunspots follow the ISN but seem to be leading at the low, because you see A LOT MORE sunspots at the LOW. Therefore they point earlier to a sunspot minimum.
Go to the site of Jan Alvestad and check my calculations.
The problem with measuring sunspots is the biggest on the limb. We see only probably 40 percent of the sunspots. We need to multiply than with 2.5 for the whole Sun.
And yes, there will be times sunspot activity is higher on the Farside and higher on this side. But according to what I have seen, Cycle 24 was more active on the Farside.
Solar Terrestrial Activity Report gives an SN in 2k of 31 and in 1K of 27 today.
We only need an SN of 15 in 2k and of 12 in 1K for December, and the SMOOTHED number for JUNE 2019 comes ABOVE the one from MAY 2019…
Conclusion:
The high resolution sunspot calculations give a high probability for the start of Cycle 25 in May-June 2019
Yes, along with polarity, the latitude of the AR will make it obvious which cycle it belongs to at this point in the minimum. All SC24 spots have appeared near the solar equator for months now, with the new cycle activity appearing at the expected high latitudes.
A complex sunspot on the Farside that turns into a single sunspot on this side decreases it further.
Look, a squirrel!
Come on. That also happens the other way around and increases it.
The problem are the sunspots on the limb. They decrease the sunspot number seriously. Also according to what I have seen the activity on the Farside for cycle 24 was higher than on this side. Why didn’t Nasa put SDO satellites on crucial points around the Sun to look into this problem?
Patrick
WHAT??
If you have a complex sunspot with an SN of 40 on the limb, you maybe see a number of 10.
Conclusion:
Complex sunspots on the limb decrease the actual number! So this makes the start of a new cycle more challenging. High resolution sunspot calculations work better, but the problem remains!
2 complex sunspots on the limb can change the start of a new sunspot cycle to a month later!
I don’t think the problem is as significant as you say it is. As already pointed out to you, the errors involving the far side that decrease sunspot counts also happen in the other way, too. BUT, it seems to me only the least significant sunspots occur and then vanish again before they have made a complete trip around the sun. We could do some study of that, how many spots occur on this side of the sun that diminish to nothing before they disappear around the rim of the sun? That’s all we would have to add to the counts to adjust for incidents of sunspots that occur on the far side of the sun and we never see. The sun isn’t the moon, where we never see the far side. The sun rotates around so we see it again in a few (4?) days.
It is not as strait forward, since sunspots do not appear on random along solar longitude. Some years ago I used longitudinal occurrence data to compile chart which shows that an area of 20 degrees wide centred on the solar longitude of 245 degrees produces twice or more sunspots than any other area of comparable size
http://www.vukcevic.co.uk/nSSLong.htm
They have, stereo A ahead and stereo B behind
https://stereo.gsfc.nasa.gov
Stereo-A/B’s were launched in 2006.
Stereo-B has been lost comms (and now probably destroyed batteries and frozen up control systems) since Fall 2014 when engineers were preparing it for going behind the Sun. It had a brief renewal of comms with NASA engineers in August 2016 that confirmed it was spinning uncontrollably and unrecoverable.
And even if it were still operational, both Stereo orbits means they have would have years of periods when the Sun’s back sideto Earth couldn’t be monitored. Right now, Stereo-A is slowly catching up to Earth, and Earth is slowly catching up to Stereo-B’s last known location.
The bottom-line is Stereo-A is long, long past its original service life of 2 years. And Stereo-A now keeps getting extensions since it is still fully functional and giving very good (and vital) CME and flare warning data of the approaching side of the Sun rotating towards Earth.
But the Stereo’s are NASA satellites for science and research missions. NOAA is the US Agency that should be the advocate for getting operational forecasting satellites in place to monitor the entire Solar sphere so that warnings can anticipated, regions tracked for their entirety and planning can be made on Earth by grids and satellite operators if a particularly nasty region is coming around to Earth view.
Joel, NOAA gives over almost every aspect of satellite functions to NASA. NOAA/NESDIS manages the terrestrial side, and NASA pretty much takes the lead on anything that is not terrestrial. This is a source of much frustration for some in NOAA/NESDIS, because as you correctly pointed out, it should be NOAA in the lead for this. Yet another example of the Government wasting untold amounts of money through needless duplication of functions, and lack of focus.
So are we or aren’t we doomed?
We will need millions of dollars in government grants and travel all over the world for at least 20 30 40 years to have meetings before we can give you an answer
Paul,
You are off by a few orders of magnitude (3) from the climate rent-seekers:
millionsbillions of dollars…Reality: If the climate scam were about millions of dollars in research money, it would never have gone anywhere.
These billions are just a drop in the bucket as compared to the trillions they claim we need to waste to mitigate a problem that can’t even occur, or to be more precise, the trillions of dollars they want extort from the developed world in the name of climate reparations.
It may sound mean to say so, but any development that the underdeveloped countries already have (which is very considerable compared to a century ago) is almist entirely due to the technology that was developed in the developed world. That development would never have happened had Europe and North America been strapped down with Tyrants and Authoritarian Socialists that are still keeping the underdeveloped world underdeveloped.
And it’s the 1% who want to protect their position at the top of the food chain by amassing more power through the statist bureaucracy/politicians/ngo’s while simultaneously weakening/compromising independent nations like the US, UK, Israel, etc. The dishonesty of these people is complete. Any position held is simply the means to an end which is complete control of government worldwide.
Yeah co2, I was going to say — trillions. In fact, trillions have prb’ly already been wasted in various types of world-wide expenditures.
“It may sound mean to say so”
The truth is not always pleasant. Ignoring an unpleasant truth can only lead to more unpleasantness and this seems to be the modus operandi of the political left.
If these two spots survive next five or so days then, despite blank sun up to now SSN count for December would be at least 5 but it is likely to be more. If so the SC24 minimum would be closely tracking SC23
http://www.vukcevic.co.uk/SSN.htm
indicating that Dr. Svalgaard’s prediction of = SC24+might turn to be realistic and mine extrapolation of =60%SC24 too low.
vukcevic
That is a really fair comment!
???
I was looking at spaceweather.com on a daily basis. According to them, we had a string of 40 spotless days.
yup that what I also read
They start counting the current day at the beginning of the day. When the spot popped out in the middle of the day it went back to 39. They don’t count 1/2 days.
Genuine question. How sure are we about the maunder minimum measurements? Long time ago with much less tech to measure the sun. Could it be that the suspot cycles were significantly stronger than thought?
Lack of observations of Aurora Borealis (Northern lights) corroborate a near lack of solar activity (no or very few spots) during that time. Further corroboration is in the Be10 isotope records for higher GCR flux during that interval.
So in other words, inferred, not observed. How do we know the assumed higher GCR fluxes weren’t from supernovas or something?
We don’t. Inferred is still valuable and it is all we have until we get a few centuries of modern measurements. Better than nothing but as you point out, not great.
Henrik Svensmark’s theory suggests that the solar winds, which regulate cosmic rays, are the means by which the sun influences climate. The higher the solar winds the lower the cosmic rays and the fewer clouds there are.
So his theory suggests that sunspots really don’t matter much for the climate other than being a proxy for solar winds.
And as you say, cosmic rays can vary throughout the Milky Way.
You could have very high solar winds and still have high cosmic rays and really cold climate if the solar system is passing through an area of high cosmic rays in the Milky way. Nir Shaviv says that has happened numerous times to the earth when the solar system has passed through a spiral arm of the galaxy.
I have gotten to where I just look at the cosmic ray count since that seems to be the climate driver.
As of today at Thule they are the highest ever recorded.
http://cr0.izmiran.ru/scripts/nm64queryD.dll/thul?PD=1&title=Thule&dt=0&base=4800&Res=1_month&y1=1957&y2=2019
But since the Southern Hemisphere is far more cloudy than the Northern Hemisphere that is where Svensmark’s theory would have the greatest impact. And of course we know a whole lot less about the Southern Hemisphere than the Northern Hemisphere since 90% of the world’s population lives in the Northern Hemisphere.
Some of your concern may be answered here:
Sunspot stuff
Ignore the comments regarding climate and read just for the historical sunspot stuff — correction of the sunspot number.
Leif Svalgaard is noted therein. Leif’s own presentations on WUWT a few years ago explained this. His more recent powerpoint shows are available on his site. Those require more reading and/or understanding because the intended audience was listening.
Enjoy: https://www.leif.org/research/
” It’s a deep Minimum, century-class according to sunspot counts”
Not really, it looks same as the last minimum (see my link above-lower graph), the last proper Deep Minimum was the Dalton Minimum with 22 months of zero count, while we had no monthly ‘zero’ for the SC24, although we had stretch longer than 30 days spread across two months. Calendar month is the artificial time scale metric, a 27 days period – one Bartels’ rotation – would be more preferable).
Mods,
Pls help with a comment lost in moderation (too many URLs I suppose):
comment-2878249
Merry Christmas,
Joel
A simple measurement shows that both sunspots are at 27 degrees latitude, neglecting the projection of the Sun’s axial tilt of 7 degrees. That fits well in the butterfly diagram for the next cycle.

This is meaningless. It may mean SC25 is ramping up. It may just be a blip and we go back to nothing. We wont know for months. 10.7 has still not reached it’s expected low and several other measures are still not at expected lows. For now, this is nothing more than “interesting”.
Are you so skeptic when your favorite sports team scores a 1-0 goal? Time will tell, but in the meantime people like to speculate. Solar activity goes up much faster than it goes down, so as soon as we start seeing SC25 spots on a regular basis the solar minimum ends in short order and the date of the minimum is placed at the center point of the low activity period several months earlier. Some of us have been speculating that the date of the minimum is several months in the past and that SC24-25 minimum will probably be shorter and more active than SC23-24. This is because some of us have hypotheses about solar activity evolution that make specific predictions about this solar minimum. We are eager to see if the data supports or refutes those predictions.
“Are you so skeptic when your favorite sports team scores a 1-0 goal?”
Science is not sports, and the two are not comparable in any way. I seriously have concerns about the work of scientists who indulge their emotions in that way. Science is cold, hard, unforgiving and brutal; nothing emotional about it.
The only thing that counts in science is being right for the right reasons. And I only judge scientists for their scientific achievements.
1 November 2019 stands out to me. The mostly SC24-related spot counts from March-May 2019 Would place the minimum in the Fall 2019 if these current SC25 active regions recurring on subsequent Bartel rotations.
Actually, I prefer “interesting” rather than the opposite.
We do not 100% know how it starts but we know how minimums end.
With a bang, or perhaps better, a loud hissing crackling noise on the radio, before it stops working…
We’re perhaps long overdue for a grand minimum, but a couple of spots could mean nothing at all.
The end of a minimum 1859?
A layman’s eye-balling at the daily F10.7 solar flux data in
ftp://ftp.seismo.nrcan.gc.ca/spaceweather/solar_flux/daily_flux_values/fluxtable.txt
seems (!) to indicate that Special Agent F10.7 slowly moves up since a while, and anticipated SSN’s message on SC25’s birth:
https://drive.google.com/file/d/1IXtMTG4cEbMWL0yhOjKsCGEpF-VLeWsl/view
It seems that you have never looked at a solar minimum, yet WUWT had already documented the solar minimum 2008-2009
Similar events have already occurred in recent months with both sun spots in cycle 24 and with cycle 25.
Yet no articles have been written.
I don’t understand those who expect a Maunder Minimum, statistically it’s impossible for the same event to happen.
AI
“… statistically it’s impossible for the same event to happen.”
Could you explain, maybe with some source?
Do you especially mean the Maunder guy ? Or is the sentence valid for all others, i.e. Oort, Wolf, Spörer, Dalton?
Historically speaking the Big Minims are similar, but each one is different in its duration and intensity.
Some theorize a Maunder, others a Dalton.
Whatever happens, it will behave differently from what we know.
Duh… that’s more than evident.
People telling about an incoming Maunder don’t mean the same stuff arising again; they mean something of comparable intensity / duration.
No two volcano eruptions with a VEI of 6 need to look even a bit similar.
But VEI 6 is… VEI 6.
Nul besoin de couper les cheveux en quatre dans le sens de la longueur.
It seems to me that we are trying to guess the repetition of what the Great Minimum could be.
Maunder or Dalton?
It does not make sense.
Also because the media could quote “New Maunder Minimum coming soon” or “Scientists predict new Dalton Minimum”.
It’s simpler to call it a Big Minimum and that’s it.
Just to give an example, we might as well foresee a new Homeric Minimum since it looks more like us with the movement of the Magnetic Pole.
What you term a “Big Minimum” I would call a “Miniminimum.”
“statistically it’s impossible for the same event to happen.”
So for example, if we are at the peak of a periodic response with an 11 year period, another peak 11 years later is statistically insignificant? For some reason, periodicity is unrecognized by the ‘consensus’ who thinks that any short term trend we measure will continue in the same direction indefinitely, so your confusion is readily explained.
Nearly every star we can observe has a periodically variable output with arbitrary periods and arbitrary magnitudes. How can you rule out a longer term periodic behavior of the Sun beyond the 11 year sunspot cycle we’re already familiar with? The Sun is a big chunk of plasma which can easily support internal vibrational resonant behaviors with periods of many centuries.
As Dr Philips told us in another thread at SpaceWeather:
https://spaceweatherarchive.com/2019/12/17/sunspots-set-a-space-age-record/
And… where is the valuable hint on any incoming Maunder Minimum?
Rgds
J.-P. D.
Dr. Philips makes the mistake of thinking that dividing the data in calendar years makes for a better understanding. It does not. SC23-24 minimum is so far deeper and longer than SC24-25 minimum.
From that quote: “ Since the Space Age began, …”
From Wikipedia: ” The Space Age is generally considered to have begun with Sputnik 1 in 1957, continuing to the present day. ”
The doings of ol’Sol started long before I was in high school, or so I thought.
“Since the Space Age began” seems to have come from one source, and then promulgated endlessly. I don’t understand the relevance, but apparently it was important to someone.
I find it hard to believe sunspots in earlier cycles without our great satellites and newer telescopes were undercounted. Some of these are so small they could have been interpreted as dust on the lens in earlier times. I suppose there is a fudge factor thrown in or inference based on other things, but it won’t be the real number.
Kind of like hurricanes and typhoons. Some of these form in way out of the way places so in 1920 if a ship wasn’t close or it didn’t pass over a island with people we never knew about them.
I do find it interesting though about the theories of how the solar cycles operate and the math behind the forecasting. Of course cycles take a while to complete so if it takes 11 or 22 or 44 or more years to even get the data to see if you are right, it’s going to be a lifetime or more. Kind of like climate change.
” were undercounted. ”
Say what?
(When it posts:) See a comment by me above about sunspot stuff.
It’s about comparison.
If in 1690, the sunspot count was say (I am guessing) 15 in a certain period via eyesight (or whichever methods they used), but with today’s technological advancements the count would be 150 in that period, the relative comparisons, using those different numbers, would be inaccurate, to say the least.
To compare, the methodologies in 1690 and today would have to be the same.
And thus rbabcocks reference to hurricanes / typhoons.
If the NOAA (or whomever) counts 50 storms in year Z, versus only 35 storms counted in year J, comparisons are skewed for 2 reasons……..today we have a) satellites, wind measurements by ships at sea, reconnaissance, etc b)the goalposts (wind speed necessary for storm status) have been lowered.
In reconstructing the sunspot numbers, great effort go into compensating for improvements in technology and perception of what makes a sunspot, so as closely as we can make it the counts should be independent of time and should be comparable.
See e.g. https://leif.org/research/ATS-at-MWO-2017.pdf
Leif Svalgaard
Thanks for the paper, I had completely forgotten that stuff 🙁
Hope everyone had a good Xmas.
If another Solar Grand Minimum is meant to start with the SC25, then it has to peak well below 50% from the SC24max, such scenario is possible but unlikely. Alternatively if the ‘Polar Fields’ prediction is confirmed (within + or – 20%) than it will become indisputable prediction metric, unless everything goes ‘pear shaped’ and there is a major SC25 shock in either direction, so let’s hope for the very unexpected.
My non-professional opinion is that we are going to have a couple of weak cycles, that pairs of weak cycles are probably fairly common, and expect that we will most likely go back to a series of more moderate (than the past few) cycles to something closer to the average post-Maunder cycle.
Any climate impact is likely to be slight, again in my personal opinion, an analog might be the period during the 1960s and 1970s when change in global climate was flat to slight cooling though changes in atmospheric circulation patterns can make for some dramatic local changes.
I wouldn’t be shocked to see Arctic sea ice begin trending up to something closer to the average for the past several decades.
39? More like 53…..
According to
http://www.sidc.be/silso/DATA/SN_d_tot_V2.0.txt
17 in November (14 till 30)
and to
http://www.sidc.be/silso/DATA/EISN/EISN_current.txt
23 in December (1 till 23)
That gives 40 in a row.
Hi
If you are so inclined as to do a bit of science here are the 2019/20 starting dates and numbers for the Bartels’ rotations.
2530 1/21/2019
2531 2/17/2019
2532 3/16/2019
2533 4/12/2019
2534 5/9/2019
2535 6/5/2019
2536 7/2/2019
2537 7/29/2019
2538 8/25/2019
2539 9/21/2019
2540 10/18/2019
2541 11/14/2019
2542 12/11/2019
2543 1/7/2020
2544 2/3/2020
2545 3/1/2020
2546 3/28/2020
2547 4/24/2020
2548 5/21/2020
2549 6/17/2020
2550 7/14/2020
2551 8/10/2020
2552 9/6/2020
2553 10/3/2020
2554 10/30/2020
2555 11/26/2020
by filling in the SSN you might get even more fun.
Sunspot regions.
https://www.spaceweatherlive.com/en/solar-activity/sunspot-regions
Furthermore, in cycles 25–27 and, especially, in cycle 26, the toroidal magnetic field waves generated in these two layers become fully separated into the opposite hemispheres, similar to the two PC waves attributed to poloidal field (Fig. 1, top plot), that makes their interaction minimal. This will significantly reduce the occurance of sunspots in any hemisphere, that will result in a very small solar activity index for this cycle, resembling the Maunder Minimum occurred in the 17th century.
https://www.ncbi.nlm.nih.gov/pmc/articles/PMC4625153/
ren
A real fan and gullible follower of Mrs. Zharkova like you manifestly are, should at least manage to publish her most recent work:
https://www.nature.com/articles/s41598-019-45584-3
In French we use to say: “Rien de nouveau à l’Ouest”.
“Although, it was noted17,18 that Sporer minimum (1460–1550) is not present in our summary curve, which instead during the same period of time shows a standard grand cycle, the previous one to the modern grand cycle (17–21 centuries). Zharkova et al.17,18 reasonably argued that Sporer minimum is an artifact of the strongly increased at that time background radiation on the Earth caused by the explosion of a very close (about 600–700 light years) supernova Vela Junior occurred in the southern sky. The radiation induced by this explosion for this period has not been considered in the background radiation required for the carbon dating method19,20 that could shift the dates by a few hundred years.”
https://www.nature.com/articles/s41598-019-45584-3
Those tiny little sickly spots look like pores, not sunspots.
The magnetic field strength of individual sunspots has been decreasing at roughly 50 gauss/year for some unknown reason. As the attached paper notes, if the magnetic field strength were to continue to decline the sun would be spotless by roughly 2022 (See graph in paper).
As the magnetic field strength of the magnetic flux tubes declines what is formed on the surface of the sun changes from a sunspot to a pore.
If the magnetic field of the surface sun spot or pore is determined by the magnetic field strength of the magnetic flux tube that rises up from its formation at the solar tachocline zone. That magnetic flux tube requires a minimum field strength to avoid being torn apart in the convection zone.
Science is looking at the observations and coming up with at least a hypothesis that attempts to explain current observations.
https://arxiv.org/pdf/1009.0784v1.pdf
Long-term Evolution of Sunspot Magnetic Fields
Independent of the normal solar cycle, a decrease in the sunspot magnetic field strength has been observed using the Zeeman-split 1564.8nm Fe I spectral line at the NSO Kitt Peak McMath-Pierce telescope.
Corresponding changes in sunspot brightness and the strength of molecular absorption lines were also seen.
This trend was seen to continue in observations of the first sunspots of the new solar Cycle 24, and extrapolating a linear fit to this trend would lead to only half the number of spots in Cycle 24 compared to Cycle 23, and imply virtually no sunspots in Cycle 25.
….Pores, lacking penumbra, often have magnetic fields less than 2000 Gauss, but always have magnetic fields stronger than 1500 Gauss.
Secondly, the intercept of the mean magnetic field strength with this 1500 Gauss threshold does not imply that all sunspots will disappear by the year 2021; rather it implies that half of the sunspots which would normally appear on the surface of the Sun would be visible.
Finally, the plot doesn’t address the other magnetic fields on the Sun where field strengths are lower than 1500 Gauss; the temporal behavior of solar active network or quiet Sun magnetic fields may be different from the behavior shown by sunspots.
The 2010 Penn and Livingston paper is out of date to more recent measurements. The umbral magnetic field strength has stabilized around 2000 gauss.

Maybe Leif can update this umbral magnetic field strength plot with newer data?
In November 2019, solar magnetic activity was clearly down.
 ?time=1575854402000
The Kitt Peak Solar Observatory has been shut down, so no more newer data.
And Bill Livingston is now retired.
Of course Logically,
If the umbral magnetic field strength had stabilized, what we would observe now on the sun’s surface, is normal sunspot groups that are made up of a group of powerful long lived (roughly 20 days) sunspots.
What we are observing now on the surface of the sun are:
None visible sunspot ‘groups’. These sunspot groups have no visible sunspots and can only be ‘seen’ by their magnetic effect on iron ion emission of light. This class of non visible sunspots did not exist in past solar cycles.
Just Visible Sunspot Groups: This is what we are observing now. Sunspot groups made up of one or two tiny small short lived sunspots.
I guess we can continue to stick our head in the sand and assume the sun will change back to the sun which we knew so well….
The problem with admitting in our ‘mind’ that the mechanism that makes the magnetic flux tubes that rise up to the surface to form sunspot has changed….
… is there is no theory to explain a changing sun…
… we assumed the sun does not and cannot change…
There are two ‘miracles’ to consider:
1) the sun has changed just when we are looking at it
2) we are speculating and we are just wrong
Normally we should go with the lesser miracle (following David Hume).
It seems to me that 2) is the lesser
Leif,
You are ignoring what is happening to the sun. Logically what you should have done is come up with an alternative hypothesis.
What is so weird about the sun changed in a manner which we believed was impossible at the very time that we are observing it with instruments?
I guess it would be weird if the planet also cooled.
It does not look like it is warming.
You are ignoring what is happening to the sun
Of course not. Just keeping the right perspective.
Weeding out idle speculation.
Invisible sunspots are not news.
https://leif.org/research/Zwaan1967-Solar-Mag-Fields.pdf
This does not look like the fast end of the solar minimum.

Ok Got it. No one knows what is going to happen.
And to start at the beginning, there were actually sunspots in the maunder minimum so it’s a bit early to know if it starts now or post SC 25.
Oh well, already gone, ‘much ado about nothing’
Can’t spot the spots even on the high resolution image
although there is something on the magnetogram.
Climate change is associated with changes in ionizing radiation in the stratosphere in an alternating magnetic field.
https://www.esa.int/Applications/Observing_the_Earth/Swarm/Our_protective_shield