SUNSPOTS BREAK A SPACE AGE RECORD:
Solar physicist Dr. Tony Phillips writes via email:
Solar Minimum is officially “deep.” 2019 has just broken a Space Age record for days without sunspots. Moreover, an international panel of scientists led by NOAA and NASA predicts that Solar Minimum could deepen even further, not reaching its lowest point until April of 2020.
Solar Minimum is becoming very deep indeed. Over the weekend, the sun set a Space Age record for spotlessness. So far in 2019, the sun has been without sunspots for more than 270 days, including the last 33 days in a row. Since the Space Age began, no other year has had this many blank suns.

The previous record-holder was the year 2008, when the sun was blank for 268 days. That was during the epic Solar Minimum of 2008-2009, formerly the deepest of the Space Age. Now 2019 has moved into first place.
Solar Minimum is a normal part of the 11-year sunspot cycle. The past two (2008-2009 and 2018-2019) have been long and deep, making them “century-class” Minima. To find a year with more blank suns, you have to go back to 1913, which had 311 spotless days.
Last week, the NOAA/NASA Solar Cycle Prediction Panel issued a new forecast. Based on a variety of predictive techniques, they believe that the current Solar Minimum will reach its deepest point in April 2020 (+/- 6 months) followed by a new Solar Maximum in July 2025. This means that low sunspot counts and weak solar activity could continue for some time to come.

Solar Minimum definitely alters the character of space weather. Solar flares and geomagnetic storms subside, making it harder to catch Northern Lights at mid-latitudes. Space weather grows “quiet.” On the other hand, cosmic rays intensify. The sun’s weakening magnetic field allows more particles from deep space into the solar system, boosting radiation levels in Earth’s atmosphere. Indeed, this is happening now with atmospheric cosmic rays at a 5-year high and flirting with their own Space Age record. It’s something to think about the next time you step on an airplane.
Source: Dr. Tony Phillips, Spaceweather.com
This is not looking good.
Agree, however looking at individual calendar years doesn’t make much sense, a better way would be to compare number of spotless days in the last 365 or even more meaningful from the time of the cycles’ peaks.
Yep. Wish someone had rolling 365 day totals. That would negate the advantage of a deep solar minimum starting in January versus July.
Based on total spotless days, we have 6 or 7 months to go to top the last cycle.
I have emailed Dr Phillips multiple times suggesting a 365 day rolling tally. As you can see I haven’t been successful.
I downloaded the SILSO sunspot data set and made a graph on zero sunspot days in the previous 365. How do I post it?
The published SILSO data ends at 11/30, so it doesn’t show all of the last peak.
Thanks for that. Someone make the SILSO data link permanent!
Analysed. For the start of the series, if no data (-1), then previous data. Not correct, will give workable numbers, will die out by itself from the point where there always is good data.
Ran 365 days sum divided by 365. All over the place, just like the chart. Ran 11.29 years cycle sum divided by 11.29 years days.
Able to spot superminimum bottom at 48 in 1907 (spread out 1884-1917). Very clear intermediate minimum, number crashing down from 137 top in 1959 to 86 bottom 1972-1979.
Back up to 125 counts on the 11.29 year daily average calculation in 1990,
95 counts in 1997
106 counts in 2000
Came crashing down to 48 as of last data.
Should be fairly easy to spot a 114 year cycle in the data.
Oddgeir
It should not make much difference but to be more scientific you could use 367 days (14*26.24 or any other multiple of 26.24 ) whereby 26.24 days is one solar rotation as observed from the sun revolving Earth.
Solar rotation times, differing from equator to poles from exterior to interior, measured over half a year of observations. I’d postulate “inaccurate” at best…
Counting days between bottoms, I get 10.92 year cycles. Counting days between tops, I get 11.01 year cycles. Perhaps good to use 4005 days average.
Oddgeir
“Since the Space Age began, no other year has had this many blank suns. ”
There have been years with more than 270 spotless days. Before the Space Age.
How many solar minimums have we had in “the Space Age”?
I have no idea. Why limit it to the Space Age? What relevance does that have?
Only if you are discussing solar maximums disturbing satellites. As cycle 24 was growing, I was wondering if that would affect GPS. it was going to be the first maximum in our now GPS filled society. But it didn’t seem to have nay impact. Was that because 24 was weak, or because GPS satellites are built to withstand space weather even during solar maximum?
I suggest about 5 cycles in the Space Age elsewhere. That started around 1957 or whenever Sputnik reached orbit.
Mostly meaningless metric, definition, and sample size.
nonsense.
GHGs will keep us warm
Just as long as they control the SSTs, like they have always done, right?
I’m finally starting to recognize your dry wit, kid.
Steven,
No. Sorry buddy.
GHG’s only slightly slow the loss of atmospheric heat, as you recently pointed out.
Fossil Fuels, hydro, and nuclear power will keep us warm.
Fossil fuels will feed and kept fed you, me and 7 billion of our fellow humans.
Keeping warm and fed is what all of can hope for at a minimum. More so than at anytime in human history. Fossil fuels.
Stayin’ warm. Stayin’ fed. Thank you fossil fuels.
Just like Congressional Dems rabid for an irrational, go nowhere Impeachment, the climate alarmists are totally psychotic in their climate delusions. We are living in a time of half the population being delusional… triggered to fits of anxiety by their delusions.
Pro tip: Don’t join them. You will go crazy.
Joel
Thank you for your input!
Money,money money. Cut off the dollar flow to these parasites.
like a cozy blanket around an otherwise icy planet
How warm did GHG’s keep us during the last glaciation Mosher? Those who claim to know everything about our climate system are absolutely the least knowledgeable.
If anything, it will be the oceans that keep warm – air holds very little heat.
Anthony, to match this article, I suggest you update the Sunspot plot in your Solar Page. https://wattsupwiththat.com/solar/
A C Osborn
“This is not looking good.”
Please remember the last last solar minimum:
2008 6: 5.2
2008 7: 0.6
2008 8: 0.3
2008 9: 1.2
2008 10: 4.2
2008 11: 6.6
2008 12: 1.0
2009 1: 1.3
2009 2: 1.2
2009 3: 0.6
2009 4: 1.2
2009 5: 2.9
2009 6: 6.3
2009 7: 5.5
2009 8: 0.0
2009 9: 7.1
For the same period, the average SSN count (3.58) was even lower than it is actually (3.86).
Leif Svalgaard predicted SC25 becoming higher than SC24, and that counts imho a lot more than this spot-free statistics.
I don’t understand this panic, which is of course pretty well enhanced by tricky sites showing you
‘Ooooh! Cooling ahead!!!’
in Europe by restricting their ‘analysis’ to weather stations with data perfectly fitting to their narrative.
As opposed to CONUS which experiences harsh cold blasts since a few years, due to the weakening of the polar vortex (especially in 2014), Europe is warming:
https://drive.google.com/file/d/1scoqG9Ezl0btBFUoE5nopYMOadGqfMu0/view
Except the learned solar people on this thread dont seem to agree with you.playing down the significance of this mile stone is rather disingenuous to the majority of posters on this thread ,Berlin temp is only 5c today and is colder in the rural areas ,you were shown last week Scotland and UK temps well below average ,its still snowing in upland Scotland that’s 7 days without a break its snowing in parts of Spain and Portugal, you have to go down to near the Mediterranean before anywhere hits a temp above 9c, and you say its warming , your continually misleading people.your a global warmest, I dont care how many statistics you bring up ,Europe is not warming.
B d Clark
1. “Berlin temp is only 5c today”…
Ha ha ha haaah!
You tell, as usual, complete rubbish about corners you know nothing about.
Here is the Berlin data from ‘wetteronline.de’:
Schönefeld/Flughafen (48m) Di, 17.12. 16:00: 10.5°
Berlin-Tempelhof (49m) Di, 17.12. 16:30: 10.9°
Berlin-Marzahn (60m) Di, 17.12. 16:30: 10.6°
Berlin-Dahlem (70m) Di, 17.12. 16:00: 10.5°
You don’t have any idea how warm today’s weather in Berlin is, for December 17, in comparison with ten, twenty, thirty years ago!
I’ll try later to obtain data back to 2010 or earlier.
2. “… its snowing in parts of Spain and Portugal…”
Oh Noes!
It is absolutely usual for Spanish regions like Cantabrica, the Pyrenees or the Serra Nevada to have snow in December!
But there is far far less of that than decades ago. Did you have a look at the Sierra Nevada in 1984 compared with this year? I did!
And the same is valid for Serra Estrela or Braganca in Portugal! But… there is no snow there actually. Not one weather web site tells me about that.
3. “… you have to go down to near the Mediterranean before anywhere hits a temp above 9c…”
This is now absolutely ridiculous. Look at this below (France today, 17:30 !!!):
https://www.wetteronline.de/g00/3_c-9zzz.zhwwhurqolqh.gh_/c-9PRUHSKHXV0x24kwwsvx3ax2fx2fzzz.zhwwhurqolqh.ghx2fx3fgdbwlphx3dgdbx26gldjudpx3dwux78hx26ifgdwvwux3d53424540x26llgx3dIUx26slgx3ds_flwb_orfdox26vlgx3dSlfwrjudpx26l43f.pdunx3dlpdjh_$/$
*
B d Clark, you should REALLY stop
– thinking that the whole Europe looks like your little, cold, for me simply inhabitable Scotland;
– reading tricky pages misinforming you about inexistent weather.
Berlin was 5c when I looked, it does not snow in Spain normally till January, it’s rare to see snow in Portugal
Europe is not warming
The point with Scotland is it does not snow for 7 days continuously, last month 1.4 c below normal.
That graph you supplied weres the unadjusted data ?
B d Clark
“Berlin was 5c when I looked”
Oh yes, it was probably 6 or 7 AM, wasn’t it?
Here is the last December worth to mention wrt winter feeling:
https://www.wetteronline.de/g00/3_c-8yyy.ygvvgtqpnkpg.fg_/c-8OQTGRJGWU0x24jvvrux3ax2fx2fyyy.ygvvgtqpnkpg.fgx2fx3ffkcitcox3dvtwgx26ikfx3d32504x26kkfx3d32504x26ktgsx3dvtwgx26ogvrctckfx3dVZNFx26oqpvjx3d23x26rekfx3dre_twgemdnkem_fcvcx26rgtkqfx3d6x26rkfx3dr_twgemdnkem_fkcitcox26ukfx3dUvcvkqpJkuvqtax26agctx3d4233x26k32e.octmx3dkocig_$/$
And we had a lot of snow in this 2010, compared with all the years after!
Here is this year:
https://www.wetteronline.de/g00/3_c-8yyy.ygvvgtqpnkpg.fg_/c-8OQTGRJGWU0x24jvvrux3ax2fx2fyyy.ygvvgtqpnkpg.fgx2fx3frekfx3dre_twgemdnkem_fcvcx26rkfx3dr_twgemdnkem_fkcitcox26ukfx3dUvcvkqpJkuvqtax26fkcitcox3dvtwgx26kkfx3d32504x26ikfx3d32504x26oqpvjx3d23x26agctx3d4242x26ogvrctckfx3dVZNFx26rgtkqfx3d6x26ktgsx3dvtwgx26k32e.octmx3dkocig_$/$
One day you will understand that you are the victim of intended misinformation.
*
Please start to speak about adjusted / unadjusted temperatures when you will have managed to compare them YOURSELF by e.g. processing GHCN V3, GHCN daily and the like.
I did. And as long as you didn’t, I see no reason at all to talk with you about that.
Nope it was 3pm radar tracked, why are you posting German weather sites in German I dont read German
Weres the unadjusted data for the graph you reproduced earlier
B d Clark
Sorry if you can’t manage to use Google’s Translator.
I don’t read Spanish or Portuguese either, but…
*
If you had a bit more experience, you would know that nearly all info on weather sites are averages coming from various stations in the near (there are about 10 in Berlin). Thus it is not possible to obtain raw data.
GHCN daily obtains data from all around the world a few days after measurements.
*
Now what concerns your pretentious claim about Europe ‘not warming’, look at this:
https://drive.google.com/file/d/1QV12CWu7sdmK8lpXmrvePnhm-YtF5mDe/view
I just downloaded UAH’s 2.5 degree grid data for 2019 again, and that is how terribly cold the lower troposphere and the surface (raw, unadjusted GHCN daily data) are becoming in / above UK and Ireland.
And here, B d Clark, is the top10 of all the really cold temperatures in your corner:
-UKE00105933 ___CARNWATH___________________ 1982 1 11 -24.8
-UKE00105933 ___CARNWATH___________________ 1979 1 13 -24.6
-UKE00105933 ___CARNWATH___________________ 1979 1 14 -24.3
-UKE00105874 ___BRAEMAR____________________ 1982 1 9 -24.2
-UKE00105874 ___BRAEMAR____________________ 1995 12 30 -23.8
-UKE00105875 ___BALMORAL___________________ 1982 1 10 -23.5
-UKE00105874 ___BRAEMAR____________________ 1985 1 27 -22.7
-UKE00105874 ___BRAEMAR____________________ 1982 1 7 -22.6
-UKE00105875 ___BALMORAL___________________ 1995 12 30 -22.6
-UKE00105875 ___BALMORAL___________________ 1982 1 8 -22.5
In this ascending sort, 2019 first appears at positions 3171
-UKM00003257 ___LEEMING____________________ 2019 2 3 -10.8
4702
-UK000003162 ___ESKDALEMUIR________________ 2019 2 3 -9.9
9982
-UKM00003862 ___BOURNEMOUTH________________ 2019 1 31 -8.2
13355
-UKM00003091 ___CRAIBSTONE_________________ 2019 2 1 -7.5
etc etc.
Buenas noches!
So still no raw data from that fraudulent temp graph well theres a surprise, still no understanding of cloud nucleation by CRF not another surprise you really dont stand up to any scrutiny do you,
As for your next batch of so called data if you uploaded it why not link to it instead, seems to me your minipulating data again as for temps in Scotland I’m well aware what they are 1.4c below average for November 0.9c for the UK as a whole,I know you dont like the fact it goes against the myth of catastrophic global warming . 7 days and nights for Scotland with snow not a sign of global warming anywhere.
B d Clark
“As for your next batch of so called data if you uploaded it why not link to it instead, seems to me your minipulating data again…”
Typical paranoid reaction of persons like you…
I don’t manipulate anything – unlike many of these tricky sites you are unexperienced enough to trust in.
Feel free to look at the data:
ftp://ftp.ncdc.noaa.gov/pub/data/ghcn/daily/all/UKE00105933.dly
and replace the station id ‘UKE00105933’ by other appropriate ids.
The entire station list is in
ftp://ftp.ncdc.noaa.gov/pub/data/ghcn/daily/ghcnd-stations.txt
Ah noaa data on temperature that figures glad you wasted your time.
Any look on learning about cloud nucleation causation CRF you do seem to be avoiding that one.
How about the fraudulent temperature graph did you find the raw data ,being you so good at finding data I guess your hiding it. Top ho old boy.
B d Clark
“Ah noaa data on temperature that figures glad you wasted your time.”
This is enough, B d Clark.
I don’t waste any time with NOAA’s GHCN daily data set: it is the rawest we can obtain.
I rather waste my time in replying to your disingenuous and ignorant comments.
You certainly will find here other persons ready to communicate with. Persons for example who prefer to follow misinformers than to go themselves to data sources and evaluate them.
You’re right, ’cause Tony’s record isn’t really ‘official’; SIDC/SILSO is official, and their record won’t be broken until this Saturday, Dec. 21, however, it is a ‘deep’ 100-year type centennial minimum.
Spotless rankings: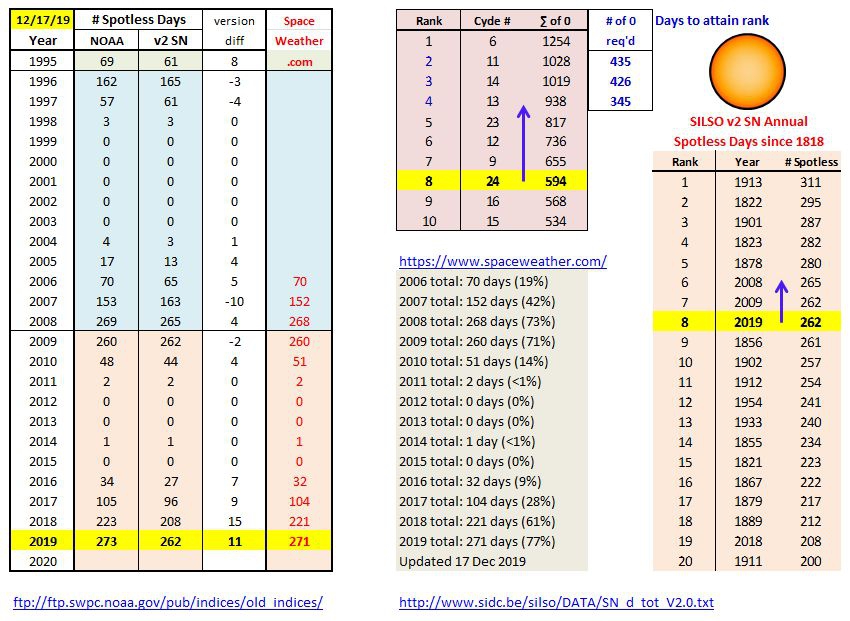
365d Solar minimum averages: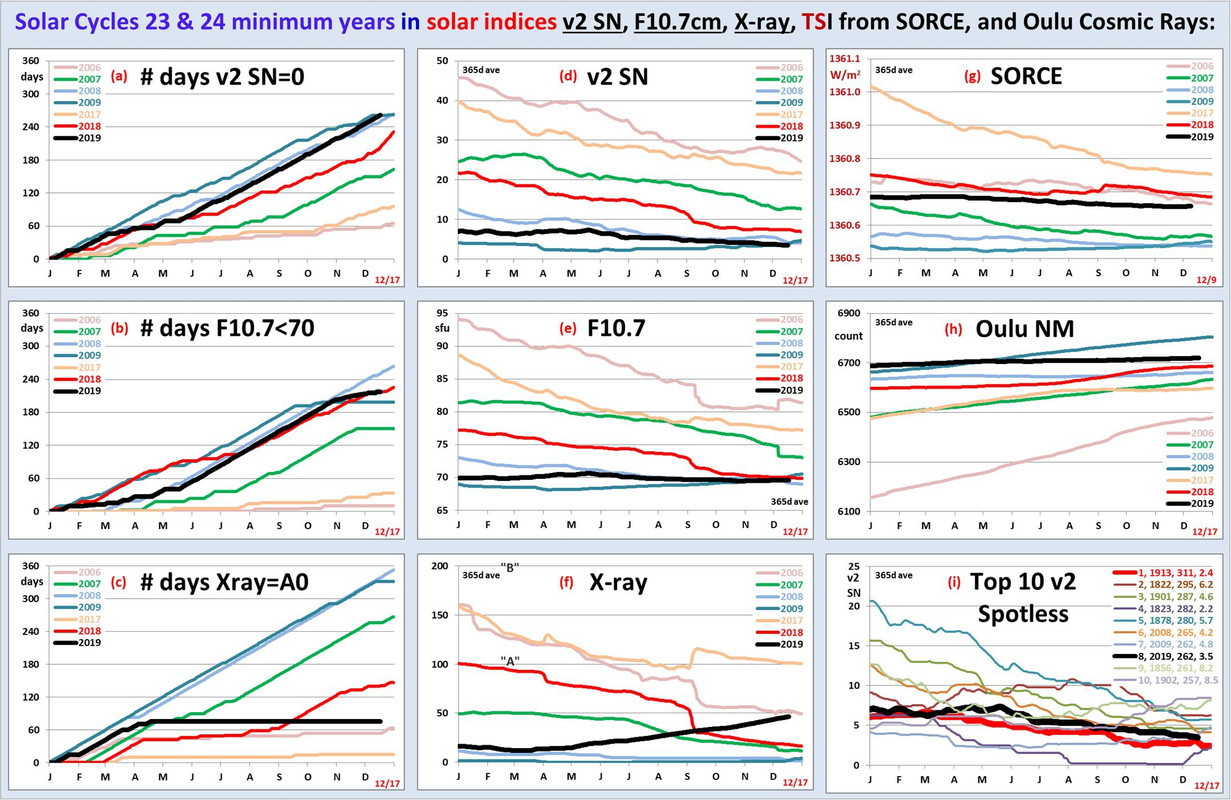
If I look at the temperature data, I have no fears of little ice ages and other cold periods
Hypothesis: A species that evolved to focus on short-term threats is doomed to ignore a long-term threat until it is too late.
A test of this hypothesis is ongoing but results won’t be known for some time yet.
No species evolved by ‘focusing on short or long term threats’. That hypothesis implies rather strongly that living creatures use some form of ‘intelligence’ to guide their evolution. Pretty hard for me to imagine a bacteria assessing the short term threats in it’s environment and specifically evolving new characteristics to address those threats. It also rather strongly mirrors a Lamarkist view of evolution.
Yes space weather.com has up to the minute info on the sun ,a excellent day by day guide to effects of CR on certain flights,”the daily hot board”
I like that the spaceweather.com browser tab icon is an umbrella.
But that’s not a link to space weather dot com is it it’s a link to a climate activist site.
How very brave of you 🤣
Tamitha Skov, space weather forecaster is easier on the eyes and more qualified:
I think it’s a common template website, theres a volcanic website with the same template, I agree it’s not that easy on the eyes ,maybe because I’ve not landed there to often , I will check out the other one.👍
RU Kidding? SHe looks like a tranny?
That’s a rather offensive comment!
Leif, please update your “Active Regions” page!
How does that effect climate?
It is going to get colder.
It is already colder, according to my own data set.
Well you obviously don’t live in Mainland Australia then
Present theory is reduced solar activity allow increased cosmic rays which in turn cause increased could formation which reflex solar energy back into space resulting in a cooling of the earth.
“How does that effect climate?”
Here is how:
The failed catastrophic very-scary catastrophic global warming (CAGW) hypothesis, which ASSUMES climate is driven primarily by increasing atmospheric CO2 caused by fossil fuel combustion, will be clearly disproved because fossil fuel combustion and atmospheric CO2 will continue to increase, CO2 albeit at a slower rate, while global temperatures cool significantly.
This global cooling scenario has already happened from ~1940 to 1977, a period when fossil fuel combustion rapidly accelerated and atmospheric temperature cooled – that observation was sufficient to disprove the global warming hypo many decades ago.
Contrary to the global warming hypothesis, CO2 is clearly NOT the primary driver of century-scale global climate, the Sun is – the evidence is conclusive and we’ve known this for decades.
_________________________
In June 2015 Dr. Nir Shaviv gave an excellent talk in Calgary – his slides are posted here:
http://friendsofscience.org/assets/documents/Calgary-Solar-Climate_Cp.pdf
Slides 24-29 show the strong relationship between solar activity and global temperature.
Here is Shaviv’s 22 minute talk from 2019 summarizing his views on global warming:
Science Bits, Aug 4, 2019
http://www.sciencebits.com/22-minute-talk-summarizing-my-views-global-warming
At 2:48 in his talk, Shaviv says:
“In all cores where you have a high-enough resolution, you see that the CO2 follows the temperature and not vice-versa. Namely, we know that the CO2 is affected by the temperature, but it doesn’t tell you anything about the opposite relation. In fact, there is no time scale whatsoever where you see CO2 variations cause a large temperature variation.”
At 5:30 Shaviv shows a diagram that shows the close correlation of a proxy of solar activity with a proxy for Earth’s climate. More similar close solar-climate relationships follow.
Shaviv concludes that the sensitivity of climate to increasing atmospheric CO2 is 1.0C to 1.5C/(doubling of CO2), much lower than the assumptions used in the computer climate models cited by the IPCC, which greatly exaggerate future global warming.
At this low level of climate sensitivity, there is NO dangerous human-made global warming or climate change crisis.
__________________________
Willie Soon’s 2019 video reaches similar conclusions – that the Sun is the primary driver of global climate, and not atmospheric CO2.
https://wattsupwiththat.com/2019/09/15/global-warming-fact-or-fiction-featuring-physicists-willie-soon-and-elliott-bloom/
Willie Soon’s best points start at 54:51, where he shows the Sun-Climate relationship and provides his conclusions.
There is a strong correlation between the Daily High Temperatures and the Solar Total Irradiance (54:51 of the video):
… in the USA (55:02),
Canada (55:16),
and Mexico (55:20).
_________________________
http://woodfortrees.org/plot/pmod/offset:-1360
Solar Total Irradiance is now close to 1360 W/m2, close to the estimated lows of the very-cold Dalton and Maunder Minimums. Atmospheric temperatures should be cooling in the near future – maybe they already are.
We know that the Sun is at the end Solar Cycle 24 (SC24), the weakest since the Dalton Minimum (circa 1800), and SC25 is also expected to be weak. We also know that both the Dalton Minimum and the Maunder Minimum (circa 1650-1700) were very cold periods that caused great human suffering.
I wrote in an article published 1Sept2002 in the Calgary Herald that stated:
“If [as we believe] solar activity is the main driver of surface temperature rather than CO2, we should begin the next cooling period by 2020 to 2030.”
That prediction was based of the end of the Gleissberg Cycle of ~80-90 years, dated from 1940, the beginning of the previous global cooling period from ~1940 to 1977.
Since about 2013, I have published that global cooling will start by 2020 or earlier. Cooling will start sporadically, in different locations.
Planting of grains in the Great Plains of North America was one month late in both 2018 and 2019. Summer was warm in 2018 and the grain crop was successful. However spring was late and wet in 2019, and much of the huge USA corn crop was never planted due to wet ground; then the summer was cool and winter snow came early, resulting in huge crop failures.
Thousands of record cold temperatures were experienced in North America in October 2019, and temperatures in Britain and parts of northern Europe were also extremely cold.
Recent analysis of the 2019 harvest failure is here:
THE REAL CLIMATE CRISIS IS NOT GLOBAL WARMING, IT IS COOLING, AND IT MAY HAVE ALREADY STARTED
By Allan M.R. MacRae and Joseph D’Aleo, October 27, 2019
https://wattsupwiththat.com/2019/10/27/the-real-climate-crisis-is-not-global-warming-it-is-cooling-and-it-may-have-already-started/
GROWING SEASON CHALLENGES FROM START TO FINISH
By Joseph D’Aleo, CCM, AMS Fellow, Co–‐chief Meteorologist at Weatherbell.com, Nov 18, 2019
https://thsresearch.files.wordpress.com/2019/11/growing-season-challenges-from-start-to-finish.pdf
Bundle up – it’s getting colder out there.
In the US, the situation with yields and production of the major grain crops was better than might have been supposed considering all the problems.
For corn yield per acre and total production came in at the 6th highest ever.
In any year prior to 2014, 2019 totals would have been a record smashing year.
Farmers are a resourceful lot, and not being able to plant corn does not mean those fields went unplanted, typically.
I am not saying it was a wonderful year, but it was hardly a disaster for the US on the whole.
Futures and spot prices reflect this. They are low by historical comparisons with many recent years. Since 2014 the price of corn has not moved much, again as compared to many of the years in the last ten.
Corn production (I am not sure if and by how much these numbers may be revised in coming months) is given by the USDA as 13.7 billion bushels for 2019. Well shy of the record of 15.1 billion bushels in 2016, but 13.7 would have been a record smashing harvest in any year prior to 2013.
The spread between acres planted and acres harvest was a little wider than some years, but not by much, and was less than many other recent years (since 1999), with acres planted reported at 89.9 million acres and acres harvested at 81.8 million acres. This appears to be very similar than, AFAICT, every year this millennium. The map of acres harvested by state and the change from previous year, shown on a single map, has a bunch of states lower but a larger number of states higher than the previous year. Overall 75,000 acres were harvested in 2019 than in 2018.
This sort of pattern is typical…problems get large loud coverage and good news gets little if any.
Soybeans appear to be the same as corn by many metrics…sixth highest year ever in terms of acres planted (nearly all acres planted are harvested for beans: 76.5 planted and 75.6 harvested…narrower than most years), yield per acre, and total US production. Acreas planted were way down year over year, no doubt due to the China trade war. Future years will doubtlessly I am sure, more than make up for it once Trump has hammered things out. Prices for beans are low compared to nearly ever year in the past ten, although it has been a long bull market in bean prices. Current price of 922 per contract was only exceeded a handful of time from 1981 to 2008.
For wheat, 2019 continues a multidecadal down trend in acres planted, but yields are a completely different story, with durum wheat at 45.7 bushels per acres smashing the old record. Winter wheat and Spring Wheat were second highest yield on record, and very close to the record year for each.
Other field crops show similar numbers…some crops and excellent year, some average, some slightly below average but still near the sharply increasing trend lines seen in yields for all crops.
Total wheat production for the US was about average of what has been the case for the past 20 years…no trend seen.
Rice had a bang up year. Trends are up sharply for yield per acre, and 2019 was comparable to recent years and far above what was the best ever 10 years ago, although like wheat US has been planting less and less for several decades although increases in yield make up for it and it was an slightly lower than average year in terms of production.
Prices reflect all of these numbers…there are no shortages, and prices are not too high and not too low, compared to recent years. Consumers like low prices, and farmers like high prices.
No one is gonna go hungry on account of US crop yields.
Price of some things, like eggs and beef, are very low right now at retail outlets I shop at, and I have heard chicken would be very low if not for price fixing by the major producers.
It seems that when one part of the country has bad weather than interferes with planting or harvests, farmers in other places are able to anticipate or react, and plan accordingly to take advantage of a perception that prices will go higher, and if a lot of people do so, prices may wind up going lower or being a wash.
It will be very interesting to see how things go in coming years.
Large river floods can increase production in subsequent years, or lower costs, for several reasons.
Here are my sources for this info:
Prices:
https://www.cnbc.com/futures-and-commodities/
Crop info:
https://www.nass.usda.gov/Charts_and_Maps/Field_Crops/index.php
Maybe. But I’ve seen plenty of farmers online claiming the USDA are lying. I don’t know which to believe, but based on the experience with ‘global warming’ I tend to trust the farmers more than the government.
Up here in the Canadian Prairies, I read the other day that 10% of our crops haven’t been harvested yet. And some areas are much worse than that.
All of the numbers I am quoting are US only.
In the US, every year for the past 30 has had a large percentage of acres planted that were NOT harvested. But it tends to even out over the whole country for some reason, or perhaps more likely due to several reason and the law of large numbers.
The USDA link has graphs that extend over decades.
And given that the numbers are in accord with local extension office reports, and the totals are a compilation of numbers reported by numerous companies and individuals, I think it would be hard to fudge such numbers for the country as a whole, or even a whole state, let alone over many years and many decades.
The trendlines are solid.
County and state and University and farmers and wholesalers all would have to be lying over many generations of farmers and analysts for the numbers to be bogus.
Production data feeds directly into commodity market prices and contracts for delivered product.
I have followed agricultural production information for decades myself, but have spent little time keeping abreast of data from other countries, although it should be noted that many organizations around the world team up to give readily accessible data for the world and for any country, should one wish to look into it.
I wrote another post a little below here that is in moderation because it has a bunch of links included.
Individual farmers in the US in states as diverse as Virginia, Missouri, and Georgia are achieving yields in excess of 500 bushels per acre.
300 bushels was being grown by farmers around the country as long ago as the early 2000’s.
Here is my perspective on a report of 10% of crops not harvested: It is not uncommon for the number of unharvested acres to be 10% or more here in the US. 10% would be high for the US in recent years, but low for 20 years ago.
It seems for corn in the US as a whole, the absolute number of unharvested acres, not a percentage but a number of acres, has been remarkably constant for the past 20 years at around 7 or 8 million acres. So percentage-wise, the number of unharvested acres has been falling steadily as yields have increased steadily. Of course there is some inter-annual variation. 2012 was a bad year, with some 10 million out of ~93-94 million acres not harvested (mark one eyeball of graph, linked below):
https://www.nass.usda.gov/Charts_and_Maps/graphics/cornac.pdf
I tend to think there are mechanisms that keep anyone from lying much on agricultural numbers…not the least of which are crop insurance adjusters and commodity traders and hence the SEC.
@Nicholas McGinley
Commodities are regulated by CFTC (Commodity Futures Trading Commission).
Misinformation in commodities market is standard industry practice.
Just imagine how much kickback-money can be wired by friends of politicians putting bets based on misinformation spread to public. You need that money in a demcracy to win the elections next time.
Nicholas – see details in these two papers, referenced above.
There were good harvests in the USA SE and South in 2019, and lots of grain in storage so prices did not escalate – but there were big crop losses across the Great Plains. Also lots of that grain will be feed grade only, if they do get it off the fields.
THE REAL CLIMATE CRISIS IS NOT GLOBAL WARMING, IT IS COOLING, AND IT MAY HAVE ALREADY STARTED
By Allan M.R. MacRae and Joseph D’Aleo, October 27, 2019
https://wattsupwiththat.com/2019/10/27/the-real-climate-crisis-is-not-global-warming-it-is-cooling-and-it-may-have-already-started/
GROWING SEASON CHALLENGES FROM START TO FINISH
By Joseph D’Aleo, CCM, AMS Fellow, Co–‐chief Meteorologist at Weatherbell.com, Nov 18, 2019
https://thsresearch.files.wordpress.com/2019/11/growing-season-challenges-from-start-to-finish.pdf
Yes, good point about the quality of the harvest.
I had read some accounts of 2019 being a far higher percent than usual of low quality grain.
And for sure that large areas had a terrible year.
Honestly after all the bad news since last spring I was surprised to see these numbers. I would have guessed we would see far worse numbers, and was wondering in the early fall if there might be very bad weather and something truly horrendous.
Like a possible complete failure of entire states to mature.
The crop was very late to mature in Iowa and adjacent states, and something like a record cold snap in September might have been calamitous.
I wonder if the bad quality stuff might also still be ok for ethanol?
Stock your pantry, David S. Growing seasons may shorten.
The good news is that, speaking only for the US now, we have a lot of agricultural temperature zones, and there are a lot of possible crops to plant and seed choices within a crop.
The trend lines in yield and production remain solidly up, and we just had the first year since 2014 that was not far above the trendlines.
Since the trendlines are linear moving averages, logically every year cannot be above the trendline.
And many years way above the trendline, which we just had, moves the trendline upwards.
So even though we are below trendlines, the actual numbers are so high they would have been record smashing just 6 years ago!
And nothing was very far below trend.
Not even as much below as most of the previous 5 years were above.
And looking at 30 years of data, it is highly unusual to ever have 5 years in a row far above the trendlines.
More typically year far above or below trend are immediately followed by a return to the mean or a sharp divergence the other way.
If it stays wet and cool for any extended length of time, growers will compensate by changing what they grow, and the corn belt will likely shift south some.
Also by a happy bit of good fortune, or maybe years of knowing how to keep growing enough food, when conditions are bad for one crop, those same conditions will be OK or even beneficial for something else.
Those trendlines have not be heading in one direction for many decades in a row by coincidence.
A combination of higher CO2 and improvements in seeds, techniques and knowledge have kept it that way.
The percentage of increases in the past 30 years is jaw dropping.
Not the least reason for which it is amazing, is because 30 years ago, we were not exactly stupid and the yields were already at the top of a very long and sharp uptrend.
Prior to 1940, 35 bushels per acre would have been a record.
Between the late 1930s and late 1950s, the trend was solidly up and a bad year in that time was above 35 bushels per acre.
By 1950 yields were near or above 40 every year, and must have seemed miraculous to old timers who had seen decade after decade of yields topping out under 35.
Around 1958 everything changed dramatically, and the trendlines shot rapidly up on a whole new trajectory.
By 1962 yields were never again below 60.
By 1970 years with close to and then above 80 appeared.
By the late 1970s years close to and then above 100 were achieved for the first time.
By 1989, yields close to 120 were occurring regularly.
The pace of improvements in yearly yields increased more sharply, although so to did variability.
The higher the numbers have gone, the larger the amount between a good and a bad year, although the overall increases were so fast that bad years were still great by standards of a few years prior.
1988 was far below trend, but it would have been a record year for yields prior to 1970.
1995 was the last time yields were as low as ~100 (slightly above), but within a few years the first harvest of 140 bushels per acre was achieved.
This year 167 bushels per acres was below trend!
2017 and 2018 had yields around 176 or so.
Source:
https://www.agry.purdue.edu/ext/corn/news/timeless/YieldTrends.html
How high can the numbers go?
Well, it needs to be pointed out that these numbers are all averages for the entire country.
What about the records set by individual farmers in a given season?
Where are those records in recent years?
Hold on to your hat if you never knew about any of this, because individual farmers have for many years been achieving yields far in excess of national average.
Several times more!
In 2003 a guy grew 322 bushels per acre on his contest plot to win that years record.
“The short answer is, “Yes!” Many growers are producing yields over 300 bu/acre every year. Some of these producers are represented in the National Corn Growers Yield Contest every year. Contest winners from across the country typically produce between 250 to 350 bushels per acre per year. In 2006, seven of the 27 national winners produced over 300 bu/acre with the highest yield of 347 bu/acre coming from Purdy, MO. National contest winners have rarely yielded more than 350 bu/acre, yet yields of 360-370 bu/acre have been documented. Yields of 300 bu/acre are possible with today’s genetics, excellent management, and stress-free environments. The difficulty is in producing yields of this caliber on a large scale. Unfortunately, most producers do not have the right combination of these three factors to produce 300 bushels per acre.
Iowa’s average corn yield was 166 bu/acre in 2006, which is just slightly above the 30-year trend line. Our highest average yield was 181 bu/acre in 2004. Iowa is increasing yield at approximately 2 bushels per acre per year”
From a Feb 2007 article:
https://crops.extension.iastate.edu/encyclopedia/are-we-capable-producing-300-buacre-corn-yields
In 2017 he grew over 542 bushels per acre on his contest plot!
The guy who did this is farming land in Virginia that was first cultivated in 1609 and has been farmed ever since!
His farm includes land that was part of the original Jamestown colony Mainland Farms.
Source:
https://www.morningagclips.com/va-farmer-remains-corn-wars-record-holder/
Here is more from that guy, David Hula, in 2018:
”
In the 2017 National Corn Growers Association Yield Contest, Charles City, Va. farmer David Hula scored the highest yield ever: a whopping 542.270 bushels per acre. At this year’s North Carolina Commodities Conference in Durham Jan. 11 he shared some of the steps that got him there.
Among his keys to success: a micronutrient cocktail, a planting depth of 1 ¾ inches and tissue sampling. All of Hula’s ground is no-till or “never till” as he puts it and job one is striving for even emergence.
Hula farms with his brothers John and Jeff. David’s son Craig is also involved. The brothers are the third generation of Hulas to run Renwood Farms that provides high-quality cereal and soybean seed to farmers throughout the Southeast and Mid-Atlantic.
Hula’s record breaking entry was in the contest’s strip-till/no-till irrigated division. He achieved the top yield in the contest with the hybrid Pioneer P1197 AM. Hula’s son Craig took second place in the same division with a yield of 529.1376 with the hybrid DEKALB DKC6744RIB, and Hula’s brother Johnny placed third in the division with a yield of 504.6890 with the hybrid Progeny PGY5115VT2P.
“We don’t have a magic piece of dirt. We’re farming fine sandy loam soils. We have a pretty deep soil profile, but it is fine sandy loam. Because of our sandy soils and lack of manure our nutrient levels are not excessively high,” Hula said at the Durham conference.
“Your goal should be to have enough nutrients available to your crop in a form in which the crop can use it and to assure this we use tissue sampling, That’s how we manage our nutrients. We give it a baseline and then we predict. We have been pulling tissue samples on a weekly basis for10 years now,” he said.
Increasing kernel count and influencing the growth of the ear is vital. Hula says the use of a micronutrient cocktail that includes copper, iron, boron, zinc, manganese and molybdenum is vital for getting there. The Hulas apply the micronutrient cocktail at V-4 on all of their acreage.
“On high-yielding environments it is a standalone application with some humic acids, carbon source and PGRs, and on regular production it is tank mixed with our herbicides,” Hula said.
The Hulas like to keep their soil pH closer to 6 rather than at 6.5 that is common in the Midwest. They make a lime application in front of their crop only when the pH dips below 5.8. They apply lime once every three to four years. Hula notes that they make micronutrient applications to assure availability despite the soil pH.
Potash is a must for big yields and the Hulas apply potash in front of their corn crop. “Corn is a big luxury consumer of potash. It’s just going to soak it up. It takes almost as much potash as nitrogen, almost a one-to-one ratio,” Hula said.
Corn will use the potash and then release it to small grains and soybeans which the Hulas plant following corn. They apply 200 to 250 pounds of potash per acre based on soil sampling. The Hulas like to add fertilizer in furrow and also use starter.
The Hulas strive to make their crop nutritionally balanced, which is why tissue sampling is important. They use starter fertilizer and also add fertilizer in furrow. In addition to applying the micronutrient cocktail at V-4, they put down five gallons of 3-18-18 foliar fertilizer at V-5 and a side-dress of 160-0-205. A the V-8 stage, they make a side-dress application of 80N-10S then at pre-VT stage they put on additional nitrogen and sulfur depending on their yield goal.
Hula says he likes entering the NCGA corn yield contest each year because it encourages him to try something new. Like many in the corn business, Hula sees even more potential for yield gains in the years to come. He notes that seed companies are making it easier for farmers to build yields by providing ever improving hybrids.
“I think the genetic potential for corn today is 800 bushels. There is no way Randy Dowdy (the Valdosta, Ga. grower who was the top finisher in the 2016 contest with a yield of 521 bushels per acre irrigated) or myself have captured all the genetic potential. If 800 is the actual number and the country averages170 bushels, we have a long way to go. I think down the road we as producers will tap into the higher yields, but it will take a team effort and favor from the good Lord,” he said.”
https://www.farmprogress.com/corn/micronutrient-cocktail-one-key-record-breaking-corn-yields
Here is more from David Hula and a video:
https://www.genesis.ag/world-record-corn-yield/
Thank you Nicholas for your highly informative post.
Boy, that contest production level has gone up a lot since the last time I looked (which was a while back!). 542 bushels per acres on the contest plot? That is one well-done test plot!!
It is amazing.
And these are not tiny plots.
Not like one or a few acres, but plots of four hundred acres for David Hula and his brothers and son.
They have 4000 acres and it seems they plant in 400 acre plots and rotate with beans after corn.
One of the newer improvements besides having a very well planned and considered fertilization schedule, is the GPS units on the combines. They can use data about each row and each acre to adjust the amount of fertilizer applied as they drive it down the rows. So computers, GPS, satellite info on nutrient levels, weakly tissue sampling and testing, and detailed nutrient profile for each row of his field, and a combine that can automatically adjust the application in real time.
I am going to see what the contest rules are for plot size for it to count. I expect it has to be a sizable area. 440 acres is one square mile.
Correction: There are 640 acres in a square mile.
Yes, thank you.
640, not 440.
Mods, I have a comment in moderation here.
Thanks.
It is already warmer, according to every other data set except Henry’s.
It’s going to get warmer.
“How does that effect climate?”
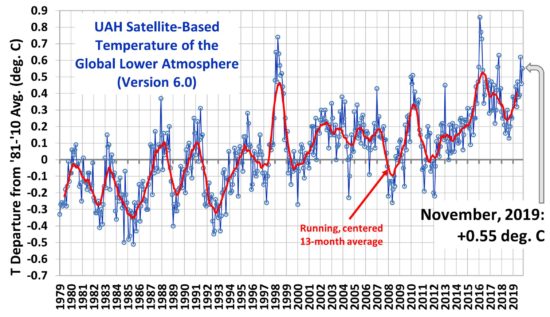
Sunspots? Negligible. As we’ve “plunged” into this horrifying minimum, global temperature rise continues unabated.
Loydo, oh, shit, I’ll burn, I’LL BURN !! NO chance to ESCAPE !! Give me our CO2 extinguisher, NOW !!
You’re gonna die Loydo – and it’s gonna be just awful. It’s going to be even worse than you even imagined. Keep fretting.
COP25 failed and COP26 is dead meeting walking and the majority of us don’t care so he really is doomed to a very miserable last few years of his life.
Group therapy session for doomsters isn’t it? Heard there was 26,000 of them this year and many of the same old sad faces so it doesn’t seem to be very effective therapy. Bringing along children is a worrying development for the mainstream community and where are our child protection authorities at with that?
Lyodo, if you believe anything you hear from climate hysterics…then I have a nice bridge to sell you in Sydney. There was very little sunspot activity during the Little ice age, and as soon as the sun rebooted…the heat came back and we continue to warm back to a normal level until today…what will happen from here is a mystery cause no one really knows. But we are near the end of the Holocene interglacial so one of these minimums will tip us back into refrigerator mode.
Our position in regards the sun and our axis tilt and shape of our orbit also play a part in this… our magnetic poles are moving very quickly now and our axis is becoming more acute etc will the next little ice age come soon, or go big?
Why does Lyodo believe the highly discredited official weather services? That have been caught out many times lying about the homogenized data sets? Even the Paris IPCC Statement disagrees with them. And to Henry, I would take your set any day mate, you probably haven’t homogenized the low temp. extremes out of the set, or exaggerated the highs.
As I say, no-one really knows what will happen from here, “they” predicted a higher minimum during C24 and were dead wrong and I see by the above chart they are doing it again…we are experiencing something out of the norm here and if the next cycle is even lower…well I am a lot more concerned that we could slide into another ice age of some size or other much more than I am about bloody bullshit global warming. Global warming that didn’t happen at 20+ times our current CO2 levels by the way….
The only warming over the last 20 years was the recent El Nino, since that El Nino temperatures have been falling steadily.
Stop making stuff up Mark, even the coolest outlier shows a recent rise back above the long term trend.
Sunspot activity has been “falling steadily” for 50 years, 80 if you ignore a lowish peak for cycle 20.

So the minute cooling that could be expected from that decline has been completely overwhelmed by something. Any guesses?
Well loydo the 2016 el Nino event raised temps to 0.89c this was a steep spike and dropped at the same rate a downward trend that in 2018 was very low .the difference between the low and high, post 2018 is half a degree c
It is not linear eg, the last 3 temp readings show two – readings to one + I dont see anything driving a + trend or unexplained ,normal variation, natural variation. I would of thought if c02 was playing a part the trend would be up. Mark is correct ,post 2016 temps have nowhere near gained the 2016 event which was a natural event.
One of your better posts.
Fascinating how any data that doesn’t conform to Loydo’s religion is declared to be a lie.
PS: I didn’t say anything regarding sun spots and temperature, so why did Loydo feel the need to drag that subject in? Desperate perhaps?
Unicorn farts? There’s just as much proof as for any other reason.
Loydo
For many of us here, the point is not that there is no warming, nor that CO2 is not a greenhouse gas, but that the warming of the last 50 years when CO2 has been rising faster, the warming rate is minimally greater if at all when compared to the 1910-40 period. The absence of much accelerated warming is contrary to all of the models used to predict catastrophic global warming from back in the 1980’s and 90’s, and indicates they need major overhaul.
Either
1. the physics of greenhouse gasses is more complicated than the models pretend to know (eg there may be saturation effects resulting in declining significance of continuing rise of CO2) or…
2. the presumed large positive feedbacks from rising H2O in the air consequent to the rising temps from CO2 are wrong (eg clouds may be a net negative feedback) or…
3. other negative feedbacks are more powerful than the models allow (eg the convective transport of heat energy from near surface to high atmosphere well above most of the CO2 via thunderstorms and other updrafting winds. Convective transport of heat above most of the CO2 would decrease its GHG effect, like sleeping on a blanket instead of under it.)
In any case, Lloyd, I hope you can sleep well, knowing that the actual real-world data support only modest warming at most and not any near-term catastrophe.
“the warming rate is minimally greater if at all when compared to the 1910-40 period.”
So nothing much else is controversial? Alas, this too is incorrect. Heating rate is now almost double the early part of last century.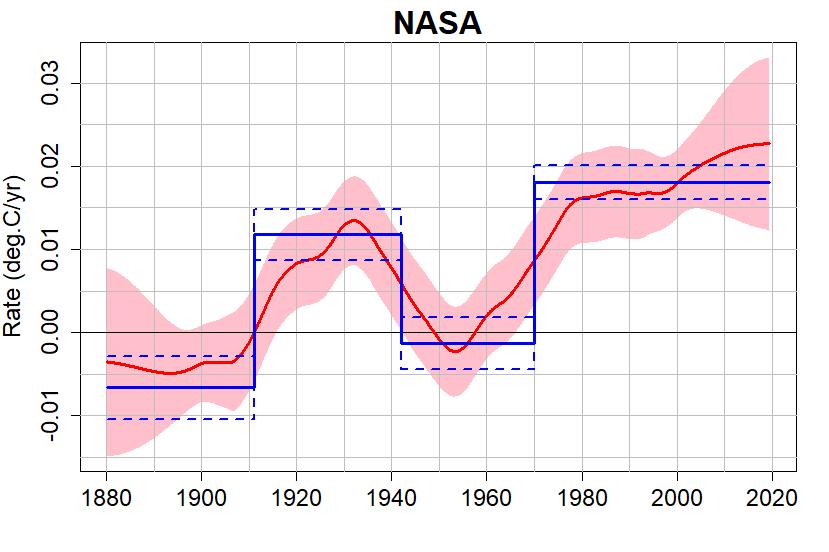 ?w=500&h=333
“It is already warmer, according to every other data set except Henry’s.
It’s going to get warmer.”
A slight temperature shift globally means squat. But a loss of several degrees for critical weeks of the planting year over land can be crucial. The million dollar question is how a small shift in global temperature can do that? Perhaps not global temp but sun (or ocean volcanic heating) effects on jet stream stability?
The empirical data shows a 10-15 year delay from the sun going quiet for an extended period and the climate cooling.
But, we are already 11 years past 2008 so: if the theory is correct, we need to be seeing cooberating cooling in the next couple years.
There is a complex interplay between solar uv, volcanoes and ozone in the stratosphere. It drives changes in the brewer dobson circulation that effect both trade winds and the stratospheric polar vortexes. At the moment the solar calm creates a slow down in trade winds that causes El Nino, and weaker polar vortex that allow cold outbreaks. The increase in solar activity will trigger la nina.
Uhh yeah…we live on a waterworld…takes time for that heat to dissipate from the bathtub.
The sun’s magnetic field shields the Earth from Cosmic Rays coming from deep space. During a minimum, the field is weaker allowing more Cosmic Rays to hit Earth’s atmosphere creating high altitude clouds that reflects sunlight, cooling the Earth. The longer and deeper the minimum, the greater the possibility we could be entering a cooling phase for the next few decades.
The Svensmark Theory:
https://wattsupwiththat.com/2017/12/19/new-svensmark-paper-the-missing-link-between-cosmic-rays-clouds-and-climate-on-earth/
no effect. in terms of watts the sun is nearly constant. maybe .1 C cooler.
plot temperature versus sunspots.
no correlation.
That’s right mosher we see no warming plotted against sun spotts ,however a spotless sun like SC24 is already showing cooling .
If you look ate the “true earth TSI” you realise that the sun is all, but not constant, at least for “us earthlings”.
True Earth TSI
You will find both values here
A further look at Tim Cullen: The Problem with TSI – Total Solar Irradiance will show you, that TSI is ≠ TSI
Thanks for showing us the mark of a true natural climate denier Mosher. It’s always useful for the rest of us to be able to identify the science deniers, when we need to weed out those worthless comments.
Catastrophic climate speculation as poetry, appropriately by Robert Frost.
Some say the world will end in fire,
Some say in ice.
From what I’ve tasted of desire
I hold with those who favor fire.
But if it had to perish twice,
I think I know enough of hate
To say that for destruction ice
Is also great
And would suffice.
It is going to get colder.
It is already colder, according to my own data set.
My data set does not really show me something allready. But maybe i have to change to something real instead off coffee-grind/goat entrails/NOAA data sets.
For increased reliability, use brand name goat entrails.
Probably attributable to CO2.
Must be. Everything else is, or Trump, or Brexit……
Or according to Svensmark with some confirmation by Kirby and the CLOUD Project, more intense cosmic rays create more cloud condensation nuclei and then more cloud cover and then colder temps.
That’s right. CO2 leaking from fossil fuels into space is decreasing the fusionability of the sun.
Sting will be disappointed. There’s no black spot on the sun today, and it’s the same old thing as yesterday.
+1
There is still no evidence of an overall global cooling trend. With sea surface temperatures well above normal , it seems unlikely there will be a marked cooling in the next few years.
I wish we had better long term data on jet stream behavior in relation to solar radiation. I believe that wind patterns are something that will be a useful field of study for generations.
@Jean
https://www.nature.com/news/2010/100414/full/news.2010.184.html
“Lockwood says that the pattern is related to the effect of ultraviolet light on Earth’s stratosphere, located about 20–50 kilometres above the surface. Ultraviolet light from the Sun is absorbed by ozone in the stratosphere, protecting the planet’s surface but heating the stratosphere in the process. The effect is largest in the tropics, where sunlight is strongest, and the temperature gradients set up a global pattern of upper-atmosphere winds, including the Northern and Southern Hemisphere jet streams.”
UV radiation strikes 02 and produces single molecules of oxygen, which attach to O2 producing O3, ozone. I get that.
However, does ozone reflect UV or is UV consumed when dividing O2?
Two different scenarios which I have never seen explained.
UV is transformed into heat (Chapman cycle)
If I understand that right 😀
PS: – sorry for missing link
https://earthobservatory.nasa.gov/features/Ozone/ozone_2.php
Bruce, IMHO, my understanding :
The pulsing polar holes of the ozone are still regarded as evidence of its depletion from human activity and remains one of the chapters in the man-made global warming scary narrative nonsense.
We all know some industrial compounds (chlorofluorocarbons or CFC’s) chemically react with the O3 molecule of the ozone layer of the stratosphere thus “depleting” it. But there are other explanations.
The ozone layer is relatively thin (at 1 atm it would be less than 1/8 of an inch thick) and in a constant state of replenishment as well as depletion. 12 to 25 miles up high energy UV splits the O2 molecule into two atomic O1 molecules that then combine with O2 to form the unstable, temporary O3 ozone molecule which absorbs low energy UV, thus warming the stratosphere.
It is now understood, or needs be understood the main reasons for the changing polar ozone hole sizes are natural and include the seasonal lack of light, the atmospheric fluid dynamics of the polar vortices, fluctuations with naturally occurring nitrous oxide and most importantly, the solar variances in UV radiation.
I understand your comments. A lack of sunlight prevents Ozone production. At -50c ozone depletes in three months. Antarctic vs Arctic weather patterns explain the “hole” to the south but not to the north.
The “hole” not being a hole at all but a seasonal reduction from 280 to 180 Dobson units.
I concur with your thoughts. Thank you.
An oxygen molecule absorbs a photon of UV (less than 240nm) creating two triplet state oxygen atoms the energy of the photon being converted into the excess energy of the individual oxygen atoms. An excited triplet state atom which collides with an oxygen molecule leads to an excited ozone molecule, collisions with other molecules such as nitrogen remove this excess energy in the form of kinetic energy.
The ozone molecules can absorb UV below 320nm which causes the dissociation of the ozone into an oxygen molecule and an excited singlet state oxygen atom.
To terminate this chain of reactions another reaction occurs which is the reaction of ozone with an oxygen atom to form two oxygen molecules. Ultimately the incoming UV energy creates a steady state concentration of ozone and a release of excess energy in the form of heat to the atmosphere.
Bruce December 16, 2019 at 6:56 pm
I understand your comments. A lack of sunlight prevents Ozone production.
Yes but lack of sunlight also prevents ozone dissociation due to absorption of UV. Consequently during the winter over the poles ozone concentration stays constant, it is only when sunlight returns in the spring that ozone is destroyed (catalysed by the presence of Cl atoms). Later as more high energy photons reach the polar stratosphere the rate of creation of ozone increases and the minimum is passed. This year an exceptionally warm S polar stratosphere prevented the accumulation of Cl due to PSC formation and the ozone level was much higher than usual since the 80’s.
“… This year an exceptionally warm S polar stratosphere prevented the accumulation of Cl due to PSC formation and the ozone level was much higher than usual since the 80’s. …”
—
Source please.
(sorry I’m late to this discussion)
The SSW warming did not begin until the end of the last week of August 2019. The depletion process typically commences from about the middle of June, so a warmer stratosphere in late Aug to early September had nothing to do with the lack of depletion prior to that.
So another mechanism was involved in the lack of depletion this year.
Take a look at this –
https://notrickszone.com/2019/12/15/ocean-cycles-at-work-data-from-japan-meteorology-agency-show-northern-coastal-europe-november-cooling/
Note the “untampered data” comment.
Thanks for the link, A C.
It does look like things are cooling off a little. I personally prefer warm weather but thinking about it, I lived through the cool 1970’s and although there were a few monster snow storms during that time, the general weather was not much different from normal. Humans adapted very well to this slight cooling.
The real problem in a cooling world is the effect this will have on crops, causing shorter growing seasons which may not produce enough to feed everyone on Earth. A lot of people may have to take up gardening. 🙂
Mr. Toole: “With sea surface temperatures well above normal….” Is that from NOAA? Based on the coffee grounds or the goat guts? H/t Willy.
Did you wonder what is “normal”, or are you just a Toole?
We can trust ocean temp data about the same as we can trust NASA’s annually adjustamicated GAST graphs.
Accurate to less than a tenth of a degree back to the 19th century!
It would be hysterically funny if it was all just a matter of argumentation.
And, of course, anytime they find a lack of warming, they “correct” it.
I do not think they do any correcting when a number comes back warmer than expected.
https://earthobservatory.nasa.gov/features/OceanCooling
IMO they are proven liars.
Well if we can’t trust any of the official sea surface temperature data then how will we know when it’s getting cooler? Maybe we are allowed to believe them when they show falling temperatures?
The problem is that people with an agenda who have proved themselves untrustworthy and regularly make highly problematic adjustments to collected data, which coincidently always turns any result or record that is contrary to their dubious ideas, into a result or record that fits perfectly with their assertions! Golly, how convenient for them.
Some of the people have erased any record of the original data sets after they changed them.
So they are worthless for any unbiased scientific purpose at all, and maybe irretrievably so.
But we do have a wealth of data showing many of the changes, as well as records of what was believed by everyone in the world to be good records, from the years prior to the advent of CAGW and global warming alarmism, as well as plenty of compilations and graphs and studies in the period between the advent (1988 or so) and when the wheels really flew off the cart around the turn of the millennium or so.
Interestingly these old records and original data sets show a very coherent picture across a wide variety of information, and this picture is in perfect comportment with historical texts and articles and papers, as well as first hand accounts of various explorers and travelers and investigators, over more than a century.
Sprinkled among these old records, articles, papers, are a steady stream of the same type of alarmist panic mongers saying what is in many cases exactly the same things as todays panic mongers. Plus an ice age scare.
Prior to changing the data sets and becoming warmistas, there are many climate researchers on record as all agreeing that at the end of the 1980s, the world had not warmed overall for the entirety of the 20th century.
The cooling from the late 1940s had erased the warming of the first half of the 20th century. Karl, Hansen, Schneider, Rasool…and plenty of others.
But now official government agency graphs show very steady warming for the past 100+ year, and the graphs are adjusted more and more every year!
It is beyond any doubt that CAGW and climate alarmism is a made up heap of streaming crap.
Chapter and verse, it is a compendium of lies and data fraud, and just plain making stuff up, liberally topped with all manner of ridiculous exaggerations and doomsday cult panic mongering.
“it seems unlikely there will be a marked cooling in the next few years.”
Do you have crystal ball?
And there is also no signs of the Global affect of the LIA
Except for
Cooling in Europe
Cooling in North America
Glacial growth in Fiji
Glacial expansion in the Chilean Andes
Glacial spread on Kilimanjaro
Glacial Growth in Nepal
Cooling in South Africa
Frost Faires on the Thames
Shorten growing seasons in Australia
What is normal?
Seamus – You say that sea surface temperatures are well above “normal.” Define “normal.”
With specificity.
And why…
Despite ocean temperatures, we see marked cooling every year. It’s called winter. Yes I know what causes winter. I’m just pointing out that ocean temps are not the be-all end-all to what the final weather is. The sun plays a dominant role. That should be as clear as night and day, literally.
Well above normal translates to about 0.03 degrees above the average of the last few decades.
Not that we can actually measure the ocean to that kind of accuracy.
For the benefit of Seamus O Toole who appears to be drinking the cool-aid….todays map of the sea surface temp anomalies…pretty much stable with warm and cool spots as per average, except for the poles…which are quite a lot colder than average. I have been watching the SST anomalies for over a decade now and the Antarctic has always been like it is now or usually even more blue, so I guess when they lie about the warming Antarctic waters they are referring to the small areas where it has gone back to average white…wont last, never does, the Antarctic is in a cooling trend, could be ocean currents? Could be the tilt of the planets axis? The Nth has generally more warm anomalies than the Sth for sure…Dunno. No-one does. The “science” is very far from being “settled,” that is simply another alarmist lie to avoid embarrassing questions and the debate we are still awaiting.
https://www.eldersweather.com.au/climimage.jsp?i=sstag
Seamus is right. There is no evidence of a cooling trend (or warming trend) for the last couple of decades. We need to avoid thinking that the sun is the only factor in the global climate. That’s just as bad as thinking CO2 is the only factor. The biggest swings in global temperature are due to ENSO which is an ocean cycle.
The solar minimum represents a direct reduction in solar energy of around .1%. It’s not big. The oceans contain over 1000x the energy of the atmosphere so small changes in the release of energy will have big effects such as what we see with ENSO.
Since the energy in the oceans originally comes from the sun, some purists will still came the sun is responsible for the changes. While that is somewhat true, it does not determine the timing of the energy release and hence what might occur in the future. Those appear to be based on earthly factors.
While we are now in a solar minimum, we are also under +AMO and +PDO conditions as well a slightly positive ENSO index and left over warming from the recent El Nino. These could completely negative the cooling that some people are looking for. We’ve had +AMO conditions since the 1990s and +PDO for about 75% of the last 40 years. These could be the entire reason we’ve seen warming over this period.
Where are we going from here? That’s the big question. With the recent solar cycle at a lower level this would suggest that ocean energy has not been replenished. The AMO and PDO are due to spend more time in their negative phases. One could see a situation with another low energy solar cycle coming where all these factors turn negative at the same time. This could result is some significant cooling back to levels last seen in the 1970s.
My operating Scientific Wild A** Guess for the last few years has been that there are 20 (or more) different factors that control climate. Many of them are poorly understood (or are flatout unknown) and they interact in ways that are even more poorly understood. GHGs are one factor, the Sun is another and so are several of the other thing get mentioned on this site (vulcanism, Milankovitch cycles, etc…). When enough of these factors are in the “up” position, we get warming. When enough are in the “down” position we get cooling. If they point all over the place, we just bubble along with no trend. However, they can only affect climate in concert with multiple other factor. NONE of them are powerful enough to drive climate on their own. Does that qualify me for a Nobel?
A beginners guide to GSMS
https://abruptearthchanges.com/2018/01/14/climate-change-grand-solar-minimum-and-cosmic-rays/
Little Ice Age anyone?
To early to call.
Chas, only if we get some significant volcanic events coinciding with the solar minimum. In a recent review paper in “Paleoceanography and Paleoclimartology” by Moffa -Sanchez et al
Variability in the Northern North Atlantic and Arctic Oceans Across the Last Two Millennia: A Review
https://doi.org/10.1029/2018PA003508 (open access)
Their comments (so far as North Atlantic and the LIA are concerned ) suggest a change in opinion in recent years from solar forcing being the major influence towards vocanic forcing, sustained or increased by the solar changes.
..” In these simulations with the CCSM3 model, the onset of the LIA follows mainly a large reduction in the total solar irradiance, with a marginal contribution from the strong volcanic eruptions in the fourteenth and fifteenth centuries. Other studies have also related colder and extended sea ice conditions in the North Atlantic and the Arctic to solar minima in simulations of the past millennium (Ammann et al., 2007; Landrum et al., 2012; Moffa‐Sanchez et al., 2014) reported that the amplitude of the solar variability used to force the model increases the magnitude of the associated climate changes, while suppressing the effects of other natural forcings like volcanism on climate. However, the potential role of the solar forcing in driving the LIA cooling is still highly debated, since latest evidence suggests that the amplitude in the first reconstructions of the solar forcing was overestimated (e.g., Foukal et al., 2006). Furthermore, detection‐attribution studies highlight a more important role of volcanic eruptions on large‐scale climate variability than solar variations (Atwood et al., 2015; Schurer et al., 2014), whose effect is hardly detected on the past Northern Hemisphere temperature changes (Schurer et al., 2014). “..
Of course volcanic activity plays a part, the part you omit is CRF because of solar minimums increases volcanic activity
https://www.sciencedirect.com/science/article/abs/pii/S1342937X10001966
Interesting article B d. The review article mentioned (recent: Oct 2019) tends to give the impression that the “science is settled” , but the comments coming in on this post suggest there is much more to be found out. But the TSI differences are <1W/m^2 .
What about the spectrum?
More UV –> ocean heating.
More IR –> ocean cooling.
The Grand Experiment continues! I hope I’m alive to see the results at the Cycle 25 minimum.
That is, if the planet isn’t destroyed by catastrophic man made global warming in the next
12, 11.5,11 years…. };>)Click on my name
To get ideas
To get ideas….. of whether I’ll be alive then? Thanks… I have my own informed ideas. And I’m sure we will all have to admit we were a bit wrong, when we can actually look back at the reality of what occurred after the Cycle 25/26 minimum. The Grand Experiment continues, heedless of pontification and prognostication by mere humans. Place your bets, Gentlemen and Fair Ladies, if you dare! The great roulette wheel is spinning…….
Shhhhh… Keep it quiet or we’ll have to pay a tax for this too.
And in possibly related news, the USA averages about 3,000 avalanches per winter, already this winter (start of cold, not Dec. 21) there are 2,000 avalanches, according to CNN International. This, they are saying, has something to do with President Trump (?). Wow!
It’s not surprising that the number of avalanches in December are more than a proportionate share of the total avalanches for an entire winter. The first heavy snows on previously-bare ground at high altitude are often unstable, and lead to many avalanches early in the snow season. Later (January or February) snow that falls on packed-down “base” (as ski resorts call it) tends to adhere better to the base, and is less likely to cause avalanches.
Most late-season avalanches occur after a long dry spell (such as two or more snow-free weeks), when daytime warming (and partial melting) by the sun and re-freezing at night causes the slopes become icy, after which an accumulation of heavy snow on a slippery base can result in late-season avalanches.
During a winter with relatively evenly-spaced but light snowfalls, most of the avalanches will occur early in the winter, before the base has stabilized. A winter with widely-spaced but heavy snowfalls will have avalanches after each heavy snowfall.
The number of avalanches in December does not always indicate the total number of avalanches in a winter, if the snowfall pattern in January through March is greatly different than that in December.
Wanna bet?
During 2019 we’ve had instances where very tiny sunspots show up and go away in a couple of days which reduced the number of spotless days. I bet 1913 also had some of these which would have made it more an apples to apples comparison. We can now see every little hiccup the Sun makes with the solar telescopes and satellites that was not available 100 years ago.
Joe D’Aleo put out a summary on Weatherbell (paywalled) about things that have occurred during Solar Minimums. TSI is at it’s lowest since 1979. Lower geomagnetic favors blocking, lower solar flux translating to less ozone in low and mid latitudes and more snow most solar min winters.
Dr. Willie Soon indicates the Northern Hemisphere temperatures track TSI. The only thing we are missing is a volcano going off.
However the Oppenheimer Ranch Project found: “With the 80.6% occurrence of large scale global volcanic eruptions taking place (greater than VEI 5) during solar activity lows and with 87.5% occurring for the very largest (greater than VEI 6) eruptions during major solar minimums.
Put on your hardhats.
6.8 in the Philippines yesterday. Earthquake also attributed to increases in CRF
If there is a 10-12 year lag as some of proposed on the effect of solar minimums (or max) on longer term climate (not weather), the previous 2008/09 record is just materializing itself now in 2019. Perhaps it assists in maintaining the ‘pause’ in any rising temps, as we are essentially flat the last 20 years with little temp increase except as manipulated with adjustments which is how they keep making nearly every year now the 2nd or 3rd hottest ever. Especially when taking out the super El Nino’s of 1998 and 2016. If we used the alarmist methods of graphing, we are in a major cooling event since the El Nino of 2015/16. My bet is the pause continues, perhaps with some hotter summers and cooler winters. Maybe it all averages out on an annual basis, but the climate can be different in the various seasons and still report the same average annual temp. We don’t even understand natural variation within longer term climate cycles, so how anyone could believe that 2100 climate is going to be 3-5 degrees hotter is why I am a skeptic.
NOAA/NASA has stated that “there is no indication of an approaching “Maunder-type” minimum”
Really! How can they make that call?
Is there some way this could be the result of increasing CO2?
No
Oh I bet there is, and it will be the manmade component doing all the work
Discovered two days ago global warmests now think co2 a minor atmospheric gas current concentrations around 0.04% somehow makes it way to the sun and therefore cools the planet, you really couldn’t make this stuff up,unless your a global warmest, over 40 years of climate papers IPCC reports have never ever mentioned this very new phenomenon, you heard it here first folks c02 is now cooling the planet🤪
Cue the warmests with there new c02 weapon, “3 posts already”
“Is there some way this could be the result of increasing CO2?”
Definitely yes, given sufficient bought Lysenkoist mumbo-jumbo and a silent MSM.
Glad it’s finally official! Now about buying stuff ahead…. Oh, just go shopping and stock the pantry and the cupboards. And make sure you have your favorite beverages included in that.
It should be noted that April 2020 (+/- 6 months) includes since October 2019, so they are saying that the minimum could be in the rear mirror already.
Not looking that way though is it, https://www.nature.com/articles/s41598-019-45584-3
I don’t trust models about complex things not fully understood. She is likely to be wrong, like all those climate modelers.
But you cant prove she is wrong can you ,every thing so far agrees with zharkova you gave her a hard time last time we spoke, have you been upstaged? Do you have a vested interest in belittling this scientist? Any professional would not condemn a scientists work but you do!
Time will prove her wrong. In just 3-4 years or so. Perhaps even earlier. You don’t know many scientists, do you? As Leif says this is a blood sport.
Seems to me you have a vested interest in proving her wrong ,yet you cant do that so you bad mouth her very scientific ,I also asked you before who are you? What exactly qualifies you to condemn this scientist ,
” I dont know many scientists” wow you really are full of assumptions tonight , I’m sitting in the same room as one, we have plenty round to dinner once a week, and we are going to dinner at a professors place Wednesday night.
What it seems to you is irrelevant. Ask those scientists you know if in scientific disputes scientists attack each others work. History of science is full of really strong scientific disputes. For example the dispute over string theory being a scientific theory or not:
https://medium.com/starts-with-a-bang/why-string-theory-is-not-a-scientific-theory-9b3b2c2723ed
But it is relevant, you state she will be proved wrong , her projections so far have been bang on ,you refuse to state wether your acting in a professional capacity or not , until then you are no one calling out a named scientist, you have her at a extreme disadvantage by refusing to state your credentials , you have no credibility at all while remaining anonymous,
“As Leif says this is a blood sport.”
That’s too bad. Everyone loses for the egos of a few.
What projections? She published her model in 2015 when SC24 already had reached its maximum. Her model won’t be tested until SC25 shows its activity. And then it will fail. She should learn from the IPCC to not make predictions before 2100.
My credentials are of no concern here. She is not up against me. She is up against the polar field methods that has an extraordinarily good record of predicting and hincasting solar activity. I just happen to agree with what the Polar Fields method shows.
I think it’s time you told every one exactly who you are,particularly zharkova and any one else who you call out,its not about you it’s about allowing the recipient of your claims a right to reply , you have every one at a extreme disadvantage.
What you think is also irrelevant. I won’t do what you ask me to do and I will say whatever I wish about Zharkova’s or anybody else’s research. It is my opinion and I have the right to express it.
I find it funny that you think I shouldn’t criticize some scientist work when that is what nearly everybody does here at WUWT with warmunist scientists. It makes me think that it is you who has a personal reason to defend Zharkova. In any case, unlike you, I don’t care about your reasons. Only science matters to me here.
Again you miss the point IPCC science has been around a long time and shown to be wrong and deserves criticism because it’s wrong ,were as zharkovas latest work has been around for less than a year, yet you think she deserves the same contempt as the IPCC, that’s a fundemental mistake on your behalf, that’s why I say it does appear you have a vested interest in degrading her work.
No he doesn’t. They are free to come here and refute if they choose. His identity is irrelevant. Focus on the concepts, not the man. Javier is a little careless IMO by saying Zharkova is wrong; I would prefer if he said her conclusions (or whatever) are incorrect.
Yet that’s right Mr anonymous gets to argue without any credentials with a named scientist, do you understand the implications of your statement, let me enlighten you, who is he or is he a she? who does he work for? What interests does he as a agent or acting on behalf of some one as their agent gain? Why condemn a paper that’s not been given time to show if its correct or not? That’s the fundemental question ,he because he or she prefers to stay anonymous has no credentials .
Why does it matter? Why are you focusing on credentials? Focus on the science. Play the ball, not the man.
Playing the ball means all players get to play by demonising one player their contribution is downgraded ,its important zharkovas work is recognised and brought to the game , would you agree with that ? By continuing to say her work is wrong belittles a players chance. Her work is published in nature and deserves respect be it wrong ,right or indifferent .
https://www.nature.com/articles/s41598-019-45584-3
The article is extremely on topic for this article on watts up and deserves to be seen without some one demonising it. No one can say it’s wrong till its had time to show it’s wrong.
You are getting boring with your interest in my persona. How recently Zharkova’s work was published is irrelevant. Scientific hypotheses are right or wrong from start. I have given a lot of thought to this issue and Zharkova’s work has some failings. It has been shown that her model hindcast of past activity is wrong. Since solar activity has been decreasing for several decades there is a tendency for models to project a decrease. It is a bias. Besides the polar fields method has yet to fail so right now looks a lot more solid and it is saying the opposite to her.
I don’t understand why people get so enthusiastic about her hypothesis. A guess a lot of people wishes that solar activity becomes very low for long enough to kill climate alarmism. I can understand that but it is a bias. We have to look at what science says not at what we want it to say.
Until you can demonstrate with what authority you have on the subject , I surgest you mind your own business and allow others to make their own minds up,you talk of bias ,then you insinuate her paper is not science ,
That really does show your bias , what is it did you lose out to her on grant funding , lose a place at university
You have a axe to grind here, and by doing so your bringing debate into disrepute.
You are getting boring with your interest in my persona. How recently Zharkova’s work was published is irrelevant. Scientific hypotheses are right or wrong from start. I have given a lot of thought to this issue and Zharkova’s work has some failings. It has been shown that her model hindcast of past activity is wrong. Since solar activity has been decreasing for several decades there is a tendency for models to project a decrease. It is a bias. Besides the polar fields method has yet to fail so right now looks a lot more solid and it is saying the opposite to her.
I don’t understand why people get so enthusiastic about her hypothesis. A guess a lot of people wishes that solar activity becomes very low for long enough to end climate alarmism. I can understand that but it is a bias. We have to look at what science says not at what we want it to say.
A hypothesis has to be proven right or wrong , it is not wrong because you say so, here work has yet to be proved
Your are demonising her work and her name ,your not giving the lady a chance , all matters relating to solar cycles and their mechanisms should be brought to the table , it is not for you to pass judgment every one should have a chance to read her work, by playing down her work before it’s become known widely your in effect drawing attention away from her work and discouraging its debate. That’s disgraceful.
Yeah right! Wrong theories don’t deserve any respect. How much respect do you have for geocentric theories? Lamarckism? Catastrophism? Anthropogenic climate change will also sink into that category eventually. I don’t see people here paying much respect to “CO2 as a climate control knob” theories. And rightly so. In science if you are wrong you are nobody.
Again IPCC science has had 40 years to show if it’s right or wrong its models are theories that have shown to be wrong .zharkovas work is 6 months in not even starting till 2020. And yet you give the same analysis to both .
You definitly do have a vested interest in demonising this data.
Relax bd.
I do not see any badmouthing.
Expressing an opinion that someone will likely be wrong is not badmouthing as I understand the term.
Most call that a difference of opinion.
And obviously no one can prove whose predictions are wrong or right before the years have passed and the question is settled by reality.
Predictions are not reality.
Even the ones that price correct are still just predictions.
Javier has been commenting here for many years.
He has an opinion.
She has an opinion.
What is this nonsense about vested interests and proof?
This is a discussion, not a courtroom.
No one can prove anything in advance of the actual event.
Even a correct prediction might be right for the wrong reasons.
Lots of predictions have been made about the solar cycles.
Now we wait and see.
No one is right because of who they are.
Opining that someone will prove incorrect is tantamount to an effort to “condemn this scientist” in what universe?
Lots of people who are scientists are wrong all the time, and lots of laypersons are correct all the time.
We all know who is never wrong: People who do not take positions or make predictions of express an opinion.
Being wrong about an hypothesis does not make someone a bad scientist.
And getting all huffy does not place anyone on some moral high ground, anymore than having a contrary opinion makes anyone a bad person.
No one asked me, but I am gonna say anyway, and I hope you do not take my opinions the wrong way…but b.d. you seem to be making a while lot of hay out of one man’s opinion here.
Zharkova’s paper is very long, and I did not read the whole thing, but I did notice an extremely high occurrence of what some call weasel words…may, could, inferred, suspected, etc, as well as referring to speculative ideas as “findings”, and to various hypotheses as having been “shown” and such.
Page after page of assertions and thin logic and inferences on top of speculation in a dizzying plentitude.
And then predictions of temperatures of Earth 600 years out?
I mean seriously, what are the odds of all of the dozens if not hundreds of sequential ifs and coulds and such all leading to a correct conclusion?
I will not even add in the huge numbers of GAST assertions of past and future given as if they are precise and accurate and factual, rather than the speculative approximations or outright wild ads guessed they really are.
Proof?
Proof of an opinion of the work of someone else which is itself a tall jenga tower of maybes and what ifs?
Seriously?
As a matter of strange coincidence, I happen to know who Javier is. Who cares? If anonymous says 2 + 2 = 5, it can be proven to be incorrect.
Does this change when his/her identity is revealed? Ridiculous.
In the world of chess, this idea is explained: “play the board, not the person”.
We should respect a person’s request for privacy!
I’m going to have to rethink Hogwarts curriculum I was unaware they taught basic reading skills
My best guess has been for this minimum to end between July to September of 2020. I think the low will be around June/July. This was from several years back.
The minimum ended for SC24 in October with the reversal of the magnetic poles in the last sun spot, SC25 is being played as a minima or maxima depending on what source you go to.
The appearance of the first reversed polarity spots indicating cycle 25 was getting started is most commonly regarded as occurring in April of 2018, although at least one analyst has claimed a reverse polarity spot showed up in December of 2016.
Regardless, the beginning of one cycle always has broad overlap with the end of the previous one, with a fairly long period of time in which spots of both cycles are seen.
This overlap occurs during solar minimum.
The minimum is a period of time, not some precise moment.
Until activity increases at the end of the minimum, the minimum is ongoing, and how long it will last is speculative. The minimum is not over, because activity has not even begun to increase yet. And even a blip up may be a blip only, and be followed by a disrespecting of low activity. It can only be determined retroactively when the minimum is over, and when the period of lowest activity occurred.
The upshot is, there may still be a couple of years more of low counts and low solar activity.
No one knows, and there is wide disagreement between various researchers and agencies.
We’ve had 92 percent spotless days since May 19th.
The last time this happened was more than 100 years ago
when there were 93% spotless days from Feb 28 to Oct 24, 1913
books.google.com/books?id=SWdCAQAAIAAJ&pg=PA68&lpg=PA68&dq=daily+sunspot+number+1912&source=bl&ots=p-7Rhel4dI&sig=ACfU3U0YMpFQ0tdADTYYhiyI-qcWOWdEPQ&hl=en&ppis=_e&sa=X&ved=2ahUKEwiM-s7o6rrmAhWQxVkKHbaZCHAQ6AEwCnoECAoQAQ#v=onepage&q=daily%20sunspot%20number%201912&f=false
What about the record for consecutive blank days?
“Moreover, an international panel of scientists led by NOAA and NASA predicts that Solar Minimum could deepen even further, not reaching its lowest point until April of 2020.”
Fearless prediction right there. Having broken records , it might continue a smudge longer. Here I was thinking the sun was just looking for media attention.
We go back to the problem of dividing what is a continuous process according to an arbitrary calendar.
With 33 days without a sunspot this period makes it only to the 22nd position. Between 13 Sep – 24 Oct 1996 It was 42 days without a spot. Previous minimum had two periods of >30 days without spots.
http://www.sidc.be/silso/IMAGES/GRAPHICS/spotlessJJ/SC25_periods.png
And of course your observation is down to a arbitrary calender as well. It’s also the longest year without sunspots since 1913 according to your arbitrary, not a fan of minimums are you
Is it difficult for you to understand that if the change of year falls in the middle of the minimum, that minimum gets split between two years, so a shorter minimum that happens within a year can beat both of them? A fan of minima (plural of minimum), are you?
But we are not in the middle of any year,we see SC24 morth into SC 25 IN october when the magnetic flux reversed in the last weak sun spot observerd. But you knew that right, since then we have not seen any sunspot activity this maximum cycle will be less than SC23 and 24,
And yea man I’m a great fan
Well then if you are a fan you should know that the previous solar minimum took place in December 2008, so it was indeed split by the change of year. So far this minimum is behind the previous one in terms of spotless days. So the supposed record is not such yet. Whether it will be deeper or not remains to be seen.
Regarding SC25 it also remains to be seen. Leif is betting on more activity than SC24 and I am with him.
Nope number of sun spotless days is 270 not seen since 1913, you seem to be ignoring the fact the cycle changed in October to SC 25 I dont think you knew that and the mechanism of change .
Here you have the number of spotless days per minimum:
http://www.sidc.be/silso/IMAGES/GRAPHICS/spotlessJJ/SC25_SCvsNumber.png
That’s from October 3, so no, this minimum still hasn’t have more spotless days than the previous (>800). Whether it will have more or not I don’t know. It seems it is still missing more than 200 spotless days.
I really find that graph squeezed up and with no cycle numbers, must be for geeks! Still if I understand you correctly Sc 22 was just a10 year cycle nothing much of note even though it had a low sun spotless count. And so what ? The transition between 23 and 24 gave us much more to talk about, SC 22 NEVER had a year in its cycle compaired with this one.
That graph is from SILSO, the place where they curate the official international sunspot number. It shows the relationship between solar activity (green inverted), and number of spotless days at the solar minimum (red).
The graph shows that since 1818 there have been 7 solar minima with more spotless days than this one so far, including SC23-24.
The record claimed in the article doesn’t seem so impressive after all. But who knows. It ain’t over til it’s over.
I agree that calendar years are meaningless as a determinant of the depth of a cycle.
In any case there is a strong stochastic element involved…periods of unbroken streaks of spotless days likely provides nothing much in the way of insight.
Only when the minimum is clearly over can the number of spotless days be tallied and compared to other cycles.
Regarding the onset of 25…
One cycle does not change into another.
At solar minimum two cycles overlap.
The new one starts up with a spot every now and then while spots from the previous cycle are sputtering to an end…And this overlap is years long.
Start of 25 does not mean 24 ended.
And besides, the first spot of 25 was all that way back in April of 2018, more than a year and a half ago.
Perhaps even in December of 2016.
Since then there have been lots of 24 spots and some 25 spots.
But overall not many spots.And we only count ones on the side facing us.
Has a cycle started when we see a spot, or when the first reversed polarity spot forms whether we see it or not?
Logically us seeing it is somewhat random, and this not indicative of solar physics, necessarily.
A tree falling in an empty forest does make sound.
Just sayin’.
My opinion is the last observed sun spot showed a polarity shift ,that is a sign of one SC morthing into the next cycle , I’m not aware of chat that the invisible to eye sunspots can confirm a shift to SC25 ,theres also a lot of confusion wether SC25 will be a minima or maxima, in my opinion it will be a maxima cycle of very low intensity maybe less than SC24 ,other commentators on this thread have said as much and incidentally zharkovas agrees with as well. Other much more informed posters than me are stating another 1/2 low intensity SCs will confirm a GSM were as the article states and other commentators state we have dropped in GSM now,
I’m not taking sides , if the change of cycle can be confirmed its started as a low intensity cycle. It will be interesting to see what the next sunspot brings.
Predictions by solar experts are all over the map.
NASA itself has two entirely separate (or so it seems)subdivisions with entirely different predictions.
NASA Ames has issued a forecast that SC25 will be 30-50% lower than SC24.
NOAA-SRCC (with NASA and The International Solar Energy Society) is calling for a solar max sunspot number for SC25 of between 95 and 130. This seems to be a fence sit. They are guessing it will be about the same as SC24.
Zharkova predicts SC25 will be 80% of SC24.
Xu-J.C. et al (Chinese Academy of Science) predicts strong cycle, max sunspot number of between 152 and 184.
Ozguc, A. et al (Harvard) also predicts a very strong cycle at 154 plus or minus 12.
Several others predict various values intermediate between these.
This wikipedia page gives a summary and links to the sources:
https://en.wikipedia.org/wiki/Solar_cycle_25
It seems with the spread of forecasts by various expert bodies and individuals, some will be right and some wrong. If it is a whole lot weaker than 24, Ames will be right and everyone else wrong. If it is very high one or two forecasts will be in the ballpark.
Only if it is close to or the same as 24 will the majority be correct, using plus or minus 20% of the SC24 max to mean “close”.
I have no opinion and no idea. I am not convinced, after what happened 11 years ago, that anyone really has any idea and these might as well be guesses. Whoever gets their prediction closest to the actual value may be thought of as the new expert, but it is easily possible for a shotgun spread of guesses to have someone right but just by luck.
IMO no one knows.
Some clearly think they know, while others acknowledge that these models are hypotheses and the predictions are educated guesses at best.
Clearly a lot of people who think they know what they are talking about do not, or the predictions would not be in a range from weakest in hundreds of years (Ames) to a very strong cycle, one of the strongest in hundreds of years (Xu-J.C. et al).
As for when one cycle ends and another begins, it is clear they overlap.
Spots with polarity of the cycle that is ending drift off to zero, and before that occurs, spots from the next cycle with reversed polarity begin and gradually become more numerous.
The overlap period between the first spot of the coming cycle and the last spot of the ending cycle can be and typically is years long. Two years or so seems to be a common overlap.
Here is a WUWT article with an illustration showing this in a color coded format which shows each cycle’s spots as a separate color, making it very obvious what occurs. The illustration is right up top:
https://en.wikipedia.org/wiki/Solar_cycle_25
Yep I’m in no doubt there is a overlap , I’m also pretty sure the last sun spot was a sign of change/overlap as I said the next sunspot should be interesting, during the overlap when sunspots appear do we see a mix of polarity shifts? Yep there are a lot of opinions on were we are heading on this transition I think most on here who have a great deal of knowledge on the subject are in broad agreement it’s the transition period that varies
I thank you nicholas for taking the overview rather than a one direction view which is a lesson for all .
One of your links was missing coloured bar graph for transition
Oops I accidently posted the wiki page link twice.
Here is the WUWT article by Leif Svalgaard with the color graph of the last several solar cycles:
https://wattsupwiththat.com/2013/12/13/leif-svalgaard-at-agu-on-the-current-solar-cycle-none-of-us-alive-have-ever-seen-such-a-weak-cycle/
And the graph:

If you expand the magnification of Leif’s color graph, and look (for example) at where cycle 21 ends and cycle 22 begins, you can see that the first spots of cycle 22 (in red) appear just after the beginning of 1985. Way down at the bottom, just a few spots of red, indicating reversed polarity spots were seen. But at the same time spots from cycle 21 (in blue) were still occurring, and the last of these can be seen in the middle of 1988…almost to 1989. So for ever three years spots of both cycles were appearing.
That is what is happening now. These two cycles are far weaker and with such a long time between spots it will not be possible to know for sure when the last spot of cycle 24 will appear, but clearly spots from both 24 and 25 have been occurring for over a year and a half. This is not show on Leif’s graph because this article was from several years ago.
I will see if I can find a graph in color that is up to date.
The same thing can be seen in the transition from #22 to #23 (red to green). First cycle 23 (green) spot is seen around 1996 near beginning of the year. Last spot from cycle 22 (red) appears ~2 years later at the beginning of 1998.
Same approximately two year overlap seen between cycle 23 and cycle 24 (green to purple). First purple spot in 2008, last green spot after the beginning of 2010.
So for a few years at solar minimum, spots from each cycle occur.
This actually makes perfect sense according to the way I learned several decades ago what sunspots are and why the polarities reverse in a cycle. Trying to predict when the actual minimum is and how strong a cycle will be may be akin to guessing how many bolts of lighting will strike from a thunderstorm before it has even formed yet.
Or maybe it is nothing like that.
Predicting correctly one time in a row will not convince me either way, but eventually it may turn out to be the case that one or more of the people working on it have it figured out right.
Anyway, I found the link to Leif’s page with the color coded graphs, but the most recent months are very faint and hard to see clearly.

Here is a source for evidence of the first spots of #25.
Note that in addition to reversed polarity, the spots are at a much higher latitude.
At the beginning of every cycle, spots form in the mid latitudes of the Sun, and then migrate towards the equator as the cycle progresses.
http://www.stce.be/node/359
This was not, AFAICT, a visible spot, and so December of 2016 is iffy.
First spot visible with reversed polarity was April of 2018:
It is spot 12620 here:
https://sdoisgo.blogspot.com/2018/04/the-first-signs-of-solar-cycle-25.html
And more of them here. Note that in April and August 2018 spots of both cycles appeared at the same time and not too far away from each other.
https://www.universetoday.com/139833/are-we-witnessing-the-start-of-solar-cycle-25/
Nicholas thanks, the new graphs you reproduced clearly show the cross over period of around 2 years. within those cross over years we can see both types of sunspots ,as we proceed to the right of the cross over period the biase for the next SC should become apparent whilst at the same time cross referencing with the lattidude position ,to confirm the true start of the next SC ,of course we know if it’s a maxima or minama because the polarity shifts from the previous cycle. How am I doing?
only minimally
Very minimalist of you…
you 2 need to get a room and either duke it or sex it out.
IOW shut up.
Sure kid
I would like to ask a favor. Does anyone have a chart or a link to it about Mesosphere temperatures.
Attention: I do not mean thermosphere.
Thanks.
Try to start here::
https://catalog.data.gov/dataset/earth-mesosphere-temperature-measurements-via-sodium-lidar
Trump caused the naked sun (symbolic of his womanizing), and Trump causes climate change (which ultimately is racist activity).
That’s a good excuse to get him outta there. His crimes are against man-, uh, … huma-, uh, … humunkind.
Is it possible to tax the sun ?
We should send there a Climate Crisis delegation.
Go to Britain and ask the Tax Man
Silly question. Everything can be taxed. For example, on days when the sun shines, you will be taxed. But also on cloudy days, you will be taxed for your enjoyment of clouds. On days with only a few clouds, the sun tax and the cloud tax will balance to maintain an appropriate level of taxation. The same people who manage the banana regulations in Brussels are responsible for this, I have no doubt.
There used to be a window tax you were taxed for day light and moon light , now of course that that was abolished youl just be taxed for daylight were ever you are, it’s so much less complicated.
For more than two years the SC24min appears to be a repeat of the SC23min with the exception of two months (Aug& Sep) in 2017, see lower graph in
http://www.vukcevic.co.uk/SSN.htm
If the repeat trend is to continue we could expect an almost immediate take off of SC25, which might indicate that the SC25 will be of a similar amplitude to the SC24 as depicted in the article’s illustration.
However, I don’t think that it is going to work out that way. I expect that SC25 will peak no higher than 65% (or about 2/3) of the SC24 and might be even considerably lower if it peaks later than 2025/26.
It means the jet setting climate evangelists will be exposed to more cosmic rays at flight plan altitude. I don’t think the tin foil hats will help much.
Is there evidence of any correlation between # of sunspots and the earth’s weather or climate?
There is a an excellent video https://www.youtube.com/watch?v=87bVdhNklXQ where Prof Lockwood talks mainly about measuring total solar insolation, but he remarks in passing the the Little Ice Age started 50 before the Maunder Minimum, and with the Dalton Minimum cooling came after the minimum was already established. Certainly grand solar minima and global cooling are associated and there is a correlation, but not a strong one. Lockwood points out the weaker Cycle 24 against Cycle 23 allows us to predict the effect of no sunspots in total insolation, and it’s not much and not enough to cause any significant global cooling.
This suggests to me that there is no causal relationship, but rather they share a root cause. Sunspot variance is an expression of this cause, as is global cooling. I have not the faintest idea what that cause might be, nor how it effects global cooling. Cosmic rays and clouds is a theory – I will need convincing.
Mr Jones ( with a name like that you have to live in Wales) a link I reproduced earlier, another possible causation of cooling with regard to cosmic Ray’s
https://www.sciencedirect.com/science/article/abs/pii/S1342937X10001966
Historically, deep minimums are associated with cooler weather, e.g., Dalton and Maunder Minimums coincident with the Little Ice Age. NASA is predicting SC25 will descend to Dalton Minimum levels.
NASA concluded that the chilliness of the Maunder Minimum was due to less UV causing less ozone, which affected the planetary wave of the jet stream.
Chilly Temperatures During the Maunder Minimum
https://earthobservatory.nasa.gov/images/7122/chilly-temperatures-during-the-maunder-minimum
As with most climate variables, it will only take three more weak cycles to get a collective, multi-cycle real impact on climate….at which time the Climate Crusade spokespersons will come up with some other set of distractions or refine their blame game of cold caused by global warming. The UN carbon tax might even be increased to study it then.
Agree, about three very low cycles would constitute a Grand Minimum, and when that minimum occurs in relation to the long term climate cycles (most likely originated by oceans’ currents) the effect on the global temperature might vary considerably as I attempted to demonstrate here
http://www.vukcevic.co.uk/NH-GM.htm
In your graph, what do the temperature readings show, ie land, ocean , atmospheric?
Hi BdC
Good question, it’s NH most likely Land only since I’m referencing the CET. I constructed graphic 2 or 3 years ago and since currently I am far away from my desktop (posting this from small hand held mobile) I can’t tell for sure without consulting the spreadsheet with details of the data used.
Thanks vukcevic I thought as much, I enjoyed my brief visit to your site.
It seems that AMO has already reached the maximum.
http://www.woodfortrees.org/graph/esrl-amo
http://www.woodfortrees.org/graph/esrl-amo/from:1980
Yes indeed, but the scared scientists have to refer to it as a “warming hole” in order to stay employed in these new religion, heretical enforcement days.
If that be true which I think it is, it runs parallel with what the worlds governments want to happen to us, ie , no woodburners, no car trucks running on diesel, certainly in my neck of the woods reduce farming to a minimum, no gas and oil heating, as we start to freeze to death.
Given the last 30 years of Solar activity and temperature data, simple common sense suggests that a Millennial Solar activity peak was reached in 1991 +/- and a corresponding global temperature peak and turning point from warming to cooling was reached at 2004/5+/-.It’s not “rocket science” or a “wicked problem” for the long term. Short term (decadal) climate and weather forecasting is much more difficult but reasonably plausible projections are possible.
Here is the Abstract from my 2017 paper linked below
“This paper argues that the methods used by the establishment climate science community are not fit for purpose and that a new forecasting paradigm should be adopted. Earth’s climate is the result of resonances and beats between various quasi-cyclic processes of varying wavelengths. It is not possible to forecast the future unless we have a good understanding of where the earth is in time in relation to the current phases of those different interacting natural quasi periodicities. Evidence is presented specifying the timing and amplitude of the natural astronomical 60+/- year and, more importantly, 1,000 year Solar activity periodicities (observed emergent behaviors) that are so obvious in the temperature record. Data related to the solar climate driver is discussed and the solar cycle 22 low in the neutron count (high solar activity) in 1991 is identified as a solar activity millennial peak and correlated with the millennial peak -inversion point – in the RSS temperature trend in about 2003. The cyclic trends are projected forward and predict a probable general temperature decline in the coming decades and centuries. Estimates of the timing and amplitude of the coming cooling are made. If the real climate outcomes follow a trend which approaches the near term forecasts of this working hypothesis, the divergence between the IPCC forecasts and those projected by this paper will be so large by 2021 as to make the current, supposedly actionable, level of confidence in the IPCC forecasts untenable.”
These general general trends were disturbed by the Super El Nino of 2016/17. The effect of this short term event have been dissipating .Check the RSS data at http://images.remss.com/data/msu/graphics/TLT_v40/time_series/RSS_TS_channel_TLT_Global_Land_And_Sea_v04_0.txt
I pick the Millennial temperature turning point peak here at 2005 – 4 at 0.58 ( Corresponds with the 1991 Oulu neutron low count)
I suggest that if the 2021 temperature is lower than that (16 years without warming ) the crisis forecasts would obviously be seriously questionable and provide no secure basis for restructuring the world economy at a cost of trillions of dollars.
The El Nino RSS peak was at 2016 – 2 at 1.2
the latest month was 2019-11 at 0.71
Because of the thermal inertia of the oceans the deep 2008/9 activity minimum will likely show up in the temperature data in 2020/21 and the current solar activity neutron count high 2019 -21 should produce equivalent temperature lows in 2031- 2033.( I will be 100 years old in 1933 – and plan to keep on jogging and stick around to experience temperatures lower than those in 2003/5)
However the whole UNFCCC circus was designed to produce action even without empirical
justification. See
https://climatesense-norpag.blogspot.com/2019/01/the-co2-derangement-syndrome-millennial.html
” United Nations Framework Convention on Climate Change, later signed by 196 governments.
The objective of the Convention is to keep CO2 concentrations in the atmosphere at a level that they guessed would prevent dangerous man made interference with the climate system.
This treaty is a comprehensive, politically driven, political action plan called Agenda 21 designed to produce a centrally managed global society which would control every aspect of the life of every one on earth.
It says :
“The Parties should take precautionary measures to anticipate, prevent or minimize the
causes of climate change and mitigate its adverse effects. Where there are threats of serious or
irreversible damage, lack of full scientific certainty should not be used as a reason for postponing
such measures”
Apocalyptic forecasts are used as the main drivers of demands for action and for enormous investments such as those in the new IPCC SR1.5 report .
See my 2017 paper “The coming cooling: Usefully accurate climate forecasting for policy makers.”
http://journals.sagepub.com/doi/full/10.1177/0958305X16686488
and an earlier accessible blog version at
http://climatesense-norpag.blogspot.com/2017/02/the-coming-cooling-usefully-accurate_17.html
And /or My Blog-posts http://climatesense-norpag.blogspot.com/2018/10/the-millennial-turning-point-solar.html ( See Figs)
and https://climatesense-norpag.blogspot.com/2019/01/the-co2-derangement-syndrome-millennial.html
also see the discussion with Professor William Happer at http://climatesense-norpag.blogspot.com/2018/02/exchange-with-professor-happer-princeton.html
Oops 100 in 2033.
Dr. Page, I essentially concur with what you have written. My own assessment is as follows:
On the relatively short term, i.e. decades to centuries, the climate is affected by 4 cycles. These are:
1. ENSO (El Nino) cycle: 3.5 years
2. Solar Cycle: 11 years
3. Multi-decadal Ocean Cycle (AMO) 67 years
4. Long Solar Cycle 110 years (10 solar cycles)
The cycle length of all of these cycles is determined by the internal dynamics of the oceans and the sun, and are relatively stable. The magnitudes (i.e. the strength) of each cycle depend on both the previous cycles, internal variability and the affect of outside forces.
Global Atmospheric Temperatures (GAT) are affected primarily by ENSO, through both a short term effect, ( 1-2 years driven by heat transfer via evaporation and atmospheric convection) and a much longer effect (20 years and more, driven by the transport of ENSO waters throughout the worlds oceans by ocean currents ). There is a smaller, direct affect of the solar cycle on GAT.
The strength of ENSO is affected, not only by its normal cyclical behavior and its past history, but also by the Solar Cycle, as well as the Mutli-decadal Ocean Cycle. The Solar Cycle, in turn, is affected the Long Solar Cycle, which in turn affects ENSO and The Multi-decadal Ocean Cycle.
Thus, what is observed, is that there are significant variations in solar activity, with both short term and long term variations. The variations in energy from the sun are primarily absorbed into the oceans, and then transferred from the oceans to the atmosphere. The ‘climate change’ that we have seen over the past century is a result of 1. The Long Solar Cycle and the Multi-decadal Ocean cycle having coinciding positive phases in the last half of the 20th century, and 2. The Long Solar Cycle was the strongest in more than 1000 years.
Thus, Climate Change is driven by variations in solar activity, but with the oceans as an intermediary. The naturally occurring ocean cycles, whose frequency is controlled internally, make it difficult to see a direct cause and effect between GAT and the sun. This difficulty in seeing a direct effect has allowed for fantasies such as ‘green-house gases cause global warming’ to arise.
Both the Long Ocean Cycle and Long Solar Cycle have both passed their peaks and are declining. We can expect to see Global Cooling for the next few decades.
Hang on, Snoopy! Snoopy hang on!
I ‘predict’ cold weather ahead, but that’s only a one dimensional prediction.
We are all gonna die.
The Sun is faltering,we will freeze..
Unless you send me immense amounts of money and surrender your rights and freedoms..
Sorry just getting in ahead of the ManBearPig.
As the Cult of Calamitous Climate is only appeased when the Climate is Dire,we must not hurt their feelings.
Thus the lack of solar activity is religious in nature,the sun God is offended by us and is cutting off the life giving rays..
Sacrifices must be made,Virgins must be rocketed into the sun, only the finest will do,the most virtuous and best of virgin brains..
And given that sexual virgins are in short supply,the next best offering is virgin,never used brains..
All Cult Members front and centre.
Now I am being sarcastic ,however given our history and the current parallels between the Latest State Religion (Climate Change) and the last one, no witches/scapegoats are safe anywhere.
And the lack of solar activity might be “improved” by crashing immense amounts of matter into Sol.
Just remember you heard it here first and that there is no cure for stupid.
So how much cooler is the Sun?
Hi Joe,
That’s a great question. The Sun is behaving quite normally. Every 11 years the number of sunspots ebbs and wanes. The current number of sunspots is currently at a minimum. Hopefully it will increase next year. Why? Sunspots eject material that bathes the Earth in a protective layer that protects the Earth from cosmic rays. (I know about this because my telescope’s CCD camera captures cosmic rays.) Cosmic rays have been shown to increase cloud formation. Clouds block sunlight which causes cooling. Some experts say that future sunspot maxima will decline like it in the distant past. If that is the case then we can anticipate a long period of cold that deepens each year until the Sun “awakens” again.
The corona? The photosphere? 20Mm into the convective zone?
The bottom of Convective zone?
The radiative zone-convective zone interface?
The central core?
Please be specific Joe G.
What part concerns us on earth, Joel?
As an astrophotographer I rely on clear dark skies. Cloud formation and atmospheric turbulence have increased over last year at this time. Ambient temperature? About the same. Location: 44 miles north of NYC. Could be related to the Jet Stream but I have noticed a steady decline in dark sky quantity and quality for several years. I am keeping a log now.
Based on all that’s been said, I intend to . . .
– move to a warmer and/or colder place; or stay put;
– cut and split a few more cords of firewood;
– install a full house sun shade;
– replace the air conditioner with a bigger and better unit;
– plant hardy crops such as Brussel sprouts & cabbage;
– order several varieties of banana corms;
– stockpile a ton each of rice, wheat, and corn;
– clean and refurbish the chicken coop; or become a vegan;
– get a vehicle propelled by large rubber bands (& buy those);
– replenish my shelf of science fiction and fantasy books;
– Keep on keeping on.
That is some mighty shrewd figurin’!
Stockpile guns and butter, and do not forget ammo and plenty of toast to go with that.
Oh, and um…make sure you rotate out that stockpile on a regular basis.
I was wondering about all the preppers I used to watch on those TV shows 10+ years ago…you know…the ones with 573 five gallon buckets of dried food in the larder for doomsday.
Those rations might be fine after the end of the world, and anyone would likely be real glad to have them, but what do you do when the shelf life is running out and it is all stuff most would only eat instead of starving to death?
Theres a considerable amount of GSM preppers who do stock food, but they are more community based .,emphasis on seeds, growing in greenhouses,indoors ,grow lights ect. From personal experience unless you keep tinned food out of contact with any moisture it will rot from the outside in ,in about 3 years , I’ve had mice attack tins and they can puncture a tin which makes it useless.
https://www.cbc.ca/news/canada/saskatoon/saskatoon-doomsday-food-1.5174402
Saskatoon senior amassed $20K in doomsday prep food before her death
Her stash included eggs, rice, beans, lentil burgers, pasta, cheesy broccoli, strawberries, vanilla pudding — all in vacuum-sealed bags in boxes and plastic pails. Some packages have hundreds of servings.
Iris Sparrow died two days shy of her 80th birthday. RIP
Thanks, her friend said she didn’t subscribe to doomsday beliefs , yet she bought survival foods , maybe her friend was not informed of the real reason, who knows, such a sad story .
Seems to me that NASA/NOAA blew their forecast for the current sunspot cycle, forecasting way more than actually occurred. Why should I believe them now? There are other learned physicists in Russia and else where that have developed solar activity models that have hindcasted all the previous cycles with a 90% accuracy. They are forecasting the next solar cycle to be even lower than the low numbers of the current solar cycle. I lend more credence to their models, since they actually work.
I am significantly more interested in the recent solar changes, as I know for a fact that the recent change in CO2 did not cause the recent warming.
We have gone all in with one scenario.
… which is zero help in solving this problem as the CAGW/AGW scenario is dead.
There should be alarm bells going off. The sun has changed. The sun has changed.
There are solar observations and observations of solar like stars that have the same rotational speed as the sun, that the sun in a transition phase.
In fact, there are was a sudden change in solar frequency response during solar 23 that supports the assertion that there has been a change to whatever creates the solar a solar sunspot group.
Also, during solar cycle 23 and cycle 24 there were sudden fundamental changes to the size and wind speed of coronal holes on the sun and a change in their timing of appearance in the solar cycle.
What creates the coronal holes is not known.
The sudden unexplained changes to coronal holes was noted in peer reviewed papers.
The coronal hole unexplained paradox is they rotate with rigidity with the same speed as the solar core.
This forces the solar coronal hole to be created by the core and to be attached to the core while it is emitting magnetic flux and a pulsing solar ‘wind'”.
There is no coronal hole model as our model of stars/our sun cannot create or explain the coronal hole phenomena.
The Sun in transition? Persistence of near-surface structural changes through Cycle 24
….we confirm earlier findings that there appears to have been a change in the frequency response to activity during solar cycle 23, and the low-frequency shifts are less correlated with activity in the last two cycles than they were in Cycle 22.
At the same time, the more recent cycles show a slight increase in their sensitivity to activity levels at medium and higher frequencies, perhaps because a greater proportion of activity is composed of weaker or more ephemeral regions.
This lends weight to the speculation that a fundamental change in the nature of the solar dynamo may be in progress.
It is tempting to speculate whether these results, and the multitude of other unusual signatures relating to Cycle 24, might be indicative of a longer-lasting transition in solar activity behaviour, and the operation of the solar dynamo.
The existence of the Maunder Minimum, and other similar minima suggested by proxy data relevant to millennal timescales, indicate that there have likely been periods when the action of the dynamo has been altered significantly. We finish by speculating whether these events might presage a radical transition suggested by data on other stars.
Results on activity cycle periods shown by other stars hint at a change in cycle behaviour – a possible transition from one type of dynamo action to another – at a surface rotation period of around 20 days (B¨ohm-Vitense 2007).
There is also more recent intriguing evidence from asteroseismic results on solar-type stars (van Saders et al. 2016; Metcalfe et al. 2016) that shows that the spin-down behaviour of cool stars changes markedly once they reach a critical epoch, with the corresponding surface rotation period depending on stellar mass. For solar-mass stars, the results suggest a change in behaviour at about the solar age (and solar rotation period).
That sounds like an off-the-cuff definition. Is there a definition that is describable mathematically and covers more than, umm, about 5 cycles? We have decent sunspot numbers that go back a lot longer.
And why use the term “deep”? I’ll grant you that an extended number of zeros isn’t directly comparable to low temperature records, but we could with the 10.7 cm radio flux, that never reaches zero, though it does have something like a floor.
This is the paper that showed with an analysis of seven years of coronal hole observations that coronal holes rotate rigidly, with a speed that matches the rotational speed of the solar core.
The sunspot groups float on top of the surface of the sun and hence rotate at the same speed as the convection zone at the latitude where they were formed.
The solar convection zone is a plasma (ionized gas) and hence rotates at a slower and slower speed with higher latitude. Roughly a 40% reduction in rotational speed at high latitudes.
https://en.wikipedia.org/wiki/Tachocline#/media/File:Sun_poster.svg
https://iopscience.iop.org/article/10.1088/0004-637X/763/2/137/pdf
ROTATION RATES OF CORONAL HOLES AND THEIR PROBABLE ANCHORING DEPTHS
From 2001–2008, we use full-disk, SOHO/EIT 195 Å calibrated images to determine latitudinal and day-to-day variations of the rotation rates of coronal holes (CHs).
We estimate the weighted average of heliographic coordinates such as latitude and longitude from the central meridian on the observed solar disk.
For different latitude zones between 40 ◦ north and 40 ◦ south, we compute rotation rates and find that, irrespective of their area, the number of days observed on the solar disk, and their latitudes, CHs rotate rigidly.
Combined for all the latitude zones, we also find that CHs rotate rigidly during their evolution history.
In addition, for all latitude zones, CHs follow a rigid body rotation law during their first appearance. Interestingly, the average first rotation rate (∼438 nHz) of CHs, computed from their first appearance on the solar disk, matches the rotation rate of the solar interior only below the tachocline.
This is one of the papers on the sudden change in the sudden appearance of solar coronal holes during the solar cycle 23 minimum.
https://agupubs.onlinelibrary.wiley.com/doi/epdf/10.1029/2009JA014342
If the Sun is so quiet, why is the Earth ringing? A comparison of two solar minimum intervals
….sunspot numbers, while providing a good measure of solar activity, do not provide sufficient information to gauge solar and heliospheric magnetic complexity and its effect at the Earth.
The present solar minimum (William: Solar cycle 23) is exceptionally quiet, with sunspot numbers at their lowest in 75 years and solar wind magnetic field strength lower than ever observed.
Despite, or perhaps because of, a global weakness in the heliospheric magnetic field, large near‐equatorial coronal holes lingered even as the sunspots disappeared.
Consequently, for the months surrounding the WHI campaign, strong, long, and recurring high‐speed streams in the solar wind intercepted the Earth in contrast to the weaker and more sporadic streams that occurred around the time of last cycle’s WSM campaign.
In response, geospace and upper atmospheric parameters continued to ring with the periodicities of the solar wind in a manner that was absent last cycle minimum, and the flux of relativistic electrons in the Earth’s outer radiation belt was elevated to levels more than three times higher in WHI than in WSM.
Such behavior could not have been predicted using sunspot numbers alone, (William: the solar wind burst remove cloud forming ions via process called electroscavening which partially explains why there was no cooling during the solar cycle 23 minimum)
This data continues to confirm Prof Valentina Zharkova’s principal component analysis. To quote Science Daily:
I hate the fact that there is only one scenario.
The cult of CAGW have anchored our thoughts concerning the recent planetary temperature change on CO2.
We have completely ignored the mystery as to why there is cyclic climate change (both hemispheres warm and cool in sync) that correlates with solar cycle changes in the paleo record.
The sunspot count does not correlate to planetary temperature due to the overriding effect on planetary temperature caused by solar wind bursts from coronal holes.
Planetary temperature is closely correlated with solar wind speed changes as noted in the below paper, “Once again about global warming and solar activity”
The solar wind speed changes create a space charge differential in the ionosphere which removes cloud forming ions from high latitude regions. This mechanism is called elecroscaving.
This is a summary of the charge solar climate change mechanisms.
http://www.klimarealistene.com/web-content/Bibliografi/Tinsley2007,GlobalElectricCircuit.pdf
Sunspot count is not a good measure of solar wind speed changes as it does not consider the large number of solar wind changes caused by coronal holes.
http://sait.oat.ts.astro.it/MmSAI/76/PDF/969.pdf
Once again about global warming and solar activity
By K. Georgieva, C. Bianchi and B. Kirov
Solar activity, together with human activity, is considered a possible factor for the global warming observed in the last century.
However, in the last decades solar activity has remained more or less constant while surface air temperature has continued to increase, which is interpreted as an evidence that in this period human activity is the main factor for global warming.
We show that the index commonly used for quantifying long-term changes in solar activity, the sunspot number, accounts for only one part of solar activity and using this index leads to the underestimation of the role of solar activity in the global warming in the recent decades.
A more suitable index is the geomagnetic activity which reflects all solar activity, and it is highly correlated to global temperature variations in the whole period for which we have data
It could therefore be concluded that both the decreasing correlation between sunspot number and geomagnetic activity, and the deviation of the global temperature long-term trend from solar activity as expressed by sunspot index are due to the increased number of high-speed streams of solar wind on the declining phase and in the minimum of sunspot cycle in the last decades
In Figure 6 the long-term variations in global temperature are compared to the long-term variations in geomagnetic activity as expressed by the ak-index (Nevanlinna and Kataja 2003). The correlation between the two quantities is 0.85 with p<0.01 for the whole period studied.
As the planet warms despite a deep solar minima, and maybe a negative AMO to boot, it will become more and more important for the community of skeptics to have a fallback theory. Anything will do, so long as it’s not supported by the scientific consensus: upwelling from the ocean depths, geothermal venting, God’s wrath, or this one here:
“..increased number of high-speed streams of solar wind..”
The options are limitless with a good imagination.
Hi to a global warmest it’s interesting that quite a few of you have made the trip here tonight, you havent shown any global warming have you ,just out of curiosity your example of ” upwelling of ocean depths” what exactly would that mean? Over what time scale? And what mechanism would be the cause?
@BdClark
“just out of curiosity your example of ” upwelling of ocean depths” what exactly would that mean? Over what time scale? And what mechanism would be the cause?”
Sorry, I’m not up to speed on this particular idea. Sounds goofy, right? You might try a word search of recent posts here at WUWT. Fertile ground for crack pottery.
So that a no and a no then. Theres a surprise.
Severus,
The only global warming right now is in wholly adjustments to temperature station records and deletion of rural stations.
Before winter 2019-2020 is over in April 2020, the US NPS Glacier National Park will be reporting record snow packs on the glaciers there… ice gains coming. Glaciers across the NH will be in a similar state of additions. The Arctic Sea Ice extent at March max will be near normal (not statistically different) for the 1980-2010 average.
Believe in your climate change witchcraft and magic all you want. Make incantations and potions. It won’t help the coming collapse of the climate scam when reality intrudes with cooling this coming decade.
Us muggles are not impressed nor moved with your climate change witchcraft.
Joel
Joel,
Seem to remember there was much chatter around here about imminent cooling at the time of the last solar minimum (cycle 23, around 2008/09). Forecasts of a weak solar cycle 24 even caused some to speculate that it could lead to a Dalton or even Maunder minimum. Well, the forecast for solar cycle 24 was right; as can be seen in the above charts 24 was much less intense than 23; however, as for the associated cooling… still waiting for that.
@joel
“The only global warming right now is in wholly adjustments to temperature station records and deletion of rural stations.”
Adjustments? It’s time we paid a visit to our friends in Huntsville:
Select a month late in the record, but prior to the 2015 “upgrade” to version 6.0, and you will more often than not discover that the temperature anomaly has been adjusted downwards. This led to a significant flattering of the long term trend.
For example, an anomaly of +0.32 C. was initially reported for the month of December, 2014:
https://www.drroyspencer.com/2015/01/uah-global-temperature-update-for-december-2014-0-32-deg-c/
But looking at the updated data set, you will find that value has been tampered with, and is now just +0.22 C
http://vortex.nsstc.uah.edu/data/msu/v6.0/tlt/uahncdc_lt_6.0.txt
********
Despite the downward adjustments, the 40 year LT trend is still +0.13 C/decade. And we can’t blame it on UHI’s can we? Not a lot of those in the oceans. in fact, urban areas make up a very small percentage of the earths surface.
Seems to me your confusing ground based temperature, with satalite data you do know uahv6 measures lower atmosheric temperature, as for your comment on ground based temperature recording, they are indeed based in urban areas ,which really is not a good true reflection of a area, it’s a micro environment based biased.
Bd Clark
Folks like Steve Mosher or Bindidon (see below) could alleviate some of your concerns regarding the UHI and surface based trends.
My point is that the problem of station placement is NOT an issue for the LT products, and yet they show a similar rate of warming.
I think you are a bit dense do you really think a handful of temperature monitors in a micro heat sink urban environment give a true reflection of earths temperatures ,you really are having a laugh aren’t you.
Mosher the guy who is completly useless is the forum patsy ,yet right,
Folks like Steve Mosher or Bindidon (see below) could alleviate some of your concerns regarding the UHI and surface based trends.
Really? Have you ever asked them what the UHI adjustment is? LOL
I see you dont give a reason for the temperature adjustment, do you think you can work that one out?
I would not hold my breath waiting for an explanation thats not full of malarky.
poster seems to be the sort that is happy sea temp data gained by polling ocean going vessel incoming water temps. friction, placement of sensor, etc add to temp. so temp can only be accuratly used to tune fuel system. but nope…lets call it real ocean temp and run with it….
Yep I’m on to him,I know the answer just want to see what rubbish he comes up with, I doubt he had the brains to dig so deep into what frankley is a very boring data sheet with thousands of numbers and then research the updated data set,I assume some one who is a fanatic global warmest researched the data then gave it to the wannabe harry Potter’s actor to cause discredit, note the use of the word manipulated.
@BD Clark
“I see you dont give a reason for the temperature adjustment, do you think you can work that one out?”
Are you suggesting there might be a VALID REASON for the hundreds of adjustments made to the satellite record? (sarc)
Yes I am I asked you do you know?
Bd Clark
Diurnal drift is of course one issue. Well documented:
https://science.sciencemag.org/content/309/5740/1548.abstract?sid=2994e52e-37e0-4e6e-b31b-3fef7a6462b2
Newer Satellites with newer equipment – replacing older ones – is another.
My point is there are also necessary adjustments to surface based trends, yet to many, these changes are seen as evidence of nefarious tampering.
A classic example of confirmation bias.
Yet I sure you would be able to preach that one to the IPCC good luck with the Harry Potter movie
Bd
“I think you are a bit dense do you really think a handful of temperature monitors in a micro heat sink urban environment give a true reflection of earths temperatures ,you really are having a laugh aren’t you.”
A study of rural CONUS stations, 1979 – 2008, that were deemed by Anthony Watts and others to have little or no signs of an UHI effect, still found a warming trend of +0.204 /decade.
Not to mention that the vast areas of high northern latitudes- Siberia, Northern Canada, etc., where urban growth has been very small, are warming FASTER than anywhere else in the world.
Oceans, TLT, wild and rural areas- all indicate a warming trend.
I see you avoided the question of urban temperature heat sinks that give a false impression of area temperature.
Then you obfuscate to areas were there are no temperature stations and claim there warming , that must be the Harry Potter crystal ball project linked directly to false IPCC temperature projections, after all that’s the best they can do right project, when failed push the projection ahead another ten years, and you buy into that. Still some one who names himself after a fictitious wizard in a kids film must live in a world of fantasy,
Bd Clark
Hmm… you need to give this sentence another run through:
“A study of rural CONUS stations, 1979 – 2008, that were deemed by Anthony Watts and others to have little or no signs of an UHI effect, still found a warming trend of +0.204 /decade.”
….and then try to figure out why the sentence below is so nonsensical:
“Then you obfuscate to areas were there are no temperature stations and claim there warming..”
Also, are you under the impression that we have no means of obtaining surface measurements from Northern Canada or Siberia? Or that there is no method of retrieving temperature data from the oceans? This may come as an eye opener regarding the latter:
https://www.ndbc.noaa.gov/
I do hope you’re correct, my garden would like it warmer. I doubt you are, though.
Didn’t you know, Snape, warming is good. Dumbledore himself cast the spell to break the spell originally cast by members of Slytherin that caused the cold, dismal LIA.
Snape, are you even vaguely aware that deep ocean water is considerably LOWER in temperature than surface water? And that upwelling does NOT necessarily mean a rotation of the top 33 feet (10 meters) of water?
Deep ocean water has a very uniform temperature, around 0-3 °C (or 32F to 37.4F), and a salinity of about 3.5% or as oceanographers state as 35 ppt (parts per thousand). That’s a WHOLE lot cooler than the surface.
Perhaps you did not take that into account – a failure on your part, Sport!
@Sara
Thank you for sharing the interesting figures. I was at least aware the deep ocean is very cold, mostly uniform, and slow to change, with almost no light.
My point though, is that many here seem to resent, and/or distrust the views of mainstream science.
The result is that a cringeworthy explanation for global warming, like the one stated above, is sometimes favored over what is given by the IPCC or Universities.
I guess they never taught you comprehension at Hogwarts
My solar Active Region (AR) triggering hypothesis is still a work in progress. Empirical in its initial creation (saw something interesting in data), ultimately it will have to become more grounded in the MHD theory of stellar convective zones physics.
I commented 4 days ago about two triggers for predicted ARs coming around 16 December. One Southern Hemisphere (SH) then Northern Hemisphere (NH).
15 December 2019: A SH spot appeared by Jan Alvested’s STAR 2K res criteria:
http://www.solen.info/solar/images/AR_CH_20191215_hres.png
16 December 2019: And a “STAR” NH spot:

Those are spots recognized in HMI images by Jan Alvested, not visible spots that SWPC recognizes and numbers though.
I have underestimated the full depth of this magnetic solar minimum low for the SC24/SC25 transition. Still there were two distinct strong triggers, triggers that in more magnetic active states would, by my hypothesis, would predict large AR’s with much flaring activity.
What I overestimated was the buoyancy rise time of flux tubes at Solar Minimum and the umbral field strengths. Normally, flux tube rise speeds are 140 +/- 10 m/s during more active periods. Apparently not only are the rise speeds slower now, ~120 +/- 10 m/s at solar minimum, but the umbral field strength at the solar surface is too low right now for the twisted rising tubes to remain intact as they approach the surface to produce visible (cooler) spots. Thus they appear to “surface” with just a small ripple/whisper at the photosphere during a solar minimum.
I’m still expecting stronger ARs to appear at Carrington Longitudes +74º and 41º, both of which are still on the back side of the sun at the moment, coming into Stereo-A view, with the 74º area emerging around 21 December.
I’m still standing by my predictipn of a 1 January 2020 as the SC25 start though.
Ten years since Jack Eddy’s passing. If this minimum turns out to be significant, it will already have a name, The “Eddy Minimum”.
https://wattsupwiththat.com/2009/06/13/online-petition-the-next-solar-minimum-should-be-called-the-eddy-minimum/
If this is indeed a century minimum, I support it as the Eddy Minimum.
My active region triggering hypothesis, when finally published with mechanism, will specifically name it the Eddy Minimum… if this comes to pass.
Even more years since Theodore Landscheidt’s passing in 2004 and quite a few people think the minimum should be named after him because he was the one that actually predicted it.
But as Alexander von Humboldt said: ‘There are three stages of scientific discovery: first people deny it is true; then they deny it is important; finally they credit the wrong person.”
The extremely high pressure in the Rocky Mountains.

I warn you of severe frost in northern US.
Observational capability, and accuracy, being a product of the ‘Space Age’ means that what constitutes a reliable record is maybe 30 years worth ? The vast bulk of the data on sunspots will have resulted from amateurs placing a card at the back of their telescopes.
Even if the solar activity DOES affect the climate significantly, it seems to me there is little cause for self congratulation. The ice caps and glaciers are still melting, even at a solar minimum. What will happen when solar activity goes back up? Rapid acceleration in warming?
Even if? I give up. Where does most of the heat come from? That big yellow thing in the sky!
This planet has been habitable with NO glaciers at all and NO snow anywhere, long, long ago. A little exploration into past geological eras might do you some good, kzb.
Just out of curiosity, I have to ask: which do you prefer? Freezing cold weather year ’round, with nearly perpetual snow (see Siberia and Yakutia weather reports)? Or warm, sunny days with warm breezed and not having to bundle up just to go outside and get the mail? Just asking.
@Sara
“This planet has been habitable with NO glaciers at all and NO snow anywhere, long, long ago.”
And in places like Florida, those inhabitants were of the aquatic variety.
The ice caps melt in summer ’til september and regrow ’til mach, and they grow more than in 2007 and 2012.
And there are melting glaciers and growing glaciers.
Krishna Gans
“… and they grow more than in 2007 and 2012.”
Wrong.
Here are the monthly data since 2007 (year, extent, area, sum, departure wrt 1981-2010)
– for September:
2007: 4.27 2.82 7.09 -3.75
2008: 4.69 3.26 7.95 -2.89
2009: 5.26 3.76 9.02 -1.82
2010: 4.87 3.34 8.21 -2.63
2011: 4.56 3.21 7.77 -3.07
2012: 3.57 2.41 5.98 -4.86
2013: 5.21 3.78 8.99 -1.85
2014: 5.22 3.74 8.96 -1.88
2015: 4.62 3.42 8.04 -2.80
2016: 4.51 2.86 7.37 -3.47
2017: 4.8 3.3 8.1 -2.74
2018: 4.71 3.3 8.01 -2.83
2019: 4.32 3.13 7.45 -3.39
– and for March:
2007: 14.54 12.56 27.1 -1.53
2008: 15.18 13.53 28.71 0.08
2009: 14.98 13.43 28.41 -0.22
2010: 15.14 13.53 28.67 0.04
2011: 14.55 12.83 27.38 -1.25
2012: 15.2 13.41 28.61 -0.02
2013: 15.03 13.45 28.48 -0.15
2014: 14.76 12.95 27.71 -0.92
2015: 14.37 12.78 27.15 -1.48
2016: 14.4 12.52 26.92 -1.71
2017: 14.27 12.56 26.83 -1.80
2018: 14.3 12.61 26.91 -1.72
2019: 14.55 12.81 27.36 -1.27
Trend for September since 2007: 0.0 ± 0.6 Mkm² /decade
Trend for March since 2007: -1.1 ± 0.5 Mkm² / decade
https://drive.google.com/file/d/1njGP94XZOg0CMky7h8U4lvM7NsadtJDt/view
The current problem is less the melting than the lack of refreezing, Krishna Gans…
Source: ftp://sidads.colorado.edu/DATASETS/NOAA/G02135/north/monthly/data/
Feel free to check.
Viele Grüße aus Berlin
J.-P. D.
As Dr Henrik Svensmark observed, low solar activity results in more cosmic rays hitting the atmosphere resulting in more clouds. Relatively minor changes in total cloud cover have an effect on atmospheric temperature. More clouds will cause cooling.
Well maybe, but that is not the point I was making.
I am saying that if this theory is true, we are in even more trouble than we thought. This is because the cooling due to low solar activity has been masking warming for the last several years. When solar activity recovers we could be in deep do-do. I don’t know why you are all congratulating yourselves over this.
What specifically are you worried about?
http://masie_web.apps.nsidc.org/pub/DATASETS/NOAA/G02186/latest/4km/masie_all_zoom_4km.png
Nope the two el Nino events of 1998 and 2016 should of been masked by your theory, they were not,
So the solar cycles are not masking anything, el Nino has a much greater amount of energy than any hypothesis of c02 warming the atmosphere.
El Nino and La Nina, the ENSO system, is an *oscillation*. The ‘O’ in ENSO stands for ‘oscillation’. An oscillation neither adds nor subtracts energy in a system over the long term. Otherwise it wouldn’t be an oscillation. (It would just be an ENS!)
ENSO typically exerts its influence, whether that be warming or cooling, a couple of times per decade; so if there has been long term warming or cooling over the course of 4 decades then ENSO can’t be to blame.
Sure a oscillation a 3 year oscillation it moves may be a better term a lot of heat/energy through the lower atmosphere which effects land temps as well ,the point was the sun cycles had no effect on the 1998/2016 el Nino events ,so the posters theory of heat being trapped by the low solar cycle does not stand up.
ENSO is likely a regulator system – regulator in the classical sense of system theory. A governor in a global heat engine.
ENSO tries to maintain a stable regime with feedbacks driving storage (La Nina) and release (El Nino) of heat energy.
ENSO has been maintaining an El Nino or near-El Nono state since late 2015. It can only go so long before it runs out of stored ocean heat energy to keep the system where it is.
A crash is coming in temps as ENSO will have to revert to La Nina to recharge.
And then it gets cold. Really cold for a bit. But a prolonged solar min will not help that recharge.
“if this theory is true,” –
kzb, that is NOT a theory, it is facts handed to you. We already have a higher cloud cover for this year than before, and humidity as well as precipitation rates and volume have picked up substantially. Those are FACTS, not theories. None of that is due to global warming. It started some time back and is increasing. If that were not the case, there would be ZERO reports of snow in 2018 in the Sahara Desert with photos: https://www.npr.org/sections/thetwo-way/2018/01/09/576747323/photos-the-sahara-desert-painted-white-with-snow
Not ONE bit of it is due to global warming. Increased cloud cover can and frequently does lead to increased precipitation levels and higher humidity.
You have a very naive, uninformed view of things. I suggest you spend some time looking for things like snow in the driest desert in the world, the Atacama Desert in South America. That place has been getting regular winter snows lately, when it hadn’t even had a drop of rain in several thousand years.
https://www.adventure-life.com/chile/atacama-desert/news/atacama-desert-driest-place-on-earth-hit-with-snow
Of course, if you choose to ignore this and just go on in ignorance, that’s your choice. However, we will NOT be in deep doo-doo when we come out of this solar cycle. It’s more likely we’ll see a return to what used to be normal weather. It’s that simple.
Sara
“None of that is due to global warming.”
Thanks for informing us how you know that. (I’m not interested in discussing global warming: I’m interested in your sources.)
“It started some time back and is increasing. If that were not the case, there would be ZERO reports of snow in 2018 in the Sahara Desert…”
Do you know, Sara, that there was snow in the Sahara in 1979?
seems to me your picking out your targets a pattern is emerging, Sara is correct increased Percipitatation is happening across the globe that’s what happens when clouds are formed due to CRF a effect of GSM do you still dispute this ,or is it still unintelligible for you,still waiting for the unadjusted data set for them fraudulent temperature readings you gave earlier.
Yes, I did. I only included the most recent Sahara desert snow, from 2018.
There was also snow in Kuwait in 2015, the first time anyone there had ever seen it, because there was no history of snow falling, never mind sticking, in Kuwait prior to 2015.
This is about cycles, nothing else. Where this particular cycle is going is a guess, but considering everything, I doubt that we will be seeing anything resembling a “deep doo-doo” event when the Sun does return to “normal” in the next solar cycle. And what if it does not do that? Then what?
What fascinates me is the peculiar notion that a +1C degree of rise in the mean global temperature is going to be fatal, somehow. One degree Centigrade is equal to 33.8 degrees Fahrenheit, and ZERO Centigrade is 32 Fahrenheit, so where is the extreme heat in that?
Perhaps if we leaned on that, instead of just repeating the centigrade/Celsius with no real reference to the same thing in Fahrenheit, some of the peculiarly dumb things that come out of this might be stopped.
Sara
“What fascinates me is the peculiar notion that a +1C degree of rise in the mean global temperature is going to be fatal, somehow. One degree Centigrade is equal to 33.8 degrees Fahrenheit, and ZERO Centigrade is 32 Fahrenheit, so where is the extreme heat in that?”
I understand what you mean.
But we all should also understand that an increase of 1 °C in the global average means much bigger increases in many corners. And these are the problem, much more than the corners helping the average not to bypass the 1 °C.
You and your kind have been predicting a rise of 1c for 30 years it’s never happened, the best you can do ,is push the date forward another 10 years , alarmist propaganda, meanwhile people are taxed more in the name of CAGW not the rich but the poor. All your doing is making the rich richer and the poor poorer, with green energy policys that will see people die from energy poverty and cold. Hows the conversion list going ? Your really in the place for conversion enrollments (not)
There are areas where the temperature increase is already beyond 1°C.
Google translator might help you:
Abb. 1: Development of the mean annual temperature worldwide 1850–2017 (violet) and in Austria 1767–2017 (red). Annual deviations from the mean of the years 1961–1990 (thin lines) and their smoothed trends (thick lines, 21-year Gaussian low-pass filter) are shown
Abb. 2: Development of the mean winter temperature (blue) and summer temperature (red) in Austria 1767–2017. Annual deviations from the mean of 1961–1990 (thin lines) and their smoothed trends (thick lines, 21-year Gaussian low-pass filter) are shown (Auer et al. 2007).
Here the link where you ind the graphs::
https://www.zamg.ac.at/cms/de/klima/informationsportal-klimawandel/klimavergangenheit/neoklima/lufttemperatur
Sara, scientists the world over use centigrade (or even better, Kelvin). Your idea that converting the unit to Fahrenheit would make anything any different is a good idea for a comedy sketch !
Anyhow, point #1, there have been many refutations of this solar activity versus temperature correlation. It quite likely does not exist, or if it does, it is much smaller than claimed. Point #2, if solar activity DOES have a big effect on temperature, we are in deep do-do when the sun goes back to normal. This is because we are still seeing warming, even in a period of low solar activity. When solar activity is restored and that is added to GHG warming, the increase in the warming gradient could be a big shock.
Do you not read anything put in front of you ,no warming sinse 2016 ,did you see the magnitude of the warm spike to 0.89c, and did you see the magnitude of the drop in temperature ,were is the effect of co2 sustaining that warm natural el Nino event ,exactly the same happened in 1998, no sustained effect .we are just entering the GSM , have a look and educate yourself.
Sara -“it’s facts handed to me” !! Well thanks. Henrik Svensmark’s theory is accepted by hardly any scientists, it does not count as an undisputed fact at all.
The rest of your post consists of the unusual weather events that we were warned would happen with increasing frequency. So you are just arguing against yourself with all that.
Strong waves in the upper stratosphere that break the polar vortex are very disturbing.
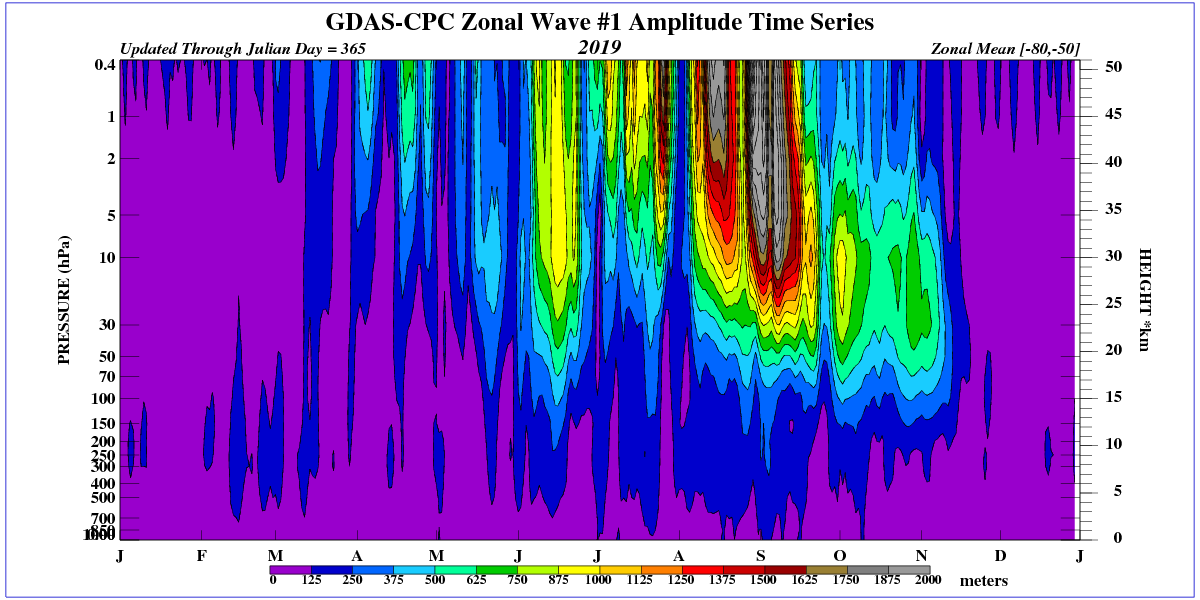
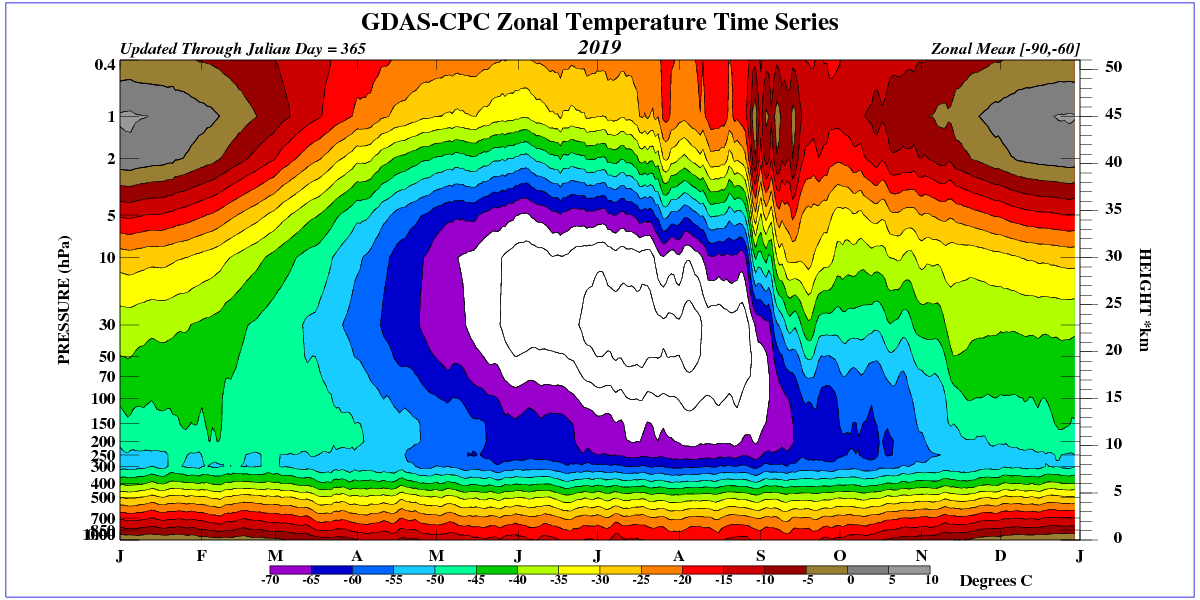
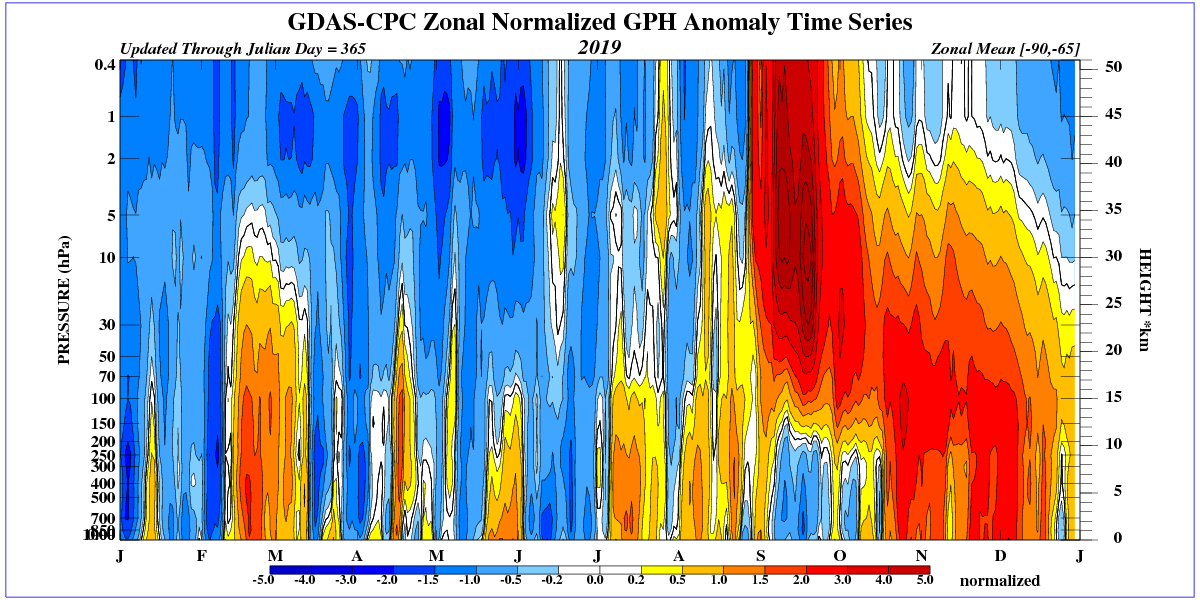
Good to see NASA had a perfect sine wave queued for their prediction.
I can’t predict solar activity. I’ve seen Valentina’s mathematical models and she claims a believable 97% accuracy. Saying that, there are other studies which collaborate her findings, not necessarily from a solar perspective, but sedimentary, and temperature spectral analysis.
Chinese scientists say a 250 year period cool phase is ushering in from studying patterns in sedimentary layers.
https://www.scmp.com/news/china/science/article/3022136/china-scientists-warn-global-cooling-trick-natures-sleeve
Carl-Otto Weiss. Spectral analysis. They claims all warming has been natural to this point. It could be that the last century we were fooled in to thinking CO2 did anything, let alone being in deep do-do when the sun recovers.
https://schillerinstitute.com/media/carl-otto-weiss-le-changement-climatique-est-du-a-des-cycles-naturels/
Whether or not any of these have merit, they do coincidentally point to the near future if not now, which happens to coincide with a possible GSM. The next few decades will see a push towards understanding areas of natural phenomena especially with CO2 failing to demonstrate its ability to warm.
This is playing absolute hell on amateur radio propagation which requires solar flux ionization of the upper atmosphere to reflect signals long distances.
But shouldn’t >100 meter signal propagation be great right now?
How low can you go? (MHz)
A little bit cold in Lincoln UK tonight and I was driving around until 1.30am there is a wide spread frost and I could see flakes of frost falling from the sky with my torch.
https://www.metoffice.gov.uk/weather/forecast/gcrwgdr98
Seen snow frost and hail in Wales at the weekend ,slightly below average temps here in west London tonight we have seen a few frosts.
Donald,
I spent 1985, 1986, 1987 living in Tadley, Hants.
Summer 1986 was the Solar Cycle (SC) 21-SC22 minimum.
I froze my nuts off that summer in England.
Stay warm Gentlemen. Stay warm.
lets take one quote: Atmospheric temperatures should be cooling in the near future – maybe they already are.
Now if the author and his cult were not come combination of lazy, stupid and ignorant they would have come across this:
which is from https://earthobservatory.nasa.gov/images/7122/chilly-temperatures-during-the-maunder-minimum and shows a maximum change of temperature of -0.7 degrees C from the norm.. IN the past 100 years global temps have risen over 1 degree C, And there is no evidence that this rise is slowing. https://www.google.com/url?sa=i&source=images&cd=&ved=2ahUKEwjz9_Gcv77mAhUPr54KHc7ICX8QjRx6BAgBEAQ&url=http%3A%2F%2Fberkeleyearth.org%2F2018-temperatures%2F&psig=AOvVaw1He8YHdfrNG6-EjAXyQeQc&ust=1576734313912972
Well no evidence unless you are one of the idiots who, unable to read a simple graph, claimed 1978, a year of El Nino, clearly showed that global warming had stopped or slowed,, or …
The AMO cycle will now be in the negative phase.
http://www.woodfortrees.org/plot/esrl-amo/from
https://www.google.com/url?sa=i&source=images&cd=&ved=2ahUKEwjz9_Gcv77mAhUPr54KHc7ICX8QjRx6BAgBEAQ&url=http%3A%2F%2Fberkeleyearth.org%2F2018-temperatures%2F&psig=AOvVaw1He8YHdfrNG6-EjAXyQeQc&ust=1576734313912972
(Rescued from spam bin) SUNMOD
Don’t forget:
“To everything, there is a season”.
Means that everything varies in time, even temperature.
Make this simple experiment: get four new thermometers for every face of your house. Make sure that they all show the same temp value lying together before you put them up.
Put them in place, make sure they are shadowed.
Read them every hour a full day.
Then, tell me how hot or cold the day was.
Extended: persuade your neighbours to do the same experiment. Compare the readings.
Current temperature anomalies in the US.

A look at how quick you can go wrong when claiming a relation between SC minima / low Sun Spot Number and low temperatures: Germany in 1986, 1963 and 1956. Temps in °C.
Yr/mth: Temp SSN
1986/01: -6.13 | 2.8
1963/01: -7.37 | 28.7
1956/02: -9.96 | 175.6
Feb 1956 was the coldest month in Germany (and in France) in at least the last 120 years.
For people living in e.g. Minnesota this average of -9.96 °C might look quite acceptable compared with their Feb 2019 (-14 °C on state average), but compared as departures from the 1981-2010 mean, Minnesota shows for the month 9.5 °C below mean whereas Germany was 10.8 °C below.
In Oct 1957, the SSN reached the top of the Modern Maximum with 359.4.
Climate affairs are by far too complex to be reduced to single forces like solar activity, or… CO2.
Co2 is not a single force it’s a hypothesis based around a unproven interaction with the planets atmospher as far as AGW goes,
Solar cycles are not a single force, the interaction with the planets atmospher and land and sub surface, oceans are complex relationships that drive many forces interacting with each other.
Below is the global temperature anomaly at the end of the previous solar cycle, SC23.
http://icecap.us/images/uploads/uah7908.JPG
The PDO went negative for a few years and then turned positive again. The global cooling that characterized the end of SC23 reversed and natural warming returned, culminating in the El Nino of 2015-2016.
http://woodfortrees.org/plot/uah6
The PDO is about to go negative again.
http://woodfortrees.org/plot/jisao-pdo
The AMO appears to be peaking and may also go negative – we will see.
http://woodfortrees.org/plot/esrl-amo
The current solar cycle, SC24 is much weaker than SC23 and is now ending. Total Solar Irradiance is now as low as the Dalton Minimum and still falling, almost as low as the Maunder Minimum.
http://woodfortrees.org/plot/pmod
Loading all this data into my “Super-Ouija” climate computer, the planchette moves inexorably towards “global cooling”, starting about now.
Thank you Allan
@Allan
Thank you. It is helpful to have this information put together in such an organized, accessible way. Bookmarked for future reference.
I understand the panic the alarmists are in. We are going towards really cold weather for quite a number of years now and there is nothing they can do about it now. They absolutely need to get those CO2 taxes passed into law before people find out about their scam which is why they threw such a fit in Madrid. Now it’s one more year and in the meantime the temperature will go down. every successive winter they look more foolish. For the longest time, time worked for them. Now it works for reality.
In response to these endlessly repeated claims concerning Earth just in front of a massive cooling, I show a few graphs within which nothing of that cooling is visible.
But before that, I would like to underline how quickly you can manipulate your readers with simple tricks.
Check out this graphic that at first glance seems so honest:
http://icecap.us/images/uploads/uah7908.JPG
Sorry, it isn’t. Because it is based on the use of a high order polynomial > 3, with the help of which you can tell everything:
https://drive.google.com/file/d/1dPJfJeYvEc80FJmh4E8HCzlccXb_rqJn/view
Moreover, you see in this graph many many places where the time series experiences drops even higher than that allegedly being caused by SC23’s end!
*
But let us come back to the main point, and compare, for the period 1900-2019
– the SILSO Sun Spot Number record;
– the AMO (here undetrended of course);
– the coolest surface temperature time series for this long period, managed by the Japanese Met Agency.
The detrended AMO series is useless here, as it only makes sense to demonstrate AMO’s cyclic behavior; but when you compare AMO to temperature time series, you have to use the original data (based on Hadley’s HadISST1).
Using the detrended variant gives your readers the impression that AMO is far lower than other series, what it is not at all.
Since these three series have very different value ranges, all values were uniformly converted to percentiles for an apple-to-apple comparison without tricky scaling and offsetting:
https://drive.google.com/file/d/12HtQq7eVIaJ4zn182I6Kzs5fhxxvZzT7/view
I’d like to see a commenter proving us here any kind of relation between SSN and AMO / global surface temperature!
I could add ENSO data (MEI starts 1871); but that wouldn’t change anything.
Let’s go one step further, by zooming into the satellite era from 1979-now, btw adding the UAH6.0 LT plot:
https://drive.google.com/file/d/1XwvXfhkL5XcRBbsT09CybDsVNI_d7s-m/view
Here too, some superficial eye-balling might let you think of a relation between SSN and the other series. But this guessing would quickly be stopped by a consistent statistical analysis.
*
It’s cooling in Northern America, and in UK/Eire – for very different reasons. And yes, it probably cools in some other places on Earth as well. Certainly NOT in the Arctic,however!
Cooling? Even global cooling? Are you serious? All surface series (land and sea) show warming, even UAH6.0 LT, the coolest time series does as well!
This is a bad joke. Why do you look only at cooling places, but not where it doesn’t cool at all?
Best regards from the pretty warming Germany (I appreciate! No Sydney syndrome visible here)
J.-P. D.
Sources
– SSN:
http://www.sidc.be/silso/DATA/SN_m_tot_V2.0.txt
– AMO undetrended (absolute values):
https://www.esrl.noaa.gov/psd/data/correlation/amon.us.long.mean.data
– JMA Globe anomalies:
https://ds.data.jma.go.jp/tcc/tcc/products/gwp/temp/list/csv/mon_wld.csv
– UAH 6.0 LT:
https://www.nsstc.uah.edu/data/msu/v6.0/tlt/uahncdc_lt_6.0.txt (column 3)
Interesting you did not respond to Allan who brought this graph to the thread nor did you mention allan, Allan’s point was how the temperature dropped at the end of CS 23 yet you circumnavigated this point and take his graph completly out of context from his post, seems to me your getting desperate. The facts dont change temperature drop at the end of SC23 temperature drop SC 24
Hi bin
It was at least useful for me to see the charts where Allan and others are getting their opinions from. And I did remember from past comments by you the problem with detending.
Anyway, hoping for a moderate to strong La Niña in the near future, plus continued low sunspot number. That way, if in ten years from now the various trends have returned to being as steep as ever, maybe all this nonsense will be put to rest.
Snape
“That way, if in ten years from now the various trends have returned to being as steep as ever, maybe all this nonsense will be put to rest.”
I agree. But when having a closer look at the reply above yours, you will see that there is few hope for any mental change over the long term.
The same people who accuse me to ‘circumvent’ their opinion are those who deliberately ignore the evidence, e.g. the fact that according to the same UAH data they misuse to magnify the alleged cooling effect of solar minima, it has been much cooler after huge volcano eruptions!
Amazing.
One can argue ad infinitum about causality, correlation, and which are the confounding and important variables. And it seems futile to try and predict from today forward, with all the variables, known and unknown. When you have more variables than equations, it does not seem feasible.
One thing you can take to the bank:
°Heat kills a few hundred or thousand people a year; especially those who have had cheap electricity taken away by well wishing people (or those people making a good living at the government trough). They can’t afford expensive Quixote-based electricity because of solar and wind subsidies—accentuated by availability brownouts! They have been put into this death box by us! (“We have met the enemy, and they are us” – Pogo)
°Cold kills a few hundred thousand people to a million a year, directly. (Europe alone had 40,000 cold-related deaths a winter ago). Indirectly, it also kills the poor, because people in developing countries have had coal and petroleum generating plants banned by the benevolent governments in the industrialized West. As a result, there is no preservation of food, no refrigerated medicines, no light, no progress, no education, and so on.
Regardless of what the future holds, which of two futures are we prepared best for? A cold one? I don’t think most people see that as even a possibility. How dumb! Personally, I am sure we would be happier in a warmer climate, with higher CO2 (1000 ppm CO2 is optimal for plant success), than in a CO2 starved world (below 500 ppm).
At the very least, let intelligent countries be prepared for either eventuality. Nuclear power should be an adequate compromise.