Guest resource economics by David Middleton
Ohio’s shale energy industry attracts nearly $78 billion in investment since 2011
11/20/2019COLUMBUS, OHIO – Total investment in Ohio’s resource rich shale energy sector has reached $78 billion since tracking began in 2011, according to a Cleveland State University (CSU) study.
Prepared for JobsOhio, the report represents the most recent data available and covers shale investment through the second half of 2018. Earlier in the year, IHS Markit released estimates that by 2040, the Utica and Marcellus shale region, of which Ohio is a significant part, will supply nearly half of all U.S. natural gas production.
The study from CSU’s Energy Policy Center at the Maxine Goodman Levin College of Urban Affairs, showed drilling investments were slightly down in the second half of 2018 compared to the first half, but total upstream investments were up. Total shale-related investment in Ohio for the second half of 2018, including upstream, midstream and downstream, was around $3.82 billion. Total investment from 2011-2018 totaled about $77.7 billion.
[…]
World Oil
Energy Returned on Capital Invested (EROCI)
Can you say “hockey sticks”?
And those aren’t the only hockey sticks. Proved reserves of natural gas have also hockey sticked…
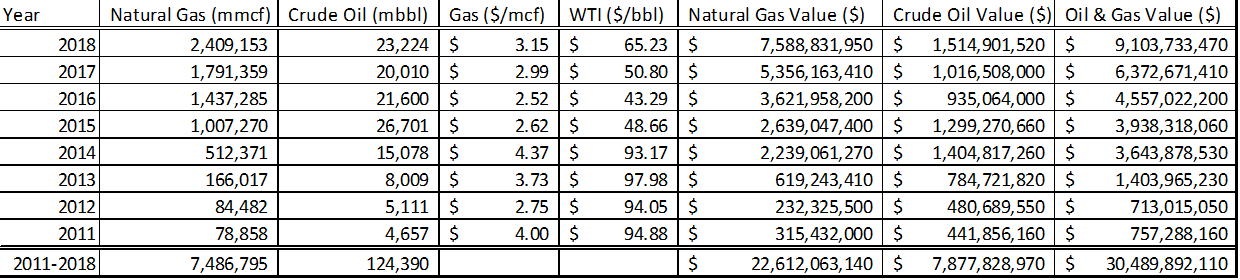
From 2011-2017, Ohio’s proved natural gas reserves grew from 758 to 26,123 billion cubic feet (Bcf). EIA’s 2018 reserve report comes out later this month. However, the relationship between production and proved reserves from 2011-2017 is very linear (R² = 0.9555). This indicates that the 2018 proved reserves will be around 31,000 Bcf.
| Reserves (Bcf) | Production (Bcf) | ||
| 2018 | 31,056 | 2,409 | |
| 2017 | 26,123 | 1,791 | |
| 2016 | 15,143 | 1,437 | |
| 2015 | 12,104 | 1,007 | |
| 2014 | 6,723 | 512 | |
| 2013 | 3,161 | 166 | |
| 2012 | 1,233 | 84 | |
| 2011 | 758 | 79 | |
| 2011-2019 Growth | 30,298 | $75,744,713,509 | Value @ $2.50/mcf |
Using a generic price of $2.50 per thousand cubic feet (mcf), or million Btu (mmBtu). The estimated growth in proved reserves from 2011-2018 is worth $75.7 billion. That’s just natural gas proved reserves. Proved reserves are the 90% probability case. Probable reserves, the most likely case(>50% probability), aren’t reported at the State level; but they are by definition significantly higher.
What’s that? A $77.7 billion investment in $75.7 billion worth of natural gas doesn’t sound like a winner? Well, there’s also the value of the production, which includes some crude oil.

$75.7B + $30.5B = $106.2B
That’s a 37% return over 8 years, a 4.6% average annual return.
On top of that, only $53.8 billion was upstream (exploration, drilling and production) investment. This works out to a finding and development (F&D) cost of $1.42/mcf. The oil & gas prices cited earlier were wellhead prices (what the producer can expect to receive). From 2011-2018, the wellhead spot price for natural gas averaged $3.27/mcf. The rest of the $77.7 billion went to midstream (pipelines, processing plants, etc.) and downstream (power plants, petrochemical plants etc.). Natural gas prices escalate from upstream to downstream (a value-added process). So, the total value of the $77.7 billion investment is much larger than just the value of the oil & natural gas.

“All in”, $77.7 billion works out to $2.06/mcf (million Btu).
Regarding Green “Schist”
SUSTAINABLE BUSINESS NOVEMBER 25, 2019
New clean energy investment in developing nations slipped sharply last year: report
Nina ChestneyLONDON (Reuters) – New clean energy investment slid by more than a fifth in developing countries last year due to a slowdown in China, while the amount of coal-fired power generation jumped to a new high, an annual survey showed on Monday.
Bloomberg New Energy Finance (BNEF) surveyed 104 emerging markets and found that developing nations were moving towards cleaner power sources, but not fast enough to limit carbon dioxide emissions or the effects of climate change.
New investment in wind, solar and other clean energy projects dropped to $133 billion last year from $169 billion a year earlier, mainly due to a slump in Chinese investment, the research showed.
China’s clean energy investment fell to $86 billion from $122 billion a year earlier. Investment by India and Brazil also declined, mainly due to lower costs for solar and wind.
However, the volume of coal-fired power generation produced and consumed in developing countries increased to a new high of 6,900 terrawatt hours (TWh) last year, from 6,400 TWh in 2017.
The increase of 500 TWh is equivalent to the power consumed in the U.S. state of Texas in one year. Coal accounted for 47% of all power generation across the 104 countries.
[…]
Reuters
According to BP’s 2019 Statistical Review of World Energy, the “world” generated 15.9 billion mmBtu (converted from TWh) of energy from renewable sources from 2017-2018. This works out to $19.05/mmBtu, about 10 times the cost of natural gas.
| mmBtu | Invested ($) | $/mmBtu | |
| 2018 | 8,463,089,501 | $ 133,000,000,000 | $ 15.72 |
| 2017 | 7,392,040,238 | $ 169,000,000,000 | $ 22.86 |
| 2017-2018 | 15,855,129,739 | $ 302,000,000,000 | $ 19.05 |
Some may take issue with this comparison, because it doesn’t account for the heat loss in generating electricity from natural gas. The average combined cycle natural gas power plant generated 1 kWh per 7,627 Btu. A 100% efficient power plant would only require 3,412 Btu to generate 1 kWh.
While it is true that some of the energy is lost in the process of generating electricity and heating our homes, advanced combined cycle natural gas power plants can achieve >60% efficiency in converting heat into electricity, the 2018 average was about 45%. Modern natural gas furnaces can achieve 90-97% efficiency.
| Energy Returned on Capital Invested | $/mmBtu |
| Ohio “Shale” 2011-2018 | $ 2.06 |
| Ohio “Shale” @60% efficiency | $ 3.43 |
| Ohio “Shale” @45% efficiency | $ 4.58 |
| World Renewables 2017-2018 | $ 19.05 |
And, unlike renewables, natural gas can replace coal on a megawatt for megawatt basis. So, if saving the planet from carbon dioxide was the real objective, the greenie weenies would be all on-board the natural gas bandwagon.
Glossary
bbl = barrel, barrels. Each barrel consists of 42 US gallons. 1 bbl of crude oil contains approximately 5.8 million Btu of energy.
Bcf = 1 billion standard cubic feet (scf) of natural gas.
Btu = British thermal unit.
mbbl = 1,000 barrels.
mcf = 1,000 standard cubic feet (scf) of natural gas, generally equal to 1 million Btu. Technically it’s usually more like 1,020,000 Btu; but mcf and mmBtu are usually treated as being interchangeable. Natural gas prices are generally listed as $/mcf or $/mmBtu.
mmBtu = 1,000,000 Btu.
mmcf = 1,000,000 standard cubic feet (scf) of natural gas.
scf = Standard cubic foot (feet) of natural gas, measured at 60 °F at sea level (14.7 psi). Generally equivalent to 1,020 Btu.
Shale = “Shale is laminated, indurated (consolidated) rock with > 67% clay-sized materials.” Jackson, J.A. (1997). Glossary of Geology, 4th Ed., American Geological Institute. Most “shale” plays aren’t technically shale.
Schist = 1) A foliated metamorphic rock, generally resulting from the deformation of shale and other types of mudstone. 2) A scatological euphemism, as in “green schist.” As a professional geologist, I make extensive use of geological euphemisms… And I don’t care if you think it’s childish.
Data Sources
Ohio Natural Gas Marketed Production
Ohio Field Production of Crude Oil
Ohio Natural Gas Proved Reserves
Cushing, OK WTI Spot Price FOB (Dollars per Barrel)
Henry Hub Natural Gas Spot Price (Dollars per Million Btu)
BP Statistical Review of World Energy
P.S. The stakes are high. Ohio has the fourth-highest retail power sales in the nation. But the state’s two reactors, which account for about 12% of its power generation, are struggling to stay afloat as cheap natural gas pulls down wholesale power prices. Without subsidies, FirstEnergy Solutions has said it will close the plants, which employ 2,200 people.
Republicans, who control both house of the Ohio legislature, say the measure will boost the state’s commitment to clean energy. Akron, Ohio-based FirstEnergy Solutions, which filed for Chapter 11 last year, heralds it for putting nuclear on a “level playing field” with wind and solar.
Environmentalists, meanwhile, blast the measure for scrapping the state’s goal to get 12.5% of electricity from renewables. The American Petroleum Institute says it would shortchange natural gas plants. And Ohio’s largest utility, American Electric Power Co., warned that a bailout for a single company wouldn’t benefit customers at large.
Yeah, well, then let those greenies who want the 12.5% come up with it! That was a crazy number designed to satisfy crazy people!!
That’s why we voted for a bailout to the tune of ~$900M, iirc. The bill, OH HB6, also removed / reduced mandatory money transfer to wind, etc. projects, even though exactly 0% of my electricity comes from wind power. It is actually cheaper on my monthly electric bill now to bail out FirstEnergy than it was to support Wind. Win-Win !
There is a loud, though not necessarily strong, campaign to reverse HB6. An email I received from Ohio Citizen Action this morning is once again asking for support for repeal and canvas door-to-door. I’ll be sure to have the hose ready, j/k.
Thanks for the interesting article, David. Personally, I would like to see a further analysis (unless I misunderstood your post) that takes account of the multi-year nature of the capital investments involved (where appropriate) by appropriate depreciation, and comparing the total (i.e. opex and depreciated capex) annual costs with the annual value of production. Otherwise IMO business-minded readers might get the impression that Ohio shale is a pretty poor use of lots of $$$ (but not half as bad as investing in ‘renewables’).
My analysis was very simplistic, particularly on the renewables side, where I don’t have as much information to go on.
In a formal analysis, the value of the reserves would be discounted, generally with a 10% discount rate. The breakdown of upstream investment is pretty comprehensive. It includes CapEx (land, drilling) and OpEx (lease operating expenses (LOE), royalties & renewals).
Proved reserves are the volume of oil & gas economically recoverable from existing wells. From an oil & gas producer standpoint, the upstream investment plus the cost to hook up to the pipeline infrastructure would comprise the finding & development (F&D) cost. That would be a bit more than $53B over 8 years to generate $30B in revenue over the 8 years and $75B in value to be recovered over the life of the wells, most of which will be recovered within a few years because these wells have steep decline curves.
If drilling stopped at the end of 2018 and they only produced the current proved reserves, they would earn about $105B on a $53B investment, with about 90% of that return occurring within 10 years.
Some companies have F&D costs even lower than $1.42/mcf…
https://s2.q4cdn.com/766046337/files/doc_financials/2018/q4/20181101-NFG-IR-Presentation-Q4-FY-18-FINAL.pdf
Wouldn’t it be, “The Ohio States’s Shale?”
In what context?
The possessive of States is States’.
The possessive of State is State’s.
It was a bad joke, sorry. The Buckeyes emphasize “The” in The Ohio State University.
https://www.thedailybeast.com/the-ohio-state-university-files-to-trademark-the-word-the
I should have been able to guess that… 😎
When you throw in landowner royalties of 12.5% to 20% common in the area, the economics at $2.50 gas get pretty skinny for the drillers. Since a lot of many of these companies’ value is in soon to expire leases, they get the unpleasant choice of drilling or surrendering leases. At present day gas prices, the drilling won’t go on forever. It becomes a question of how slowly they can afford to go out of business.
It’s not unusual for Marcellus/Utica players to have F&D costs below $1.00/mcf…
F&D includes royalties.
In Southeastern Ohio was paying $100.00 per acre to $5,000.00 per.
An Rigs went up.
The people seem pretty happy.
“Modern natural gas furnaces can achieve 90-97% efficiency.”
..
1) Not all gas furnaces in operation are “modern,” some have been in use for decades
..
2) Heat from electricity is 100% efficient, irrespective of the age of the equipment.
https://insideclimatenews.org/news/02102018/natural-gas-pipeline-explosion-massachusetts-home-heat-pump-district-heating-electricity-solar
https://wattsupwiththat.com/2018/10/04/massachusetts-residents-get-to-freeze-in-the-dark-for-social-justice/
Middleton, my post was about “efficiency.”
…
Your response was about “costs.”
…
Please respond to my post, and don’t change the subject.
Productivity is the cost per unit of production.
$2.00/mmBtu is 10 times as productive as $20.00 per mmBtu. The thread title starts with “Energy Return on Capital Invested”… A 100% efficient system that costs 10 times as much per unit of energy delivered as a 45-63% efficient system is the textbook definition of mental greentardation.
Having high efficiency of a “widget” without regards to its capital cost or operating cost is completely and entirely meaningless in any conceivable large scale implementation.
The only “hypothetical” place where extremely high efficiency of a heating source would be justified regardless of an astronomical price tag would be say to send a nuclear-powered ion drive space ship on 10,000 year trip to another star system.
Here on Planet Earth though, if I have an 80% gas furnace, and the gas to generate the needed BTUs is 1/3 the cost of electricity to generate the same # BTUs, albeit at 100% efficiency, I’ll take natural gas till the cows come home. As for emissions, the electricity is likely coming from either coal, or natural gas anyways, especially true at night and on cold windless winter nights.
costs will reflect those efficiencies though, and David offered calculations of the relative costs of investment per thermal unit with efficiency discounts for gas, although those discounts are high for home heating even with older equipment which tends to hover between 70 and 80% at the worst.
you are right that there is much installed base of that older equipment, but electrical generation efficiencies from gas at their best are less efficient than home heating at its worst-making the ‘green’ efforts to block residential gas hookups folly of the most sociopathic kind.
(It should also be noted when quoting nameplate efficiencies for modern gas heating equipment that the efficiencies can only be obtained with relatively low return temperatures which are easily obtainable for gas furnaces but not so easily with gas boilers. Our utilities have cursed many boiler consumers who had solid cast iron boilers by subsidizing them scraping decent boilers and replacing them modern low mass boilers that are not a good match for their emitters. They will run at higher stack temperatures than their flus are often designed for and won’t have anywhere near the service life of a simple cast iron boiler. Just one more example of government making the wrong decisions for people as these programs are the result of utilities regulation. )
Heat from electricity may or may not be 100% efficient, however generating that electricity is far from efficient. In most cases you will lose at least 20% to 40% of the energy before you get to the heater element.
Suggest you look at more reliable/accurate sources.
The U.S. Energy Information Administration (EIA) estimates that electricity transmission and distribution (T&D) losses average about 5% of the electricity that is transmitted and distributed annually in the United States.1
https://www.eia.gov/tools/faqs/faq.php?id=105&t=3
But as already discussed, even a Combined Cycle Turbine Generator “…can be over 60% efficient…”, which means >30% of your energy is already wasted. Bear in mind that CCTG is about as efficient as you can get, so the average is less than that, and there still exist single pass coal-fired plants whose efficiency only approaches 25% on a good day. Add the transmission and distribution losses and you’re pretty close to losing half the energy that got delivered to even a CCTG power production plant. On average then, more than half the precombustion energy does not get to a paying customer.
Which is why we need research on direct conversion of nuclear energy to electricity. The effort trying to make solar panels more efficient could be applied to nuclear to electricity conversion.
Christina
What is the efficiency of converting oil, gas, or coal to Electricity to achieve that 100%? (Actually, there are losses in the external supply lines.) If an electric radiator is used in the house, then all the heat is captured in the air. However, if there are resistance coils or heated fluids in a ground slab of concrete, roughly half of the heat may be lost to the ground. Radiant heat, such as from heat lamps, have been shown to keep people comfortable at lower air temperatures than from common central heating. However, some of the electricity produces visible light rather than infrared, lowering the heating ‘efficiency.’
If the primary production of electricity is from wind or sunlight, one should consider the efficiency of such a process as compared to a technology that would produce a higher yield, but require a larger capital investment to achieve the higher efficiency. For example, commercial photovoltaics of 10-20% conversion efficiency will produce only half the electricity of PVs certified for spacecraft use, for the same area. However, the cost is several times higher!
Things are rarely so simple as to be able to make general statements such as you have.
“However, some of the electricity produces visible light rather than infrared, lowering the heating ‘efficiency.’”
Not really, except for light lost to the exterior through windows, that visible light is absorbed in the house and converted to heat.
tty
What you say about converting visible light to heat is true. However, the point being made about efficiency is that radiant heat can compensate for a lower ambient air temperature to make people feel comfortable. What is important is the instantaneous perception of warmth deriving from a directed beam of IR. The infinitesimal increase in background temperature is inconsequential if the attempt is to keep people comfortable whilst in a cool room. Whereas, a 10% increase in IR would be perceptible immediately. So, the IR conversion efficiency (IR being used to compensate for a low ambient temperature), is an important consideration for the immediate task. Energy is never ‘wasted’ as it is always converted to heat. But, is the heat useful?
Let’s say that you have a 750 watt heat lamp directed at someone sitting at a desk, and it is keeping the person comfortable. Replace that with a narrow-spectrum 750 watt cool LED . By your reasoning, all of the energy from the LED will get absorbed in the room, raising its temperature. However, I seriously doubt that it will be as effective as the heat lamp at keeping the person comfortable. Therefore, one could define “efficiency” as how effective a particular lamp is in keeping a person comfortable for a given expenditure of power.
This “100% efficiency” for electric heating is misleading. A heat pump is “electric heating” but is far more than 100% efficient. At 10 C outside the energy efficiency can be 600%. At very low temperatures (-25) it is still above 100%.
Resistance heaters are 100% efficient but that same power running a heat pump will average far more than that through a heating season. That’s why they are so popular.
The average efficiency can be seen in. The chart above showing the cost of electric heating ($64) and the heat pump ($21.4). That gives an efficiency of 300%. The reason is that it is far easier to move heat energy than to create it.
Heat pump water heaters are also similarly efficient.
I notice you did not compare the operating cost of the heat pump against the cost of a natural gas condensing furnace. And in most U.S. locations you could still do it cheaper with a good old fashioned 80% efficient furnace.
My apologies, I meant 0.4% – 0.7% losses & unaccounted for gas.
https://www.eia.gov/naturalgas/annual/pdf/table_a01.pdf
PV panels installed on one’s roof deliver the power directly to the building, no transmission losses from power plant to building. Too many of your apples are mixed in with the oranges.
All in for both Ohio “shale” plays… $2.06/mmBtu.
All in for “renewables”… $19.05/mmBtu.
Natural gas power plants in the US averaged 45% efficiency in 2018.
$2.06/mmBtu / 0.45 = $4.58/mmBtu
Is the PV system grid connected?
If it’s not grid connected does it have a battery? What is the efficiency of the battery?
Given that a grid connected system is much cheaper, I’ll assume it’s grid connected. You have to account for line losses. What’s the efficiency of the inverter?
Cristina, what percent of a building’s energy requirements do you believe roof mounted PV panels can supply? Pick any location in the U.S. you like.
I have never seen any analysis that suggested roof PV could power anything more than lighting if the building was set up in a stand-alone situation.
Even public buildings in Arizona do not attempt to rely upon roof top PV for temporary back-up power during outages, despite plenty of lead time for charging batteries.
SR
While what you state is trivially true, PV’s only provide power when the sun shines and the clouds aren’t too thick.
In places like Ohio you have to consider that for a substantial fraction of the year, the panels will be covered by snow.
“PV panels installed on one’s roof deliver the power directly to the building”
Yes, a common mistake. They do not. You power your building from the grid. The point of the panels is to provide power to the grid, whether it needs it or not.
Your savings from installing solar do not come from the fact that you use less grid power, or draw less from your power company. You draw exactly the same as you did before you installed the panels.
Your bill falls because you are being paid at artificially set prices for the electricity you generate and pass back to the grid.
You could get the exact same savings by installing the solar panels on a shed in your garden, with no connection to your house. and feeding the same amount of power to the grid.
The real losses incurred by solar are intermittency. The times when the panels deliver do not coincide totally with the times when the power is needed. In some very hot climates it will – a midday peak of aircon demand will coincide with a peak in generation. But go to any northern climate, and the peak will be about 5-8pm, when, alas, its dark and the sun don’t shine.
Deliver when its not needed, and it cannot be used. No-one would buy wholesale solar unless compelled to by law for this reason. Not at the same price as natural gas supply, which is to say, supply when needed. Absolutely never at the elevated prices which are regulated.
At one point in the UK adventure into this madness, solar panel owners were being paid about 8 times the wholesale price to supply the electricity companies power they did not need and could not use. And then as night and winter came, and demand rose, and it really could have been used, they were unable to supply anything.
Its the same with a wind turbine in your garden. Neither wind nor solar are powering your cooker or washing machine.
“In some very hot climates it will – a midday peak of aircon demand will coincide with a peak in generation.”
Nope. A factoid frequently quoted but completely wrong. Google “Duck curve”. And it gets even worse in the tropics. Google “Nessie curve”.
If we are talking transmission losses, one must also consider “unaccounted-for gas”, i.e. losses between the supplier and consumer, prior to the gas meter. That is, summing all of the customer meters does not equate to the supplier outgoing meter. The EPA estimates these transmission losses at 4%-7% of natural gas leaking around lines (mostly connectors and junctions) and at homes. This is rarely included in the comparison of heating efficiencies (or outright ignored) while electric transmission losses are often included.
Christina, you are welcome to come to my house in Ohio and make measurements, I’ll even make cookies.
Ohio has a lot of strengths… Reliable sunshine is not one of them.
Christina Widmann December 2, 2019 at 2:52 pm
PV panels installed on one’s roof deliver the power directly to the [ ] DISTRIBUTOR,
green electrons don’t carry personal id cards with Photo ID on them:
https://www.google.com/search?q=personal+id+card+with+photo&oq=personal+id+card+with&aqs=chrome.
How many natural gas producing shale wells will produce for 20 years like a wind trubine or a PV panel? How do you account for these differences in your investment analysis?
Google “time value of money”. 90% of the return on investment for a shale well occurs within 10 years.
And on the 11th year a wind turbine continues to produce power, as does the PV panel.
Google “time value of money”… The try to fathom the depth of your stupidity.
Dave, the stupid is strong in Chrissie. You can’t fix stupid.
I do not think resorting to name-calling is necessary or helpful, David. You undermine your own arguments. Your logic and well-researched data stand on their own; stick to your strengths, on which the rest of us rely.
For an average of 5 more years before failure. See that term, FAILURE. That’s your position, that is.
You mean 20 years of 25% of name plate power, Christina?
And 20 years of tax-subsidies that steal money from the productive economy?
And all for nothing?
” a wind trubine” won’t last 20 years without major repairs …
Your flailing around with nonsensical claims is all unicorn spittle and manure.
• Solar only operates for a few hours while the sun is above the horizon by a certain amount.
• Solar doesn’t work well when it’s cloudy, or covered in snow, or dust covered
• You utterly fail to connect the dots to how many solar arrays are required to heat one sq. foot of living space.
• forcing voltage and amperage through resistance wire is never 100% efficient; not even close.
Natural gas wells can produce for decades and supply gas for large neighborhoods up to small cities.
Wind turbines fail to meet more than 25%-30% of the nameplate capacity during the best of their times.
Wind turbines have not been achieving that 20 year lifespan. Many fail well before 20 years unless they are substantially rebuilt every few years.
PV panels are even less able to meet twenty year timeframes. Nor should one ignore that solar PV requires dedicated hectares of land.
For a fun fact, you should calculate how much land is required by solar or wind turbines to meet 2030 goals…
Farms, forests, parklands, etc. will be consumed by the maw of falsely named renewables. Beside wind turbines destroying wildlife, especially rare and endangered birds and bats, wholesale.
Then there is the problem that inconsistent wildly variable alleged renewables produce poor quality electricity that endangers industry, computer server farms, mainframe computer installations and even household electric and electronic devices.
Based on past performance, neither that wind mill nor the PV panel will still be producing power in 20 years.
If you are serious about capital investment, I suggest you compare the 5-year stock price of (NYSE) CHK and the 5-year stock price of (XCSE) VWS.
..
Investors know more than you.
Stock purchases aren’t capital investments.
Total fail Mr. Middleton. Stocks are capital investments. If you buy a stock low, and sell it at a profit, you pay capital gains taxes.
…
If you disagree, please tell us why a share of Chesapeake bought in 2014 for $20 is now worth only $ 0.60 ? Why is the outlook (share price) for Vestas always rising, and the outlook (share price) for Chesapeake so dismal?
Are you really this stupid? I provided you with the definition of “capital investment”… Do you need it translated into Latin?
You provided a link to what you think a capital investment is.
…
If I go out and invest my capital (cash) in Exxon/Mobil stock, I will reap the rewards in both dividends and capital appreciation.
…
You think that investing capital into XOM is “stupid?”….. I will not accuse you of having rocks in your head.
It’s the fracking definition. Your inability to grasp the definition is your problem.
You didn’t answer the question of why Chesapeake is worthless, because as you well know, they are almost exclusively in the business of natural gas/fracking.
Chesapeake was built on the assumption that natural gas prices would always be well above $6.00/mcf. The late Aubrey McClendon on August 1, 2008…
https://seekingalpha.com/article/88789-chesapeake-energy-corp-q2-2008-earnings-call-transcript?page=-1
Natural gas prices have been below $6/mcf since December 2008 and below $4/mcf since August 2011… https://www.eia.gov/dnav/ng/hist/n9190us3m.htm
Most oil & gas stock prices are still recovering from the collapse of oil & gas prices from 2014-2016. The collapse in product prices actually improves the Energy Returned on Capital Expended for oil & gas.
Stock prices have nothing to do with productivity.
Christina Widmann December 2, 2019 at 5:05 pm
Nice try
Vesta is on the London exchange and Chesapeake is on the NYSE.
lets see CHK is 7.5% USD with a PE of 4.25
now what are the numbers for VWS.?
Oh and lets see if you can do market cap for both.
The price of a stock is not what matters but rather is Div, and PE.
michael
Chesapeake’s ex-CEO stole from the company and for edit to sell stuff to stay as a company. When investors found out they abandoned the company. Why not look at OKE or KMP?
I don’t think McClendon technically stole from the company…
However, he seriously failed in regard to having a business plan that could accommodate $2-3/mcf gas prices. A lot of early “shale” players made similar mistakes.
Why are investors abandoning natural gas (Chesapeake) for wind power (Vestas) ?
What the frack does Chesapeake’s stock price have to do with the cost of natural gas per mmBtu?
Christina,
There wouldn’t be a single wind turbine or solar panel installed in the US without the ITC and PTCs (tax credits from tax payer monies). Solar and Wind farms are built by their investors to harvest subsidies (the tax credits), nothing more. That they harvest wind or solar energy is a merely side-effect.
If you doubt that assertion (about why wind and solar exist at all), then ask yourself, “Why in many instances do power grid operators pay wind farm operators not to produce power?”
Read “The Frackers”. Great book with the side benefit of explaining why one ought to steer clear of companies such as Chesapeake. Hint: It has nothing to do with the relative benefits of gas vs wind, and much to do with the greed of the management and total disregard for the stockholders.
Widmann, why didn’t Solyndra fly?
Doug
That is a great book that succinctly describes the ‘early’ days of this Shale Revolution.
As seen through the eyes of a few of the major pioneers, it is highly educational reading for interested observers.
I wouldn’t be quite so harsh on Aubrey McClendon and Chesapeake. The late Boone Pickens once stated that oil would never fall below $100/bbl ever again.
Many, maybe most, of the pioneers in this business went broke at least once. The boom-bust cycle has always been viscous, even before “shale”.
This is also a great book…
The Greatest Gamblers: The Epic of American Oil Exploration by Ruth Sheldon Knowles (1959)…
The true miracle of “shale” is that it thrived through one of the worst price crashes (2014-2016) in recent history. It’s not a panacea, but it is real and it is a game-changer.
They aren’t.
“Stock purchases aren’t capital investments.”
..
https://www.thoughtco.com/how-corporations-raise-capital-1147906
…
“If a company is in good financial health, it can raise capital by issuing common stock. “
Issuing stock raises capital. People trading your stock doesn’t.
Mr. Warren Buffet of Berkshire Hathaway has a boat load of capital (cash)
…
Where does Mr Buffet/Hathaway make capital investments?
…
He buys stocks.
No. He buys companies, generally at a huge discount because the stock market undervalued the assets. That’s still not capital investment.
Stick to drilling holes in the ground Middleton, because you are clueless when it comes to finance.
“Issuing stock raises capital.”
…
Yes it does, and trading stocks is just buying and selling THAT CAPITAL
…
Stick with oil companies Middleton, because you would fail on Wall Street.
Good fracking grief. A stock offering raises capital. This increases liquidity. When a company’s stock trades on the market, it has no effect on their liquidity. Liquidity is equal to cash plus borrowing base. I don’t know of any oil company dumb enough to collateralize their borrowing base with stock held in the corporate treasury. Debt is collateralized with assets, usually proved reserves.
Hey Middleton, did you know that if you owned a decent portfolio of stocks, you could go to a banker and borrow cash (capital) using said stocks as collateral?
…
Has the company you work for rewarded you with stock options?
I wouldn’t work for a company that collateralized it’s debt with stock, particularly stock it didn’t own.
Says the person who can’t even figure out what a capital investment is.
And besides, Christina, stock account advisers don’t have as much fun as us geologists walking through the stratigraphic record, finding dinosaur bones, finding a fossilized patch reef community well preserved, and catching trout for lunch, all the time without any adult supervision. Who’s smarter now?
When that fossilized patch reef has >30% phi and Darcy+ k… And 80% oil saturation, it’s cooler than schist!
David
What have you been rolling in to attract such a persistent gadfly? 🙂
It’s like this scene in The Outlaw Josey Wales…
Solar and wind cannot give you back the energy it took to produce them. Without substitutes they would not exist. If you are so sold on them unhook you house from the grid and get an electric car and charge car only from you panels. If you do that somehow, I think you would rethink solar. I live in Arizona and solar does no pay for me even hooked to the grid. It only took me about fifteen minutes to figure that out with pencil and paper. Oh by the way Saturday I saw a Tesla being loaded onto a wrecker, I assume it ran out of battery. It certainly was not in an accident, that the trouble with electric cars they is no such thing of a gallon of charge that you can carry easily.
Mark, I know this is off-topic, but you should be made are that there are mobile charging options for electric vehicles. AAA and several other such companies can come give your dead battery (assuming you ran out of charge, not some other electrical or software issue) a jolt. A good 15 minutes on the side of the road with a mobile charging unit will get you limping to a nearby (20-30 miles maybe) charging station. Of course, if one runs out of charge far from a charging station, well, you can only plan so far ahead for certain levels of poor planning.
How much would those renewable stocks be worth if the government subsidies were eliminated?
Exactly.
I imagine much of the investment in those stocks are from investors that know there will be artificial growth due to subsidy, then sell prior to subsidy termination shock.
Natural Gas has been drilled for since I was a kid in NW Ohio. My grandfather had a NG well on his farm that couldn’t be tied in profitably so they put a pipe into his house and he had free heat for decades.
Of course none of this NG will be used in the Northeast, even though it is really low cost and clean. About the only way would be for it to be piped to an LNG export facility, put on a ship and unloaded at a port in New England somewhere. You can’t pipe it there. High taxes, high electrical rates (and possibly future shortages) and bird shredders everywhere. Why would anyone live there?
‘ grandfather had a NG well on his farm ”
I came from western Pennsylvania. Locals had gas on the farm (a great aunt, for one), and friends had a swimming pool (made from a railroad car) heated with the gas from their property.
We painted the whole thing a light blue. At the time the word ‘albedo’ was unknown to us.
I guess we should have painted it black to get some Sun heat.
rbabc
That is a series of highly dubious statements, specifically that the gas is not being used locally.
Suggest you do a quick check on the MASSIVE amount of electricity currently – or in the near future – being generated by the onslaught of huge Combined Cycle Gas Plants in Ohio and Pennsylvania.
These ultra efficient power providers are a big reason for low (and declining) electric bills.
Global manufacturers – including a huge Australian steel producer – are flocking to this region.
Not only one, but possibly THREE new steam crackers may be operating in this region in the coming years. (PTT has been joined by Exxon – if heavy rumors prove true – in planning on these plants which will attract a wide array of new industries/businesses for generations to come.
Joe B .. I was a kid in NW Ohio over 50 YEARS AGO. Things were a little different then.
HEADLINE: Geologist saves the world from Global Warming Hoax! Dateline: Ohio.
Once again our intrepid hero does battle with the forces of darkness, in this case the cult religion of CO2, and returns many lost souls to the side of Truth, Justice and the American Way! Thanks, Dave, for another great expose of the lies and fallacies promoted by the Green Blob. Speaking of euphemisms, is being a “schist head” the same as having “Schiff for brains.” I know the latter requires one to go around with eyes bugging out and spouting lies whenever the lips start moving; perhaps it is merely an advanced form of “schist headedness?” I’d better start over with a clean slate and try to be gneiss this time; more geology, please!
Now THOSE are the kind of REAL hockey stick graphs I like to see!
There is one HUGE assumption when comparing a new technology (like wind turbine farms or solar farms) to an established technology (like burning natural gas). One has to “presume” they understand the 20 or 30 years costs for a new technology, while one has a lot of historical data on the established technology.
It would not surprise me AT ALL is the 20 or 30 years costs for green energy are misunderstood and greatly underestimated. This would include the costs of recycling and land reclamation in both cases.
Analysis of delivering dependable energy (as opposed to intermittent energy) would also drive green energy upwards in costs – maybe by a factor of around 70% to 80% – to account for standby power required for when the green energy production fails.
(like wind turbine farms or solar farms)
They do harvest subsidies, so there is that sense in calling them farms.
Facility is a better term.
greenschist facies. made me dig out my old Deer, Howie and Zussman, and reminisce.
thanks for the memories.
though in this context, greenschist feces may fit better.
Gneiss… 😉
not sure how many generations it will take to see anything from our mineral rights in the Eagle Ford….. The same land produced nicely for my grandmother from the shallower Austin Chalk in the 70s. It made her twilight years a bit more comfortable. Conventional wisdom says $80/bbl before it might see some interest.
OTOH–
I just did some back-of-envelope calculations of the Ivanpah CSP facility to see how it’s doing, not considering braised birds and tortured turtles. (They can either adapt or perish; they’ll learn.) But–the numbers look so impossible that I must have done something wrong. First thing I did was look up just what the wholesale price for electricity is in California; came up with this graph. Ivanpah will produce electricity during the period of lowest wholesale price, so take $20 per MWHr.
“The facility, costing $2.2 billion was developed by BrightSource Energy and Bechtel.” What would be the life expectancy of such a plant? Considering that solar voltaic life is set at 25 years, and considering UV degradation of mirrors, abrasion by wind-blown sand, heliostat servo failure, corrosion of anything transporting hot NaCl–I’d say 25 years is reasonable life for this plant too. $2.2 X10E9 divided by 25 requires an amortization return of $88 million/year.
So how much is it producing? This table is from the Wiki article. The average over 5 years is 0.651X10E6 MWHr/year. Lets take a more rosy outlook of the 2018 production continuing, say 760,000 MWHr/yr.
Ivanpah Total (392 MW gross)
Net electricity production (All) [MW·h]
Year Jan Feb Mar Apr May Jun Jul Aug Sept Oct Nov Dec Total
2014 10,485 9,630 19,959 24,833 44,784 64,275 35,967 44,070 43,751 56,013 47,177 18,141 419,085
2015 21,888 30,273 57,090 75,304 47,956 77,534 61,681 72,806 66,147 36,971 60,474 44,998 653,122
2016 25,439 67,254 58,409 38,449 43,436 65,721 98,849 65,631 82,215 61,312 62,052 34,272 703,039
2017 37,855 33,828 50,642 40,589 87,013 97,677 66,394 67,642 75,241 77,785 40,801 43,931 719,398
2018 48,873 43,963 59,181 62,060 76,438 115,737 63,197 78,754 91,706 62,396 57,871 n/a 759,996
Total 3,254,640
760,000 MWHr X $20/MWHr = $15.2 million/year. When just the amortization cost is $88 million/year. This doesn’t consider operating cost, maintenance cost–or natural gas cost to melt the salt every morning. It is using 1,262,887 MMbtu of natural gas per year. Lets use $2.50/MMbtu. That’s another $3.16 million on the wrong side of the ledger.
So a plant that will cost at least $100 million/yr in amortization, operating and maintenance cost is returning $15.2 million/yr in product?? I must be missing something major, this is just too crazy to be corrected by minor errors. Someone please point out what it is.
That is so true, the dirty little secret is that the norm for green energy.
2nd problem you have is with lowest “$20 per MWHr”
…
Not even close to reality: https://www.eia.gov/todayinenergy/detail.php?id=34552
Yes… You are that fracking stupid. This is from the EIA link you just posted…
ERCOT-Houston was least expensive in Jan 2018, at just over $20/MWh. ISO-NE (New England) was most expensive at ~$75/MWh, CAL-ISO (California) was next most expensive at ~$45/MWh.
Ivanpah feeds into CAL-ISO
So does a lot of other stupid-@$$ green schist… your point?
Look at graph…..minimum for CAISO is $20, max is $55. So Len Werner’s analysis is flawed using the minimum and not the average.
CAISO is the red curve. Are you color blind as well as stupid?
WTF are you talking about?
Christina, there comes a point when it is best to stop digging. Sadly you’ve gone down too deep and shown yourself to be illiterate in the fields of economics and energy production.
She’ll strike oil soon.
Will she melt like the Wicked Witch of the East?
Please remember that a lot of California pricing changes rate with time of day; a graph that failed to reproduce in the paste showed the time-of-day pricing, and indeed $20/mwHr was reasonable for any period of the day during which Ivanpah has a reasonable output.
However, even if in a fit of fantasy you double the price of the electricity from Ivanpah–what difference would it make? The facility is costing over $100 million a year in amortization and operating cost. I recently invested money that has a guaranteed 5% return per year, and all I have to do is sit here at a computer and try to get people to understand the economics of Ivanpah.
At least my investment isn’t failing.
And I found the graph I used; it still wouldn’t reproduce, but here’s the link.
https://www.eia.gov/todayinenergy/detail.php?id=32172
So far I think my analysis is mostly correct, but I’m prepared to be shown wrong; presently I’m still baffled at how the decision was made to proceed with this…thing. I would have to be an order of magnitude out somewhere for it to be viable.
I’m fairly sure that the birds and turtles didn’t have a say.
To be serious, one needs to ask where the ~$100 million a year to operate Ivanpah is coming from. For everything I mentioned, the checks have to be issued; every workman running and maintaining the facility expects a paycheck every 2 weeks and cashes it; every supplier shipping new mirrors or servos or natural gas or salt or conducting dead bird pick-ups every morning expects to be paid every month; the banks that lent their part of the $2.2Billion expect their monthly payments to be made.
Where is the money for all that coming from?–it certainly doesn’t appear to be from sales of electricity. Someone has to be taking a financial bath; every month, month after month, year after year–who is it?
Of course, Ivanpah suffers from the handicap of not having been designed with storage capacity. Well, Crescent Dunes solved that–
“The Crescent Dunes Solar Energy Project is a 110 megawatt (MW) net[3] solar thermal power project with 1.1 gigawatt-hours of energy storage,[1] located near Tonopah, about 190 miles (310 km) northwest of Las Vegas.[4][5] It substantially missed its intended power production by only achieving about 40% of its capacity factor on an annual basis (i.e., 20% of nameplate capacity), resulting in lawsuits and changes of control.[6][7] The site has not produced power since April 2019, and its sole customer has cancelled their contract.[8] ”
https://en.wikipedia.org/wiki/Crescent_Dunes_Solar_Energy_Project
Christina–is any of this getting through to you? Did you personally invest in either of these–that you know of? It’s not as if you had to search hard to find some facts. Would you invest in either of them now? Do you still consider them viable? Why?
Seriously–I’m just a geologist. But I’m not a broke one.
Len,
Ivanpah’s checkered history was discussed a few years back by Wayne Lusvardi-
https://calwatchdog.com/2014/04/28/ivanpah-morphs-into-gas-solar-hybrid/
The owners of the facility aren’t paid wholesale market prices for the output from the plant. The output was contracted via must take long term PPA contracts with built in time of delivery factors that push the costs on average to more than $200 a MWhr.
Thanks, kakatoa, an interesting article(s)– but that the electricity price is subsidized from somewhere else by a PPA does not change the economics of Ivanpah; only the method of subsidy for $20-value electricity is changed. Someone is still taking one heck of a bath on this thing, and I’m staggered that it is still propped up.
It does appear that Crescent Dunes power purchasers had enough prior warning that their PPA was written differently. Ivanpah from any sane business model should never have been built, and it’s baffling that it is still in operation.
It will eventually collapse in bankruptcy, with lawsuits, as survivors of the Paradise fire begin to draw the links between the $200/MWhr price paid and the condition of the power lines that (may have) caused that fire. Right now, if Ivanpah is still being paid any electricity price that allows it to continue operating, someone else’s fire is in the making.
(BTW–“Ivanpah generates power for about 12 hours of solar insulation each day…” Proof-reading anyone?–what is ‘solar insulation’?)
insolation (not insulation) – exposure to sun’s rays
“The estimated growth in proved reserves from 2011-2018 is worth $75.7 billion.”
Three problems with this statement. The first is the word ‘estimated’. The second is proved. The third is reserves.
Estimates depend on premises that tend to be optimistic. It is not uncommon for reported reserves to be written down by more than 50% once the data comes in.
Then there is the ‘proved’ part. The SEC changed the rules to do away with the test wells that established that the formation had the level of economic resources that could be claimed as reserves. Without that data, there is too much guessing to come to any sound conclusion.
That brings us to the word ‘reserves.’ To be a moved into the reserve category, a resource requires valid data that does not exist in the case of shale. From what I have seen, the shale companies have piled on debt and destroyed capital over the past decade. Although no positive free cash flows have been generated, the accounting uses a number of tricks to make the operations appear economic. One trick is to use EURs that are not supported by the production data. That allows the accountants to write down 30% of the cost, to pick one number, even though half of all production has already taken place. While that means that assets will have to be written down at some point in the future, the short term coast remains clear for as long as the companies have access to borrowing so that they can plug the funding gaps.
I don’t see why it makes sense for us to look at a bunch of projections when the actual data clearly shows that shale is not economic. If it were, the shale company bonds would not be selling for $0.55 to the dollar.
Abject nonsense. Proved reserve write-downs are mostly the result of product price changes, particularly since the adoption of probablistic methods since 2008. There is no “guessing” involved in booking either proved or probable reserves.
So, if saving the planet from carbon dioxide was the real objective, the greenie weenies would be all on-board the natural gas bandwagon.”
David cites One of the Five irrefutable, plainly obvious truths that demonstrates that Climate Change Policy as pushed by the UNFCCC COP attendees and the “Greenie Weenies” has nothing to do with Climate.
The other Four irrefutable evidence truths that UN Climate Policy has nothing to do with Climate:
1: Greens complete rejection of nuclear power, although it is the only emissions-free, reliable, high energy density power source that can power a technological society through the next few millennia.
Irrefutable truth: Climate Change policy clearly has nothing to do with actual CO2 emissions.
2. The utterly meaningless for climate change INDC’s in the Paris Climate Agreement from COP21 in 2015. Bjorn Lomborg’s analysis of the INDC’s showed, using the IPCC’s own claims/models, that the even if all the Paris INDCs were completely met, the temperature change difference by 2100 would be undetectable or so low to be meaningless versus the costs to world GDP. Even the climate Godfather, James Hanson said exactly this about the INDCs. The COP process is meaningless for CO2 emissions. UNFCCC-COP exists for one reason, that is wealth redistribution and UN bureaucracy growth via the Climate Aid Fund and demands for $100Billion every year and to keep growing that number. Meanwhile, Obama’s attempt to force his INDC on the US via his CPP would have meant economic destruction via skyrocketing domestic electricity prices.
Irrefutable truth: The UNFCCC COP process for emissions reductions has nothing to do with Climate and everything to do with “show me the money.”
3. The allowance for China, India, and the rest of the developing world to far surpass the developed nations’ CO2 emissions, with no limits to at least 2030. The only agreement that by 2030, they start limiting CO2 emissions to whatever they are then.
Irrefutable truth: Clearly there must not be a Climate Crisis when the largest emitters have no current emissions limits.
4. The complete and unwavering resistance to mining and mineral extraction for the raw materials needed to build wind turbines, solar panels, EV motors, and lithium batteries. From the Pebble Mine in Alaska to new copper mines in Arizona, the Greens in the US are stridently opposing developing new domestic sources for critical copper, cobalt, and Rare Earth minerals. If the need to continue building wind turbines, EVs, and batteries are as critical as the Greens claim for renewable energy, then where do they think all those raw minerals to do that comes from?
Irrefutable truth: The fact they demand copper, cobalt, lithium, steel, aluminum, and Rare Earth devouring windmills and solar panels and EVs, yet they ignore how the huge amount of materials for them are acquired.
Irrefutable truth: Demand for massive amounts of copper, lithium, cobalt, and Rare Earths clearly demonstrates their renewable energy “solutions” have nothing to do with climate or the environment.
Hmmm….. do those three hockey sticks outweigh someone else’s single hockey stick?
My only issue is the resistance to building more nuke power plants. The Chernobyl plant accident was caused by human error, nothing else. Wildlife is thriving in that area. A video of what IS going on was shown on TV some time back and is still available online, and people are moving back there. I was quite impressed by the brief shot of a 6+ foot long catfish thriving in the cooling pond area. Not keeping land clear allows Mother Nature to move in and add many layers of soil from decaying organic matter to the damaged area, resulting in the burial of the damaged soil. In about 100 years, the damage will be completely buried and the radiation will likely have decayed substantially.
How many nuclear power plants are there in the USA which are successfully and quietly going about their business supplying cheap electricity to the population in general. I have no census count, but there are LOTS OF THEM, and I see no valid reason to avoid building more. The coal-fired power plant to the north of me moved elsewhere to use natural gas because it is cheaper than coal.
That said, natural gas and coal are both finite resources and nuclear power is/will be the only valid, and proven, way to continue to supply electricity to the general population ad infinitum. The problem of exhausted rods disposal still remains, but there must be some way to put even that stuff to use.
Chernobyl was a fatally flawed design and incompetently operated… Three Mile Island was an accident caused by human error.
Nuclear power faces three obstacles:
1) A widespread irrational fear of radiation.
2) NIMBY’ism, which prevents the safe disposal of nuclear waste.
3) Very high initial construction costs.
Otherwise, it is the best, safest, most reliable power source. None of those obstacles are insurmountable… However, human irrationality may be insurmountable.
David, I agree except for reworking #2. We should not “dispose of nuclear waste”, but rather “recycle spent nuclear fuel”.
I understood that “Chernobyl” was the result of a trial to see if energy during a shut down of a reactor could be recovered. This required that control systems be shut down. When the trial went wrong the reactor could not be controlled resulting in steam generated explosion with disastrous consequences. i.e not a design fault.
A trail conducted by incompetent operators on a reactor with fatal design flaws…
[…]
[…]
https://www.world-nuclear.org/information-library/safety-and-security/safety-of-plants/chernobyl-accident.aspx
The big question is, Dave…what exactly is horst schist?
It used to be a shale formation before it got smooshed into schist on an up-thrown fault block.
That was a big fat slow pitch softball, Dave.
You coulda slammed it outta the park!
Search for Kennecott Copper mine or Bingham copper mine and look at the pictures. This is what is needed for copper. The same environmental destruction will be needed for all of the rare earth elements needed to make all of the renewables. Worse, if mined in the US, most of these areas will be in the federal protected areas of the US. How much fossil fuel is burned and CO2 emitted digging these holes? How can anyone claim to be an environmentalist and allow this destruction? The LEAST environmental impact is NUCLEAR. Eventually, we will have fusion, at which time we can switch to that environmentally friendly source of energy. The need for copper and aluminium are needed regardless of how the electricity is made.
David,
I realize that fracking isn’t your direct domain (you do oceanic), but I wonder what your view is on the fracking industry’s economics.
I see that EQT’s net cash flow has been positive for many years, even as their net income rises and falls. What percentage of fracking companies/production is in a similar situation?
From what I understand from your past responses – the cheap money underwriting many of the operationally failing companies is going away. I believe this should help the companies that are cash flow positive since there will be less competition for drill rigs, sand, leases etc – but is it possible that a major wave of failures would negatively impact even the competent companies? By driving the overall industry’s economic so far down a rathole that no one survives?
Most of the “shale” oil players have learned how to make money in a $50-60/bbl environment and most of the Marcellus players are doing OK with $2.00-2.50/mcf natural gas prices. It’s never been easy to make money in this business. from 2010-2014, the industry got used to $100/bbl prices. Spending and debt was based on high product prices, which also drove up the cost over everything. Many companies didn’t survive and a lot of equity was destroyed. However, the industry recovered, slashed spending, drove costs down and got used to lower prices.
The industry will survive… However the crash of 2014-2016 is still hurting us today. The market is valuing oil companies as if oil is $35/bbl.
This table from an investor presentation pretty well lays out the playing field…
Thank you, David.