November 1, 2019 Vol. 29, No. 7
Global climate trend since Dec. 1 1978: +0.13 C per decade
October Temperatures (preliminary)
Global composite temp.: +0.46 C (+0.83 °F) above seasonal average
Northern Hemisphere.: +0.64 C (+1.15 °F) above seasonal average
Southern Hemisphere.: +0.27 C (+0.49°F) above seasonal average
Tropics.: +0.30 C (+0.54°F) above seasonal average
September Temperatures (final)
Global composite temp.: +0.61 C (+1.10 °F) above seasonal average
Northern Hemisphere.: +0.64 C (+1.15 °F) above seasonal average
Southern Hemisphere.: +0.59 C (+1.06°F) above seasonal average
Tropics.: +0.60 C (+1.08°F) above seasonal average
Notes on data released November 1, 2019 (v6.0)
October’s globally-averaged, bulk-layer atmospheric temperature anomaly of +0.46°C (+0.83°F) represented the second warmest October reading of the past 41 Octobers in our satellite record, though it is statistically tied with two other years. The global temperature departure was a quarter degree cooler in October than September, however, the land area of the earth tied 2017 for the warmest October land in the record (+0.74°C, 1.33°F).

The conterminous U.S. as a whole experienced an average October (-0.03°C, -0.05 °F) with north central and northwestern portions well below average (see below). The warmth in Alaska lifted the 49 continental states’ average to +0.25°C (+0.45°F).
Globally, locations with sustained warmer-than-average temperatures for the month appeared over the NE Pacific Ocean northward through the Alaskan Arctic as well as along eastern North America. Nations in southeastern Europe eastward through Kazakhstan were well above average as was Japan, South Africa and Eastern Antarctica where the planet’s warmest departure from average occurred near Dome Fuji at +4.4 °C (+8.0 °F).

The planet’s coldest departure from average this month was -3.3 °C (-6.0 °F) near Rosebud Montana in the center of a stubborn area of cold air in central/western North America. Other areas of cooler than average temperatures occurred over Scandinavia and the South Atlantic Ocean.
Spoiler Alert first published March 2019: As noted over the past several months in this report, the drifting of satellites NOAA-18 and NOAA-19, whose temperature errors were somewhat compensating each other, will be addressed in this updated version of data released from March 2019 onward. As we normally do in these situations we have decided to terminate ingestion of NOAA-18 observations as of 1 Jan 2017 because the corrections for its significant drift were no longer applicable. We have also applied the drift corrections for NOAA-19 now that it has started to drift far enough from its previous rather stable orbit. These actions will eliminate extra warming from NOAA-18 and extra cooling from NOAA-19. The net effect is to introduce slight changes from 2009 forward (when NOAA-19 began) with the largest impact on annual, global anomalies in 2017 of 0.02 °C. The 2018 global anomaly changed by only 0.003°C, from +0.228°C to +0.225°C. These changes reduce the global trend by -0.0007 °C/decade (i.e. 7 ten-thousandths of a degree) and therefore does not affect the conclusions one might draw from the dataset. The v6.0 methodology is unchanged as we normally stop ingesting satellites as they age and apply the v6.0 diurnal corrections as they drift.
To-Do List: There has been a delay in our ability to utilize and merge the new generation of microwave sensors (ATMS) on the NPP and JPSS satellites. As of now, the calibration equations applied by the agency have changed at least twice, so that the data stream contains inhomogeneities which obviously impact the type of measurements we seek. We are hoping this is resolved soon with a dataset that is built with a single, consistent set of calibration equations. In addition, the current non-drifting satellite operated by the Europeans, MetOP-B, has not yet been adjusted or “neutralized” for its seasonal peculiarities related to its unique equatorial crossing time (0930). While these MetOP-B peculiarities do not affect the long-term global trend, they do introduce error within a particular year in specific locations over land.
As part of an ongoing joint project between UAH, NOAA and NASA, Christy and Dr. Roy Spencer, an ESSC principal scientist, use data gathered by advanced microwave sounding units on NOAA, NASA and European satellites to produce temperature readings for almost all regions of the Earth. This includes remote desert, ocean and rain forest areas where reliable climate data are not otherwise available. Research Associate Rob Junod assists in the preparation of these reports.
The satellite-based instruments measure the temperature of the atmosphere from the surface up to an altitude of about eight kilometers above sea level. Once the monthly temperature data are collected and processed, they are placed in a “public” computer file for immediate access by atmospheric scientists in the U.S. and abroad.
The complete version 6 lower troposphere dataset is available here:
http://www.nsstc.uah.edu/data/msu/v6.0/tlt/uahncdc_lt_6.0.txt
Archived color maps of local temperature anomalies are available on-line at:
Neither Christy nor Spencer receives any research support or funding from oil, coal or industrial companies or organizations, or from any private or special interest groups. All of their climate research funding comes from federal and state grants or contracts.
-30-
I dislike the reporting of trends, as if a linear model is a certainty, this is lesson 1 of Propaganda 101, deployed ad nauseum by Big Green. The change relative to the start date, plus the recent change (such as over the 21st century) would be better.
I have no problems with a trend as long as known noise was removed (primarily volcanoes and ENSO). I’d find it interesting to see the Christy/McNider 2017 algorithm applied to the 6.0 data and updated every month.
I dislike trends…when they are not made clear
Which 3 years are statistically tied?…are we really talking about no trend at all and just bouncing around a median?
“October’s globally-averaged, bulk-layer atmospheric temperature anomaly of +0.46°C (+0.83°F) represented the second warmest October reading of the past 41 Octobers in our satellite record, though it is statistically tied with two other years.”
“Which 3 years are statistically tied?”
2015, 2016 and 2019. All tied for second warmest October in the current UAH data. Specifically 2015 and 2016 where 0.44°C and 2019 was 0.46°C.
The warmest October was back in 2017 at 0.63°C.
“are we really talking about no trend at all and just bouncing around a median?”
No. The median October value is +0.07°C. Only 1 October in the last 10 years has been below this.
I agree. Pick your starting place and get any + or – figure you want. You can have positive and negative trends all at the same time!
You may dislike trends for whatever reason, but the trend is what it’s all about.
better, why.
anyway get the data and pick your own cherries
Good to see UAH are investigating the September data which included an unbelievable spike in NH land temps, possiblt erroneous.
Ron Clutz
They already addressed this and announced (via Roy Spencer’s blog) that the numbers were correct. You can see in the above report that the September figures are described as “final”. In fact, the SH value was raised very slightly in the final versus preliminary September figure.
TFN, I was referring the the alert at the bottom of the linked file.
“*****CAUTION****** SEPTEMBER 2019 DATA APPEAR TO BE ERRONEOUSLY WARM. WE ARE INVESTIGATING.
The complete version 6 lower troposphere dataset is available here:
http://www.nsstc.uah.edu/data/msu/v6.0/tlt/uahncdc_lt_6.0.txt
Thanks TFN, I take your view that the Oct. 4 note overrides the alert on the update file.
Thank goodness Greta got out of there in time (Sweden and then Alberta).
Greta is associated with a “reverse Gore effect”.
Every location gets much colder than usual just before Gore arrives for a speech.
Every location gets much colder than usual shortly after Greta departs.
Can we utilize these two people to create Tesla’s proposed weather machine?
Maybe if Al adopted Grrrrreta it would stave off the coming ice age?
(Or maybe that would bring it on. I guess the science isn’t settled.)
Her parents couldn’t afford the cut in income.
Unfortunately, it doesn’t seem as though the ‘quiet sun’ is having a dampening effect on global temperatures, unless the effect is delayed for some reason.
Perhaps the repeated postulations around an imminent cooling period, which we’ve heard for many years now, are a busted flush.
It would be a shame, in some ways – mainly because continued warming will give the green blob more ammunition to keep the CAGW scam going.
I pay less attention to the imminent coolists than I do to the global warmists. Neither of them know the future, but it is better to bet on the continuing short term trend, in the short term. Both will, of course, turn out to be seriously wrong at some point. What matters is the large error bars on their guestimates and the relative insignificance of the changes that reality gives to us.
Reversion to the mean beats the spread betters who think they know better. As the old maxim goes, “Look at what kind of car the bookie drives”.
Or as the title to an old (1920s) book about Wall Street asks: Where are all the Customer’s yachts?
Tom Nelson @tan123 – 1 hours ago
A staggering 1,204 U.S. sites Recorded their Coldest-Ever October Temperatures last month – Electroverse
https://twitter.com/tan123/status/1191429507980414977
If the forecasts for November, December, and especially January are correct, the anomaly for the coterminous US is about to drop precipitously. Don’t know how well it will play out globally. With 70% of the world’s surface being water, you’ve got to expect a lot of inertia in the system.
Man, the surface of planet earth is covered in 75% by water. It will take years for the “quiet sun” to be able to reduce the temperature of all the water in the seas, rivers and lakes in our planet. It is not an immediate effect.
One thing I don’t understand about a sun without sunspots: I thought darker sunspots represented areas of lower temperature. If the sun has areas of lower temperature on it, wouldn’t a spotless sun be radiating more energy, resulting in higher temps on earth?
Each sunspot is usually surrounded by a hot ring, so there is little, if any, net cooling due to a sunspot. However, sunspots spew charged particles which get trapped in Earth’s magnetic field. When our magnetic field is loaded up with charged particles, galactic rays reaching the atmosphere from space are reduced. Galactic rays generate ionized particles in the atmosphere, which seed clouds.
So, more sunspots = more charged particles in Earth’s magnetic field = less galactic rays penetrating atmosphere = less ionized particles in atmosphere = less cloudiness = more sunshine reaching ground = warming surface. That is the theory.
Flip side is less sunspots = less charged particles in our magnetic field = more galactic rays penetrating atmosphere = more cloud seeding = less sunshine reaching ground = cooling.
SR
“Flip side is less sunspots = less charged particles in our magnetic field = more galactic rays penetrating atmosphere = more cloud seeding = less sunshine reaching ground = cooling”.
More cloud means much warmer night temps. Where i live it does anyway which offsets most of the cooler cloudy day temps.
Everything else is good.
Arb…, Fewer sunspots means less magnetic shielding of the heliosphere therefore
more cosmic rays penetrate the heliosphere including earth’s atmosphere.. According to
Svensmark”s theory, cosmic rays cause cloud seeding. More clouds, cooler earth.
If the sun has areas of lower temperature on it, wouldn’t a spotless sun be radiating more energy…
No, the cycle decline to and during zero sunspots eventually leads to minimal ‘active network’, which results in low x-ray flux, F10.7cm flux, TSI, and except for coronal hole activity, low solar wind speed.
The bluer the sun is in this image, the lower TSI goes. The bright spots are new active regions that have grown recently, which, if it continues, will lead to sunspot and TSI growth and warming.
The sun’s maximum TSI cooling effect for this cycle in terms of SST has already happened from 2016 to now, as the year-to-year TSI changes at the solar minimum bottom are now very small, resulting in smaller temperature changes. There was a record temperature drop during the first two years of that time too.
SORCE TSI & annual change
2016 1361.0073 -0.4248
2017 1360.7516 -0.2581
2018 1360.6847 -0.0668
2019 1360.6583 -0.0264
A long period of very low sunspot activity, after the initial equatorial temperature drop causes less evaporation and fewer clouds, then warms from the additional sunlight, as at this point the tropical ocean is supersensitive to changes in TSI due to less clouds, warming more disproportionately from small TSI bumps from small sunspot emergence such as we’re seeing now, that can lead to an El Nino.
It is -27.8C at the north pole. https://earth.nullschool.net/#current/wind/surface/level/overlay=temp/orthographic=-90.00,90.00,926/loc=90.000,90.000
The early expanding and deepening NH cold air continues under extended low TSI. The week ending Oct 24 had the lowest F10.7cm observed flux since 1947, and if it were measured 100 years ago, maybe it was a record for that long too. The recent Oct solar low period is directly responsible for the sudden growth in ice in both Arctic and Antarctic oceans in October, the snow, and a lot of cold records.
If you look closely you’ll see cosmic rays dipped in late Oct from high solar wind speed and particles, while temps dropped. If higher cosmic ray caused clouds are supposed to be causing the temperature to drop how did the temperature drop so suddenly when cosmic rays fell, which would cause fewer clouds, which is supposed to warm, not cool, according to Svensmark. It doesn’t work. TSI does work.
Dreadnought,
How long will the trend of continued warming have to last before you might consider
that human caused global warming is not a scam?
60yrs of tamper free data from clean rural sites
Correct question: How long will the trend have to last before you might consider that the globe is warming? Whether the earth is warming and to what extent humans are contributing to any warming are two separate questions.
Where is your evidence that the current very mild and thoroughly enjoyable, warming trend is being caused by humans?
First I’d have to see evidence that the warming, such as it is, was caused by human activity.
Models do not count as evidence.
James,
What would count as evidence? There is only earth and no way to rerun the 20th Century
without human CO2 emission. So what evidence would persuade you?
Evidence that the small changes we see cannot be natural variation – but to show that we would have to show a much greater understanding if the climate than we have.
That’s a good question. In sciences where experimentation is nigh-on impossible, like astronomy and geology, validated predictions are the currency. “If gravity lenses exist, the mass of that star should deflect the light from the star behind it by xxx nanoparsecs.” The event is observed, and lo and behold the star is deflected by very near that amount. Evidence.
Whaddya do with a science like climatology, particularly the AGW hypothesis? The Earth has had similar warming periods like today’s. The models don’t match the observed temperature data, and even if it did, it wouldn’t be evidence that anthro CO2 was the culprit. Correlation is not etc., etc. So many wild claims have been made about “climate change”: drought, flood, heat, cold, etc. that no kind of weather can be evidence in any way.
Actually, there is one experiment we can perform: keep burning those fossil fuels and bring the rest of mankind out of poverty. The geologic record says high levels of CO2 won’t produce any runaway effects, so burn, baby, burn!
This is honestly a bizarre position to me. Is your argument really that a lack of evidence of CAGW, is actually evidence of CAGW? I mean, I’ve heard of unfalsifiable, but this position takes the cake.
Ryan,
The bizarre position is that of James denying the use of models. The only way
to prove human caused global warming is through the use of computer models.
Climate science like other historical sciences such a geology are different from
sciences like chemistry or physics where you can do repeated and controlled
experiments. But there is only one earth and we cannot rerun history with different
initial conditions or CO2 levels to see what would change. Thus what counts as
proof is different and must rely on models.
Izaak,
The problem with the models is that they are programmed to make CO2 the driver of the model. The sensitivity might be tweaked up or down to try to get the “best fit,” but the presumption — which has yet to have strong evidence for it anywhere — is that CO2 is the driver.
That is why the models aren’t evidence
James,
Climate models are open source. You are free to add whatever drivers of climate
change you like to them and compare them to observations. They are not evidence
any more than models of black holes colliding are evidence of gravitational waves
but they provide the necessary underpinnings so that physicists can claim that the
signals they get from LIGO for example are gravitational waves and that they result
from the merging of black holes.
How does anyone know this is is nothing more than a mere pause in cold?
I’ve looked over teh Nasa charts of warming trends over the last 100 years. Some areas are warmer and some are not. It does appear that heavily urbanized and deforested areas have experienced most of the warming. To me this indicates the warming has more to do with deforestation and urbanization than carbon. For instance, the area in which I live has stayed rural and forested and has experienced almost no temperature change.
Izaak come on over to western WI and I will show you some cold 😉
Unprecedented indeed
For me, I need to know why similar, sustained warming during the Medieval, Roman and Minoan Warm Periods occurred when CO2 was hovering around 280 ppm. Then I might be able to differentiate between those warm periods and the modern one.
Dave,
Previous periods of warming were very different from the current one. Currently we are warming 3 to 4 times faster than at any time in the past 10000 years. You can perhaps claim that that is due to better temperature resolution currently than our estimates of past rates but that argument gets less and less likely every year.
Izaak,
It is not. Go look at the Global Land-Ocean Temperature Index at Skeptical Science or any alarmist site you prefer. The graph has nice lines in the X and Y direction, so it’s easy to see the slope. From 1910 to 1940 there was a steep warming slope. Rise/run was 5.5/3.5, or a 1.8 slope. From 1970 to the present, the rise/run is 6.5 over 5.0, or a 1.3 slope. I leave the calculation of which slope is steeper as an exercise for the reader.
solar isnt corellated with warming or cooling
Steven, if you’re going to do drive-by postings, at least slow down enough to spell correctly.
The effect, if real, will be delayed for some reason, namely the temperature buffering of the oceans:
IF the relatively subtle, in magnitude, changes in Total Solar Irradiance or perhaps in cloud cover due to Svensmark effect due to cosmic ray changes related to solar wind are real and important to the climate, they would be found in slow changes in the trend lines. Small cumulative effects may heat or cool the climate in gradual effects, like the steady pressure of a small tugboat can steer a great ship. The “inertia” in the climate system is especially due to the oceans which can absorb enormous amounts of heat energy with only minor changes in temperature due to the high specific heat of water.
So, look for changes due to changing solar activity to play out over decades, not month to month.
Climate cycles are slow affairs, like AMO PDO and multi-solar cycle episodes. The monthly drip is useful though.
Thanks
“These changes reduce the global trend by -0.0007 °C/decade”..
AH HA…..a warming bias
(((/snark)))) LOL
First half of Oct here in the mid-Appalachians (US) was warm & pleasant. Second half began with a right-on-time killing frost, and the last week was below avg. Nothing unusual, but the fall color did have some very good gold/yellow tones — hickories, beech, sugar maples and tuliptrees.
we do NOT have the precision in gathering temperatures to back the claims of accuracy to within hundredths of a degree globally…….
That is exactly what I was going to respond about. These all need to state the uncertainty associated with each measurement. Temperatures that are only recorded to the nearest one tenth of a degree have an uncertainty of +/- 0.05 at a minimum. If the one hundredths digit is not recorded, you can’t simple add through averaging. That is unscientific and unethical. Going out to one ten-thousandths of a degree is even worse. These are measurements for God’s sake, not calculations of exact numbers generated on a calculator set to 3 decimal places. In fact, they should be using a calculator set to one digit.
Does anyone have the uncertainty budget figures associated with the temperatures quoted here?
Bill Taylor, Jim Gorman
I have greatest respect for Roy Spencer & team, but I can’t understand why they still don’t present their result with 2 sigma CI: their temperature data publication after all is an official document.
But you are wrong when you write that the temperatures communicated by such a team would have ‘unscientific and unethical’ precision.
Simply because their data is used by other teams building complex averages out of several data sets and vice-versa. If all teams provide for data with at most one digit after the decimal point, their product inevitably will produce precision errors.
If you want to obtain exact uncertainty information about the mostly used surface and tropospheric temperature series, you may consult
http://www.ysbl.york.ac.uk/~cowtan/applets/trend/trend.html
There you see, for UAH6.0 LT from 1979 till now:
0.130 ± 0.055 °C / decade (2σ)
Out of the same time series, but since 2000:
0.142 ± 0.151 °C / decade (2σ)
The latter estimate is statistically insignificant.
Unfortunately, it is not possible to enter external data in Kevin’s trend computer, e,g, UAH6.0 regional series for CONUS (“USA48”) to obtain similar info.
Bindidon:
Well yeah. If your data only has one decimal point of precision, you can’t just make up one or two more because not doing so “inevitably will produce precision errors.”
They’re not errors, they uncertainties, and it’s sloppy usage to conflate the two. Those means and uncertainties are useless fake numbers, because there is no way those thermometers recorded down to the thousandth of a degree, and no amount of statistical shenanigans can make it better than tenths, probably.
I think Steven Mosher gave me a similar reason for publishing results with fantastically impossible precision, saying something like they publish the numbers that let their users calculate the mean anomaly to the precision they want.
It was hooey then and this is hooey now. You can’t use a calculator to get ten decimal places of precision and call it “data.”
James Schrumpf
“They’re not errors, they uncertainties, and it’s sloppy usage to conflate the two. ”
Wrong: what I mean are ERRORS, not uncertainty. The latter is a completely different matter.
You are conflating precision and uncertainty.
Bindidon,
“Error” is the difference between the true value and the measurement. “Precision” is the degree of closeness between repeated measurements of a quantity under the same conditions. Since an average anomaly is the target value, there can’t be error in this sense, because there is no true value for an average anomaly. Precision doesn’t really exist for the anomaly in the same sense either, because there are never repeated measurements of the same quantity.
In the case of temperature measurements and the average anomaly, the uncertainty in the mean is not a measure of how precise the anomaly is, but a prediction that if the entire experiment was done over, there would be a 70% chance that the mean of the new collection would be within that value to the original mean.
Calculating this value to beyond the ability of the measuring device is the real introduction of error. it’s a false precision, and it’s an invalid result.
you dont get it.
a spatial average is a prediction.
If they’re predictions, why do you have banner headlines like this on the first page of your website:
“2018 – 4th Hottest Year on Record.”
Doesn’t sound like a prediction to me. Reads like a statement of fact.
Yet a spatially-averaged global temp from a GCM is not a “prediction” but a “projection.”
Correct me please. Isn’t “above seasonal average ” more accurately “above seasonal baseline”?
The coldest October Evuuuh, during which:
https://www.iceagenow.info/colorado-snowpack-more-than-double-the-average/
https://www.iceagenow.info/coldest-october-on-record-in-spokane/
https://www.iceagenow.info/missoula-coldest-october-on-record/
https://www.iceagenow.info/many-hard-freeze-warnings-in-southern-california/
https://www.iceagenow.info/record-snowfall-in-chicago/
https://www.iceagenow.info/all-time-record-cold-sweeps-alberta/
https://www.iceagenow.info/100year-cold-records-broken-in-australia/
https://www.iceagenow.info/idaho-early-cold-could-lead-to-seed-shortage/
https://www.iceagenow.info/record-cold-in-transbaikal-territory/
https://www.iceagenow.info/almost-entire-sweden-with-subzero-temperatures/
I’m beginning to doubt whether supposed measures of “global atmospheric temperature” have any relevance to climate whatsoever.
Phil Salmon
“I’m beginning to doubt whether supposed measures of “global atmospheric temperature” have any relevance to climate whatsoever.”
Yeah.
And I doubt already now about your ability to search for valuable info.
Are you paid by a firm for publishing such scary cooling stuff all the time, Phil Salmon?
Phil’s scary stuff is a observation or 3 that’s not a prediction of CAGW that’s has never been observered, heres just one of my own Scotland this week is 10c below average temps and 5c down on last year,another point of Phil’s scary stuff (which hes too modest to mention)The record cold hes showing in some cases are smashing record cold temps set last year,particularly in USA. The warming areas we see observed ie Alaska have a repeat pattern in historic GSMs periods.the monlthy anomily that boosted last months Uahv6 temp +0.61over Antarctica is still not explained I’ve seen mutterings of false readings and no explanation of why the anomily happened, the other pointer of a GSM effect is relentless Percipitatation, I find very little reassurance anywhere we are warming.
Hi Griff
Bindidon writes
Its a valid question. Consider hypotheticalworld where there are just two regions, one noticeably warming and one noticeably cooling but the average remains the same. So the “global average” remains constant but tell that to the people in each region.
The ice extent in Central Arctic has been growing the fastest in five years.
http://masie_web.apps.nsidc.org/pub/DATASETS/NOAA/G02186/plots/4km/r11_Central_Arctic_ts_4km.png?fbclid=IwAR3kSVsBZpl3GqrI3vJCqEXNUFeH6SZxKiiMLTNqqAgEVjGoBAV7xgCjZ04
http://masie_web.apps.nsidc.org/pub/DATASETS/NOAA/G02186/plots/4km/r03_East_Siberian_Sea_ts_4km.png
https://nsidc.org/data/masie
You can expect “lake effect” on November 6.
http://squall.sfsu.edu/scripts/namjetstream_model_fcst.html
Knowing how bad the weather organizations around the world are handling the weather stations (eliminating the ones in rural areas and keeping the ones near cities)…. a 0.30 C increase sounds like a bad joke. Another thing, every statistic should be accompanied by the “margin of error observation”. Where is and what is the margin of error considered for this weather measurements?… WHERE IS IT?….
Bad jokes everywhere, no scientific seriousness AT ALL….
What fraction of a degree are we talking about here ??
JPP
I just ran trends for the last five years for the summer months June-July-August for individual northern hemisphere stations in the NOAA GHCN Monthly report. Over half of them show flat or negative trends, and the positive trend stations are well-mixed within.
In other words, the red dots and the blue dots are equally scattered across the hemisphere. So what good is taking an average anomaly when there’s obviously no global trend anywhere?
I’ll run the same program tonight for the southern hemisphere over the months December-January-February to get the southern summer trends.
James Schrumpf
A 5 year period is pretty short time over which to declare “no global trend anywhere”. Especially when it’s start end is heavily weighted by the huge 2015/16 El Nino.
Did you look at the .gif image? My point is that there’s no global trend where 52% of the stations show a flat or negative trend and 48% have a positive trend. They were all subjected to the same el Nino, yet there’s no indication of it in the individual station records. I started in Jan of 2015, so that should have covered both ends of the el Nino, but the stations don’t show it.
My other point is that 5 years is the temperatures we’re getting. A 30-year trend is a mathematical construct. The temperatures we’ve had for the past 5 years is what we’ve had the last 5 years, and it’s hard to say the Earth is warming when for the last 5 years a majority of the stations have been cooling.
Not sure how using a data series to find a 30-year trend is “a mathematical construct”, whereas using the same data series to find a 5-year trend isn’t? The same mathematics is used in both cases, isn’t it?
In any case, if it’s valid to use a 5-year period to declare a trend, then, in the case of UAH for instance and counting backwards from the latest 5 years in blocks of 60 months, you get a bewildering mix of ‘cooling-warming-warming-no trend-cooling-warming-cooling-warming-warming.’ It doesn’t tell us much about the long term picture, which is statistically significant warming at a rate of +0.13 deg C per decade. A similar picture would also be true in the surface data sets.
Yes, the 5-years (60 months) from Nov 2014 to Oct 2019 had a ‘cooling’ trend, but in UAH at least it was also the warmest continuous 5-year period in the record, especially so if you count individual 5-year blocks but also if you use a running 60-month average. So it’s a bit of a push to say that the last 5-years indicates the start of a long term cooling trend or even a slowdown in the long term rate of warming.
Temperatures from 25 years ago aren’t what we’re experiencing now. I used the last five years to see what the weather is doing now, are summers getting warmer or cooler recently? I’m not trying to say we’re entering a cooling phase overall, but that the individual stations are not exhibiting any kind of shared behavior.
Just for grins, I ran the trends for the last 30, 25, 20, 25, 20, 15, and 10 years for the summer months JJA in the northern hemisphere. Here’s the results:
# last 30 years
No. of stations with negative or no trend : 3811
No. of stations with positive trend : 14557
#last 25 years
No. of stations with negative or no trend : 4709
No. of stations with positive trend : 12669
#last 20 years
No. of stations with negative or no trend : 5331
No. of stations with positive trend : 11532
# last 15 years
No. of stations with negative or no trend : 6528
No. of stations with positive trend : 8868
#last 10 years
No. of stations with negative or no trend : 7199
No. of stations with positive trend : 6802
Starting 10 years ago, more stations were cooling or flat than warming. Must mean something.
When exactly did climate science enter Planck scale accuracy?
And don’t say time is relativistic.
Satellites are only accurate to within 1 C
Interpret the above analysis accordingly.
Link didn’t post. My fault i think.
http://www.drroyspencer.com/2010/01/how-the-uah-global-temperatures-are-produced/
From the linked article (my emphasis)
Which is the same BS as the Spencer’s answer to Pat Frank lately.
Indeed the number of angels that can stand on the end of this pin….
Such accuracy, such precision ,so sciency..
“Science is wonderful so much speculation from so few facts” Twain I think.
So the satellite systems have failed?
The replacements are proving to be unfit for purpose?
And what baseline is being used?
0.13/decade?So 0.65C of assumed warming on data with an error bar of =/-1C?
Colour me stunned.
When did noise become data?
Is it truly the instrumentation that is failing? Or is the metric,a calculated global average temperature, that is beyond fantasy?
Yes the base line probably the most important point made so far.
“And what baseline is being used?”
1981 – 2010.
An interesting tidbit about the data that makes up that baseline — as far as I’ve seen, there are three baseline periods: 20th century (1901-2000), 1951-1980, and 1981-2010. I don’t know where the cutoff is for how many of the monthly averages can be missing from those time series, so I used 90%. That means out of the 1200 monthly averages, I only counted stations that had valid monthly averages for at least 1080 months. For the 30-year baselines, the 90% number was 324. Here’s how the numbers broke out, and how many of them were in the US. I used the NOAA GHCN Monthly summary unadjusted data set, which has data from 27, 352 stations as of the October data sets.
20th Century baseline: 1740 stations, 1082 in the US
1951-1980 baseline: 7009 stations, 3407 in the US
1981-2010 baseline: 6955 stations, 2868 in the US
If nothing else, this shows the sheer amount of infilling and fudging of data that must occur to come up with these global mean anomalies. At best, only 25% of the stations have 90% or more of the monthly averages needed for the baselines.
Here’s an animated .gif image alternating between the northern hemisphere stations with flat or negative trends (blue dots) and those with positive trends (red dots).
They report all sorts of numbers but do not report the properly propagated uncertainty. The claimed two sigma numbers above are simply unbelievable. One can’t average many thousands of input values and get an uncertainty of 0.15 C at two Sigma. And why are they giving a “sigma” value? That is only available from a statistical calculation of a set of measurements of the same thing. This problem is a straight propagation of absolute errors added in quadrature.
Generate some numbers and try it. If the absolute uncertainty is 0.004 C and there are 10,000 readings involved, the propagated absolute error is 0.4 C. And how many readings go into the calculation of a monthly average for the globe?
“Generate some numbers and try it. If the absolute uncertainty is 0.004 C and there are 10,000 readings involved, the propagated absolute error is 0.4 C.”
No, that is the propagated error of the sum of 10000 readings. To get the mean, you divide by 10000. The propagated error in the mean is 0.00004°C.
Yeah, but that’s just the measurement uncertainty. The uncertainty in the mean is the real problem.
Let’s take 10,000 random monthly averages from the NOAA GHCN Monthly summaries. The standard deviation is 7.3 and the uncertainty in the mean is .007. You’ve traded the measurement uncertainty for the uncertainty in the mean, which is twice the original measurement uncertainty.
For some reason, it’s thought that using the anomaly “gets rid” of that uncertainty in the mean, but it doesn’t. Consider all the measurements used to get that anomaly.
First, the baseline must be calculated. Each monthly average has between 28-31 daily measurements — times two — to get that average. A station pulled at random from the ghcn daily data set has an uncertainty in the mean of ±0.8C for the month of Aug 2010. Taking the 30 Augusts in the baseline 1981-2010, the uncertainty in that mean is ±0.3C .
Where are we so far? Each individual month of the baseline month of August has a ±0.8C uncertainty, so they would properly be expressed as 23.8±0.8C. Average those 30 averages and you end up with 24.5±0.3C , plus the 0.15C that’s the averaged uncertainty for the 30 Augusts individually, for a final of 24.5±0.5C for the baseline month of August.
To recap: each daily average has an uncertainty in the mean. The thirty-one daily averages used for August have their own uncertainty in the mean, just from the standard deviation in the daily averages. To this the averaged uncertainties from each day have to be added. Then there’s the 30 Augusts averaged for the baseline.
Daily uncertainty + monthly uncertainty + baseline uncertainty all have to be accounted for, and they don’t appear to be. At best, I’d say the uncertainty from the 30-month baseline average is used, and then probably divided by all 390 days in the 30 years of Augusts. Lots more that need to be accounted for, though.
James,
“For some reason, it’s thought that using the anomaly “gets rid” of that uncertainty in the mean, but it doesn’t.”
It gets rid of most of it. The sd of 7.3 represents the effect of a population of warm and cool places. Take out the climatology, and the sd drops dramatically.
“Lots more that need to be accounted for, though.”
A lot of guesswork here. You can actually do the whole arithmetic, as I did here. The averaging process really does damp out noise.
Nick,
That sd is there, you’re just ignoring it. I showed the math, and you ignored it.
To get to the anomaly requires three sets of averaging, and each set introduces more uncertainty. First, the daily Tmax and Tmin averaging produces uncertainty. The averaging of 31 days to get an August average generates uncertainty, and still has the daily uncertainty attached. The averaging of 30 Augusts for the baseline generates more, and the others are still there.
The anomaly is just a cheat to get rid of the variety in the signal by using a unique value at each station to lower the amplitude. You think that’s getting rid of the uncertainty, but it’s not. You’re just not accounting for it correctly.
James,
“That sd is there, you’re just ignoring it. I showed the math, and you ignored it.”
Where is the math? I se no calculation of the sd of the anomaly. What is it?
I calculated the sd of the first 10000 stations in GHCN V4, Sep 2019. It was 7.78°C. The sd of the anomalies was 1.44 °C.
Nick,
There’s the math. But you’re right that I didn’t carry on to the sd and se of the anomalies. So, to carry on forward, an individual station’s calculation for Aug 2015 should be in that ±0.8 uncertainty in the mean, and when the two are subtracted, the uncertainties are calculated in quadrature. Aug 2015 might be 26.3 ±0.8C, so the anomaly would be 26.3-24.5 ±sqrt(0.5^2 + 0.8^2) = 1.8 ±0.9C. If there are 7000 anomalies for the global average, then after the sd and se for the anomalies are calculated, the hanging-on error has to be calculated . So sqrt(7000*0.9^2 ) / sqrt(7000) = 0.9C. If the se for the anomalies was (using my estimated figure of 0.014), then the final would be sqrt(0.014^2 + 0.9^2)) = 0.9C.
Obviously these numbers will change with each month’s iteration, but it has to be admitted that all of the uncertainty in the global mean anomaly is not being accounted for. If just the anomaly averaging uncertainty is calculated, all of that uncertainty from each month, and each baseline month, has been ignored.
James,
“So sqrt(7000*0.9^2 ) / sqrt(7000) = 0.9C.”
No, this is a variant of Crispin’s error. The se of the sum is sqrt(7000*0.9^2 ), adding in quadrature. To get the mean you divide by 7000, not sqrt(7000). That gives 0.0108°C.
Nick,
There’s two different things being calculated here: the measurement error and the uncertainty in the mean.
If a thermometer is graduated in degrees C, then the measurement error is ±0.5C. When propagating that across an average, it is divided by N.
For getting the daily arithmetic mean, it would be sqrt(0.5^2 + 0.5^2) / 2 = sqrt(0.5)/2 = ±0.4. Each of the 31 days in August would have that error, so for the month it would be sqrt(31*0.4^2)/31 =± 0.07. Each August in the baseline would have that, so it would propagate as sqrt(30* 0.07^2)/30 = ±0.013. The anomaly would be a monthly average with the 0.07 error, subtracting the baseline August with the 0.013 error. Since it’s added, the quadrature is used, and the anomaly error is sqrt(0.07^2 + 0.013^2) = ±0.07C. Without crunching all the numbers for this month, that +0.46 anomaly looks a bit different as 0.46±0.07C
The other quantity to be considered is the uncertainty in the mean. As was calculated in the above post, the uncertainty in the mean for Aug 2010 was ±0.8C. For the 30 Augusts in the baseline, the uncertainty was ±0.3C. Well, that’s the uncertainty for the mean of the 30 Augusts, but each August also had its uncertainty of ±0.3C. So we put that into quadrature and get sqrt(30*0.3^2)/30 = ±0.05C, which is added to the 0.3 uncertainty in the mean of the 30 Augusts, and = ±0.035C.
Earlier you calculated the sd of 10,000 anomalies to be 1.44C, so using that number, the uncertainty in the mean of those anomalies would be 1.44/100 = ±0.014C.
The measurement error practically does disappear with the averaging. sqrt(10000*0.07^2)/10000 = ±0.0007C, which is insignificant. The uncertainty in the mean is significant, though small, and would keep the more insane precision values of 0.007 from being expressed, if it wasn’t ignored.
Real data? Less than 10,000; it’s around 7000 if using the NOAA GHCN Monthly summaries and the 1981-2010 baseline. Only 6955 stations have at least 90% of the 360 monthly averages needed for the 30-year baseline. Everything else is infilled, extrapolated, interpolated, fudged, and made up.
And that’s good for 3-decimal-point precision and zero uncertainty.
Anthony
“The conterminous U.S. as a whole experienced an average October” ?
Contiguous United States ?
The rarer conterminous means the same as contiguous in this context. Coterminous, more widely known than conterminous, is also usable.
I’d like to see error analysis by Dr. Christy (Dr. Spencer is hopeless is that respect) explaining how they’ve arrived at 2-3-4 places after the point. Not for a second do I believe that such precision is possible.
No. 7 Global climate trend since Dec. 1 1978
These aren’t real numbers, they’re statistical hallucinations.
Even Wiki, which might be expected be strong on the 97% consensus reveals that satellite temperature reading may well be on the kludgy side due to varying formats and protocols.
Is Satellite temp data reliable enough to give dependable results to a tenth of a degree ?
Also, given that we’d be looking at maybe 30 or so years of observation, how relevant are the results when the pre satellite age data will have covered the merest smidgen of global surface ?
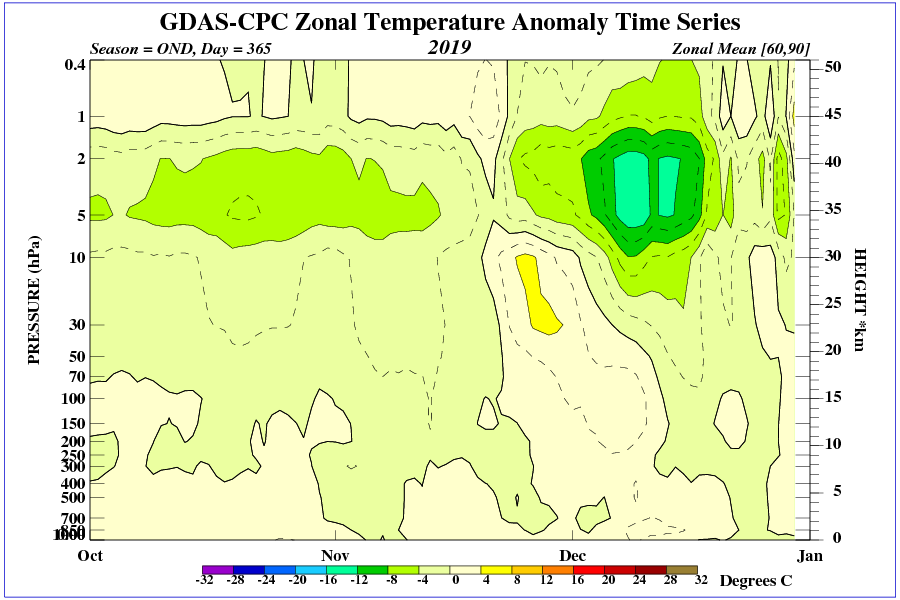
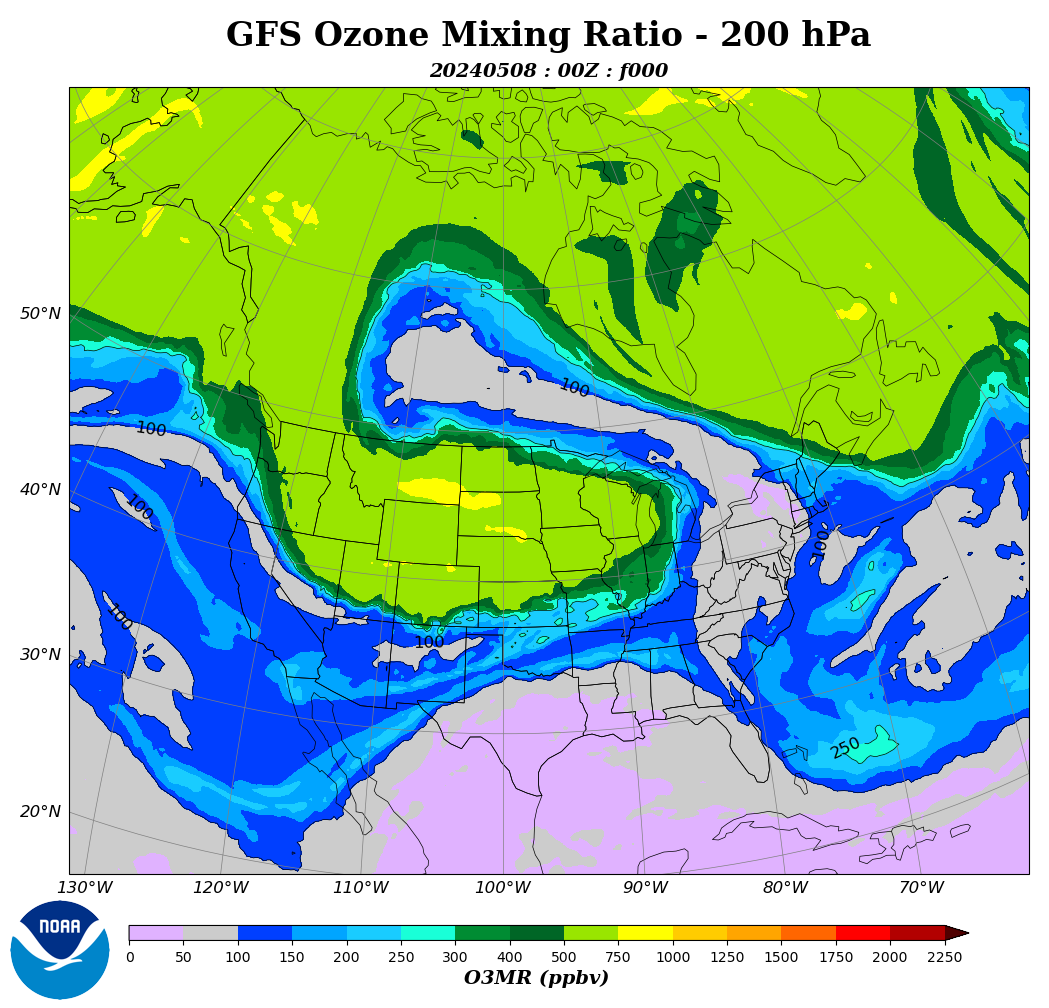
Satellite measurements will not be accurate because they include ozone radiation during stratospheric intrusions.
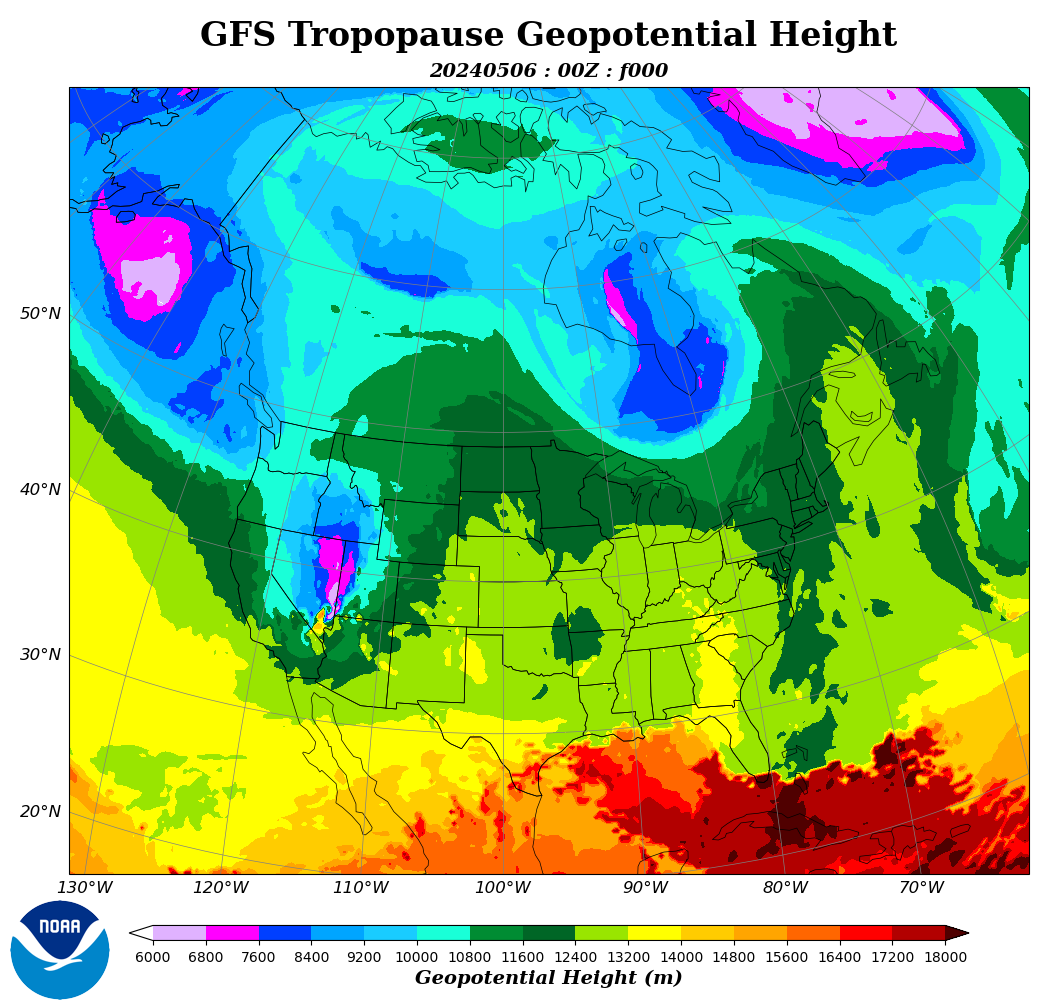
https://www.cpc.ncep.noaa.gov/products/stratosphere/strat_int/
Add to that 2nd coldest October in Christchurch nz.
Satellite measurements can be accurate as seen on the page below.
https://www.cpc.ncep.noaa.gov/products/stratosphere/strat-trop/
“The planet’s coldest departure from average this month was -3.3 °C (-6.0 °F) near Rosebud Montana in the center of a stubborn area of cold air in central/western North America. ”
????
Wyoming locations – October – departure from normal (NOAA)
-7.9F Big Piney
-9.1F Buffalo
-8.4F Casper
-7.8F Greybull
-11.6F Lake Yellowstone
-8.4F Lander
-9.0F Riverton Airport
-8.3F Riverton Town
-8.2F Rock Springs
-8.9F Worland
All of which are significantly lower than the figures for Rosebud, MT
https://www.weather.gov/riw/CLM_October_2019
All locations in the Billings area reported departures from normal greater then Rosebud.
https://www.weather.gov/byz/Oct2019WxSummary
All locations in the Great Falls area reported departures from normal greater then Rosebud.
https://www.weather.gov/media/tfx/wxsummary/montanawx_2019_10.pdf
What gives?
John, the sat temps are avg atmospheric temps in the air column, not surface temps. There can sometimes be a significant difference in the anomalies — especially when there is alot of radiational cooling and cold-air pooling at the surface (the surface can be colder than air above).
The temperature of ozone that falls from the tropopause is very low because the temperature in the tropopause above the 60th parallel is below :-50 degrees C.
Another stratospheric intrusion this year, visible in the Midwest.

There should be more of these in the SH, after that huge SSW.
To the south is stronger geomagnetic field.
https://dlmultimedia.esa.int/download/public/videos/2016/05/031/1605_031_AR_EN.mp4
Based on results from ESA’s Swarm mission, the animation shows how the strength of Earth’s magnetic field has changed between 1999 and mid-2016. Blue depicts where the field is weak and red shows regions where the field is strong. The field has weakened by about 3.5% at high latitudes over North America, while it has grown about 2% stronger over Asia. The region where the field is at its weakest field – the South Atlantic Anomaly – has moved steadily westward and further weakened by about 2%. In addition, the magnetic north pole is wandering east.
https://www.bbc.co.uk/news/science-environment-50302392#comment_137090849
Many times that number of real scientists say there is no such emergency.
As one would expect in a hottest October ever, among US midwest farmers there’s a run on propane.
https://www.reuters.com/article/us-usa-propane-demand/scramble-for-propane-marks-mother-natures-latest-challenge-for-u-s-farmers-idUSKBN1XF1FA
Everyone is harvesting soggy corn after both spring and fall were cold and wet. Now everyone’s chasing propane to dry the harvested produce (and stay warm themselves) and propane is getting scarce and expensive.
Heres the latest climate report (doom and gloom)https://academic.oup.com/bioscience/advance-article/doi/10.1093/biosci/biz088/5610806
Heres the BBC’s take on it (alarmism) https://www.bbc.co.uk/news/science-environment-50302392
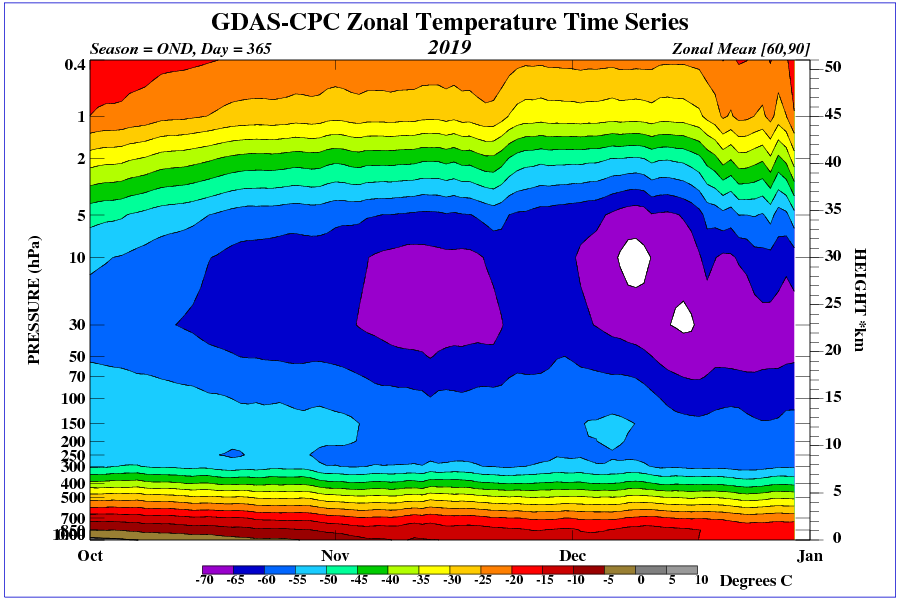
It is very interesting how the equator is very close to average as the solar plane of maximum heating passes the equator moving South. You can almost visualize the Hadley cells rising from that warmth and circulating North and South in tubes of rising and descending air currents. Distributing the warmth in circular tubes of air that allow the excess warmth of the tropics to prolong the growing seasons in the temperate zones. What a wonderful climate we have, and I feel blessed and thankful, to live in a time when the climate has contributed to the health and beneficial living conditions for the inhabitants of this Earth.
Thank you Dr. Spencer and Dr. Christy. Your hard work does not go unnoticed, or unappreciated.
You don’t have to imagine it. Look at the graphics.
http://ds.data.jma.go.jp/tcc/tcc/products/clisys/STRAT/gif/zt_nh.gif
http://ds.data.jma.go.jp/tcc/tcc/products/clisys/STRAT/gif/zu_nh.gif
http://ds.data.jma.go.jp/tcc/tcc/products/clisys/STRAT/
Is “seasonal average” 1981 to 2010?
This global map looks strange when you consider most of Siberia and northern Russia are covered in snow.
An average October in Siberia is cold. A slightly warmer than average October in Siberia is still cold.
99.9% of the human population would not notice the difference. Frozen parts of your body, do not care that it took slightly more time to freeze than average.
That is where the warmth goes to die:
https://en.wikipedia.org/wiki/Siberia
A little slice of the real Siberian climate. Not the cities where people can prosper.
The cities where survival is challenged for half the year:
https://en.wikipedia.org/wiki/Verkhoyansk
Consensus is a political term (word) and cannot be used in science as science is very rigid and requires the verification of a hypothesis by colleagues and fellow scientists. If one scientist cannot achieve the same results from the same experiment then the hypothesis is INCORRECT. Using the word consensus to describe agreement among scientists is the equivalent to saying some scientists do not agree therefor the hypothesis (climate emergency) is INCORRECT. Please print this so EVERYONE can see it regularly on this website. Michael Mann is a fraud as he wishes not disclose the data by which he produces his computer model (hockey stick graph). He has been exposed unofficially as a fraud by the BC supreme court where he would not produce data to prove his work. He was forced to pay Dr. Tim Ball all court costs. In Canada he could not hide behind proprietary law which his protects his work is in USA. He has no data and there is no data anywhere on earth to support his hockey stick computer model climate emergency. He has fraudulently rewritten the historical temperature graph.