Guest post by David Archibald
Back on March 7, 2006, the National Science Foundation issued a press release predicting that the amplitude of Solar Cycle 24 would be “30 to 50 percent stronger” than Solar Cycle 23. Solar Cycle 23 had a smoothed maximum amplitude of 180.3. The press release described the forecast as “unprecedented”. Perhaps it was as in unprecedentedly wrong. Solar Cycle 24 had a smoothed maximum amplitude of 116.4 in April 2014, which made it 35% weaker than Solar Cycle 23.
NASA has recycled some of the language from that 2006 press release in this release on NASA researcher Irina Kitiashvili’s forecast of Solar Cycle 25 amplitude which includes this line:
The maximum of this next cycle – measured in terms of sunspot number, a standard measure of solar activity level – could be 30 to 50% lower than the most recent one.
This time it is 30 to 50% lower rather than higher which would put maximum smoothed amplitude in the range of 80 to 60. The graphics in Kitiashvili’s presentation differ from that. This graphic from slide nine has a peak amplitude of 50 with a range of 65 down to 40:

Figure 1: Solar Cycle 25 forecast in the context of 320 years of solar cycle data
But the graphic on the previous slide has a peak amplitude of 25:

Figure 2: Solar Cycle 25 amplitude forecast from slide 8
Let’s assume that the latter forecast of 25 is the author’s intent and apply it to the figure on slide 3 of 420 years of sunspot data:

Figure 3: Forecast from Figure 2 imposed on the 420 years of solar cycle data on slide 3.
In this figure the forecast from Figure 2 is scaled to fit on the graphic on slide 3 from Kitiashvili’s presentation. It shows that Solar Cycle 25 will be the smallest for some 300 years. The activity pattern predicted by Kitiashvili looks like the setup for the Maunder Minimum. A Maunder-like event was predicted by Schatten and Tobiska in their paper to the 34th meeting of the Solar Physics Division of the American Astronomical Society, June 2003:
“The surprising result of these long range predictions is a rapid decline in solar activity, starting with cycle #24. If this trend continues, we may see the Sun heading towards a “Maunder” type of solar activity minimum – an extensive period of reduced levels of solar activity.”
NASA’s press release is headed “Solar Activity Forecast for Next Decade Favorable for Exploration”. So spacecraft electronics and spacemen will have a lower chance of being fried by solar storms, the Earth’s thermosphere will shrink, satellites will have lower drag and stay in orbit longer. But what about life on Earth? In her 2011 paper Haigh showed an unequivocal relationship between solar activity and climate as recorded in North Atlantic ocean sediments:

Figure 4: Records extracted from ocean sediments in the North Atlantic
In Figure 4 solar activity is measured by Be10 (purple) and climate variation is shown by deposits of ice-rafted minerals (orange). Lower solar activity means that it will become colder and colder is drier. Prepare accordingly.
David Archibald is the author of American Gripen: The Solution to the F-35 Nightmare.
David Archibald, you appear to have got the flux-capacitor correctly aligned and running synchronous to the time …
First paragraph …
“Solar Cycle 23 had a smoothed maximum amplitude of 116.4. The press release described the forecast as “unprecedented”. Perhaps it was as in unprecedentedly wrong. Solar Cycle 24 had a smoothed maximum amplitude of 116.4 in April 2104, which made it 35% weaker than Solar Cycle 23.”
2014 I think. Did you really mean 116.4 for both SC23 and SC24, if so how is it weaker?
I have corrected the post
April 2104, ….. ????
85 years from now.
(Corrected) SUNMOD
“Solar Cycle 23 had a smoothed maximum amplitude of 116.4. The press release described the forecast as “unprecedented”. Perhaps it was as in unprecedentedly wrong. Solar Cycle 24 had a smoothed maximum amplitude of 116.4 in April 2104, which made it 35% weaker than Solar Cycle 23.”
Solar cycle 23 was closer to 180 according to the graphic, which would make cycle 24 around 35% weaker. Typo, I guess.
Nice, but humans decreased earth albedo. Asphalt roads, skyscrapers reflecting on road instead of space, … There won’t be cooling.
Well, that settles it.
Have you ever looked out of an airplane window from altitude?
Or had a gander at a satellite photo?
What percentage of the surface of the planet is roads and skyscrapers?
Why did Earth cool for 30 years from the 1940s to the 1970s, when building such things was proceeding ever faster?
did you ever look at a globe? 71% of earth’s surface is covered by water. Thus, intuitively it would seem that heat transfer to the water is more important than heat retention in the air above it. The water is heated through solar irradiance more so than by heat transfer from the air, which can only occur at the surface interface.
No I never looked at a globe.
Water you say?
No kidding?
Those years I spent studying geology and physical geography, I almost glanced at one once, but I figured I’d gotten by fine so far, what the hell.
I am not even gonna bother asking what your comment has to do with mine.
You are pretty dangerous with those insightful and damming gotcha questions.
Don’t even need to be in an airplane, here. A few years back I had a seventeenth-floor office on the outskirts of Atlanta, GA, with a window directly facing the city.
Except for the skyscrapers, all you could see were treetops. Atlanta, as well as many other non-coastal cities, was built in a (pine) forest. Turns out we’re pretty good at replanting flora on lots once a building is constructed. As far as the more undeveloped, fly-over areas, the US has more forested area than it did in 1900.
Besides, Petr, asphalt roads absorb heat, but concrete roads reflect. Dark-shingled rooves absorb, concrete and glass buildings reflect. I don’t think the total change in albedo, whatever it is, would exceed the margin of error in the calculations.
There isn’t USA only. Look at another countries. USA has low population density. China, India, Europe, Africa changed land a lot.
USA as a whole sure (except for Africa. the US population density of 87.4 is greater, though not by much, than that of Africa’s 87.15 people per square mile)
But population isn’t spread all that evenly across the US, there are some huge states with small populations and some small states with large populations (I dare say the same holds true of Africa, which has vast areas of sparse population in addition to areas of dense population).
For example, India has a population density of 1,052 people per square mile which is less than New Jersey which has a population density of 1,218 people per square mile despite the fact that nearly a quarter of New Jersey land is protected from most development (IE the pine barrens). In other words the population density of the areas of NJ outside the pine barrens is much denser than New Jersey as a whole. Guttenberg, NJ for example has a whopping 58,679 people per square mile compared to Hong Kong’s mere 17,348 or Singapore’s 20,192.
“Nicholas McGinley October 29, 2019 at 8:03 am
Why did Earth cool for 30 years from the 1940s to the 1970s,…”
My guess, a significant contributor would have been the various wars during those decades ejecting massive volumes of aerosols, particulates, soot etc in to the atmosphere affecting albedo as well many other factors.
Besides for WWII, which wars put “massive amounts” (massive on the scale of the whole planet and atmosphere) of those substances into the air? We did have one or two events over the years in which large natural or man caused disasters output what seemed at the time to be a massive amount of such, such as the Iraq oil fires, or the massive fires that scorched a large part of Yellowstone Park and other parts of the western US…and AFAIK the effect was minimal.
The years during WWII when so many bombs were dropped and fires burned, also do not lend much support to this idea, unless one supposes the effect is delayed for a long time.
But what happens after volcanos erupt pretty much settles this question: When the Sun is blocked by aerosols and particulates in the atmosphere, the effect is immediate and cumulative. And short lived. Although I do not discount the possibility that at a certain magnitude of eruption/stratospheric injection, the effect is magnified and one or more feedbacks cause prolonged cooling.
To my recollection, no huge wars were raging in the mid and late 1970s, when the cooling accelerated and reached a peak.
There have been some mighty huge volcanic eruptions, and unless they inject material, particularly SO2, into the stratosphere and do so in in large amount, the effect is minimal to the point of being invisible on time series graphs.
This is a subject which I have studied and looked into at various times over the years, and much has been written on these substances and their effects, but on close scrutiny the two things do not match up very well.
I would not by any means say that aerosols and particulates have no effect…clearly they do…but that factor hardly explains decades of global cooling w/ Arctic amplification of such.
I tend to focus on factors that have always existed, since it is quite evident, at least to me, that large variations in weather and multiyear temperature trends have always occurred, and that this is the case on virtually every time scale one may choose.
Interestingly, various atmospheric and oceanic cycles do correlate well with unadjusted time series graphs in the historical period.
One (or several) of the “many other factors”?
Excellent post Nicholas.
Indeed. during the time period specified (1940s to 1970s) there was only the one world wide war (WWII at the very beginning) the effects of which would have faded long before the end. There were some scattered local conflicts (Korea, Vietnam) on a much smaller scale than WWII. In fact, the only other war that would possibly have had close to as large scale “ejecting massive volumes of aerosols, particulates, soot etc in to the atmosphere” would have been WWI, which happened in the 1910s – ending around the time a period of warming was starting. Since you have one major war at the beginning of a warm period and one a the beginning of a cold period, it looks like there is not the correlation that Patrick MJD supposed there is.
UHI is a well known effect but it only affects the temperature stations located within it. Those are poorly sited and not used by the CRN which has the best land based measurements.
About 70% of Earth’s surface is ocean. The poles are mostly ice with some seasonal water at the north. Clouds are the big factor, not roads.
Air movements can waft the UHI around.
So will they move farts, but the effect is greatly diminished.
Exactly the more it’s “wafted” the more it disperses such that it’s no longer detectable after a relatively short distance (whether you are talking about farts or UHI).
I think bad python code does too.
Also UHI is most evident when winds are light or absent.
In strong wind conditions, the differences between downtown area and outlying areas is far smaller.
Anyone who has ever lived through and big city heat wave knows it, even if they never thought much about it: These heat waves happen when large domes of high pressure become established overhead, and wind conditions are light to calm for days on end.
Earth albedo is getting bigger as it gets greener. Plants reflect green light.
“It might seem inefficient that plants don’t take advantage of the one part of the spectrum that the sun emits most of its energy in. This is actually a form of protection. Chlorophyll-a and other pigments are easily destroyed by too much energy, and when the pigments break down and stop absorbing light entering the plant, that energy can cause damage to other plant tissues as well, including the plants’ DNA. Think of it as a sort of plant sunburn. Plants have elaborate mechanisms to repair DNA that has been damaged by too much sun energy, but these repair mechanisms are costly, and require extra nutrients. A plant that is stressed by too little nutrients or too little water can actually die from excess sun exposure.
Plants have adapted to balance their need for the suns energy with their need to protect themselves from sun damage by using regions of the spectrum that are not as abundant. In general, light absorbed in the blue region is used for plant growth and light absorbed in the red and far red regions are used as cues for flowering or orienting (that is, bending leaves and stems toward or away from light, growing tall to escape shading in a forest, etc).”
http://scienceline.ucsb.edu/getkey.php?key=500
And that is why green (in the middle of the spectrum) is reflected and we see plants as green.
Petr, while those things certainly have a local effect (stand next to an asphalt road on a bright sunny winter day and you might feel a wee bit warmer), but it’s just that: local (now walk several feet away from that asphalt road and that bit of extra warmth is no longer felt). Just take a look at a satellite photo of say the North Eastern section of the United States (say from Delaware in the south to Maine in the north, Ohio to the west and the Atlantic Ocean to the east), try counting the pixels that the roads and skyscrapers take up (assuming you can even accurately make *any* of them out at that scale, which I highly doubt you could) vs the pixels that don’t have roads and skyscrapers on it (the vast majority of the photo).
99.99+% of the earth’s surface is oceans or vacant land. The only thing that asphalt roads affect is the tiny portion where half the earth’s population is now crammed into (cities)
Anyone who flies an airplane regularly and studies the landscape (when not obscured by white, reflective clouds) comes to the realization that the surface of the planet is largely devoid of the things you mention. Ocean, forest, desert, Ice . . . . not much else when you re-calibrate your perspective.
I can see that temperature in downtown is much higher than in countryside. There are countries with high population density and there weren’t asphalt roads 50 years ago. There is problem with dust in Arctic – ice and show is grey and it increase temperature. People use cars, heating, cooling, electrical devices – everything do heat, there isn’t any weed after harvest, etc…
There are countries with high population density and there weren’t asphalt roads 50 years ago.
Yeah, so? That’s why I challenged you to look at a satellite photo of the North East US (the most densely populated region of the US) and try to count the pixels of roads/skyscrapers. You can try that same Satellite Photo challenge with any other high population density country you care to name, the result will be the same – you’ll have a hard time even finding the pixels of the roads/skyscapers until you’re zoomed in close, the further out you are the harder they’ll be to find because they’re really a tiny, tiny, tiny part of the landscape even in densely populated areas.
Urban Heat Island Effect Caused 50% of Warming in China, New Study Finds
https://www.thegwpf.com/urban-heat-island-effect-caused-50-of-warming-in-china/
New study finds that past temperature records have failed to accurately detect urbanization biases, which may account for about 50% of the recorded warming in China since the 1940s.
Um, I don’t think you understand the link you posted. The link is arguing that UHI resulted in temp records being inflated (IE reporting that it was 50% warmer in china than it *actually* was). UHI is a known *local* issue. When you mainly record temperatures in urban environments, if you don’t properly account for that your recording will be higher than the reality for the vast majority of the country you are purporting to record the temperature of.
The Urban areas where the recording were made are a very, very, very tiny percentage of China. Do you understand that? Do you not see how a UHI biased recording of temp from that very, very, very tiny percentage of China would not accurately reflect the temps of the much, much, much larger non-urban whole of China?
(and that’s putting aside the fact that your post does not address anything in the post it is in reply to. Again, you should actually take a look at those satellite photos as I previously suggested, just so you can get some perspective. The things you babble on about cover an insignificantly small part of the earth’s surface)
How much new snow does it take to cover up some dust?
And how exactly is there “a problem with dust in the Arctic”?
The Arctic is an ocean that is covered with ice in Winter and which melts to a variable degree in Summer.
The amount of this variability in Summer melt seems to be what has so many panties in a twist.
We know polar bears are actually increasing in number in recent decades, and by a lot.
We know that sea ice has zero net effect on the level of the ocean.
We know that perpetually frozen sheets of ice are not habitat, they are virtually sterile wastelands, zones of hellish cold that are deadly to most forms of life.
There is nothing good about vast frozen wastelands.
If they all thawed out and become livable habitat areas, the increase in available land would more than cancel out any land lost to the sea level rising.
If the Arctic melted every Summer, it would be a huge boon for humans and many other lifeforms.
People burn fossil fuels to live, to grow food, transport it, preserve it, engage in general commerce…yes indeedy!
We burn fuel for:
Heating
– translation: avoiding freezing to death in Winter
Cooling
-making unlivable climates tolerable, and otherwise making our lives more pleasant and enjoyable…is that a bad thing?
Electricity
-hot water for sanitation and hygiene
-devices for preserving and cooking food
-communication
-light, not having to go to bed at sunset because it is dark and there is nothing else to do
-in general things that make us more productive, healthier, let us live longer and be more prosperous and theoretically anyway…happier.
Oh and by the way, the planet is in an ice age, and if it did get a whole bunch cooler that would surely be a catastrophe, whereas warmer has always led to increased prosperity and better conditions for life in general all over the planet.
Question for Petr Petr: If and when you have a vacation, do you go to where it is very cold, or to where it is very warm, given a choice?
Has there ever been a day where you live that a person would die of heat if stranded out of doors for a few hours or days?
How about the same for cold: Where you live, are there days that a person stuck outside (without specialized winter clothing) overnight would die?
Here is a link to my Twitter page, of an interesting picture taken in the hottest place on the planet, Furnace Creek in Death Valley, California:
https://twitter.com/NickMcGinley1/status/1149874541965074433?s=20
I want to say that urbanization is part of global warming. Impact could be low, but there is some. Global temperature has increased, but not so much too. In case people want to cool planet – there is an option – paint roofs, rocks white. Put mirrors on deserts and seas and energy will return to space. Effect will be quick a CO2 is irrelevant. Process is reversible – you can paint it black, remove mirrors and temperature will increase.
I want to say that urbanization is part of global warming. Impact could be low, but there is some
you can “want” all you want. The fact is the effect is *local*, not *global* (unless you’re talking the impact it has on the “officially” recorded temperature numbers, in which case it’s impact is large and global – just not in the way you mean).
Global temperature has increased, but not so much too
temperatures have been increasing since the depths of the little ice age, long before the period in time that man’s emissions of CO2 have been (falsely) fingered as the culprit.
In case people want to cool planet
Why would any sane person want to do that. a colder planet is more dangerous than a warmer one. More people die from the cold than they do from the heat every year.
The amount of paved surface in the United States is about equal to the area of the state of Ohio. That’s 0.023% of the total surface area of the Earth. And you claim that this changes albedo enough to alter global climate? I’d dispute the claim that it even reduces albedo, since the concrete paved surfaces are more reflective than wooded areas.
Your assertion is baseless without a lot of evidence. Provide some, then we can entertain your argument that “there won’t be cooling.”
The press release described the forecast as “unprecedented”. Perhaps it was as in unprecedentedly wrong. Solar Cycle 24 had a smoothed maximum amplitude of 116.4 in April 2104, which made it 35% weaker than Solar Cycle 23.
116.4 ?
“Perhaps it was as in unprecedentedly wrong. Solar Cycle 24 had a smoothed maximum amplitude of 116.4 in April 2104, which made it 35% weaker than Solar Cycle 23.”
David, I think you have some typos there.
According to your graph, Solar Cycle 24 amplitude was not 116.4, and it didn’t happen in 2104
I worry for my grandchildren, bless them
Your grandparents worried for you to, and their for them.
“How will the helpless children manage without us planning the future for them?”
And government only has grown bigger and bigger. That really is something to worry about.
All Watched Over by Machines of Loving Grace
Do you consider corporations part of government, since they are government creations? Can’t have a charter without state approval.
Are you part of the government, since you can’t get or hold a job, open a bank account, or do most anything without government issued papers and following government rules?
Corporations are merely groups of people like yourself engaged in a business. They have to follow the rules that the government sets forth (just like you do) that does not make them “government creations” anymore than it makes you a “government creation”. And just like you, corporations are not limited to staying within the bounds of any single country then can, and many do, operate in multiple countries under multiple different governments.
The only corporations that could in any way be considered “part of government” are the ones owned and operated by the government (such as, for example, the US post office)
Good posting, David (fix the type?). So, we very well might be heading into a Dalton Minimum or even a Maunder Minimum! During the Dalton Minimum people walked out to the Statue of Liberty on frozen water, which was mixed fresh and marine? Ice fairs on the Thames? Hello, Extinction Rebellion? I shouldn’t be so happy at the prospect of freezing people, but I can’t help myself.
The Statue of Liberty was constructed during the 1870s and the project was completed in 1886, during a period of higher sunspot activity. The Dalton minimum was earlier.
You are right, Loren W., I should have checked more before writing. Turns out that the East River froze over a lot in the 1800’s, and also as recently as 2015. Will it now become common again? Let’s wait and see.
some of us have been preparing to be on the safe side;-) lots of woolen clothes and coldweather gear stashed and planning to get decent woodpiles built up . its the dry with the cold that will be a real bummer as blackfrosts are so much nastier than normal ones;-( good thing I like root vegetables cos I suspect those n cabbages will be what we get a option of for daily food.
Id hope some aussie farmers are able to get short season canadian wheat seed imported as well but donthave a lot of hope anyones thinking that far ahead really;-(
I, a long time GW denier (since John Daley’s blog) have asked several generations of my family to consider careers in agriculture to anticipate the need for cold weather agriculture-as in reducing the subsidies not to plant in Arkansas and Mississippi. However, it’s not the “average” cooler temperature that will get us, but rather the larger standard deviations.
The Club of Rome predicted a agricultural carrying capacity of something like 5,400,000,000 people, with a die-off required to reach that level. China has been renting and buying land in Africa in response to the threat facing their variable-winters low-growing area country, and should be in good shape, but we (The USA) need to worry and plan ahead.
Fortunately, as I have mentioned, the electric sun model will come to our rescue – low cost thermal energy. https://www.lenr-forum.com/forum/thread/5558-lenr-is-occurring-in-safire/?pageNo=4 (the LENR science IS NOT “settled.”
Who is more likely to die off, elderly Chinese or young Africans?
the ones who don’t keep and bear arms will die off first.
Something like 11% of all deaths in China are related to chronic under-heating. They have problems already. Across Asia something like 600 m people survive by burning solid fuels – usually badly. A major effort is required to bring their heating appliances up to a modern standard of performance. It is not Africans v.s. Chinese who will die, it is rich v.s. poor.
When it turns cold, the poor die young, especially the really young.
Yep, you always should take care of your arms. On the other hand your legs and feet are important as well. And your brain.
if push comes to shove it wont be Chinese doing most of the dying
Who is more likely to die off, elderly Chinese or young Africans?
Answer: whoever is the poorest. Poor young Africans (particularly those in the first couple of years of their lives) die in great numbers, on the flip side, childbearing age poor young Africans have a higher birth rate than young Chinese of any economic bracket (there’s no 1 child policy in Africa) to make up for it.
All I see is junk/pseudo science in that LENR forum. Probably most of it is occupied by scammers and those being scammed, albeit a higher level of scammers than Rossi and Mills.
Good Lort. A carrying capacity of 5 million.
What, please tell, is the rate-limiting factor?
Have you not flown in a plane recently? We have miles and miles and miles of unfarmed, ungrazed land. Here in the USA, and across the globe.
We have plenty of food. If food were limited, why is it so cheap?
Consider that you want each person on the planet to have a 2,000-calorie-per-day diet for all 365 days of the year. Multiply 10 billion by 2,000 and then by 365.
Now, you have the number of calories we need to produce each year to have each person have their 2,000 calories per day.
Now, go start looking at American agricultural and meat productivity. Such as bushels of corn produced in the USA, each year, year after year.
USA annual corn alone would meet 1/3 of the calorie needs of the world.
Not even mentioning wheat, rice, oats, soybeans, other legumes,vegetables, as well as pork, chicken, beef, and sea food. No reason to resort to insects. Plenty of food. Plenty.
Logically, we have to conclude that there is no shortage of food. And, by looking at flyover country, it is obvious we have barely scratched the surface as far as arable land.
Thus, no food problem.
The problem is the lack of good government.
Each nation ought to set up the conditions for its people to be productive either in creating resources to meet the basics of life, such as food or shelter, or to produce something of value that can be traded for the basics.
We have shining examples. Venezuela. Oil all over the place. Yet, people have no food.
Rather than fostering the development of private oil drilling and refining, the govt pumps the oil and the money goes to cronies as the people starve. Meanwhile, in USA, private business is fostered in an atmosphere where it can thrive, and people make money, and the government skims some taxes off the top, and does government, including providing roads and such. And, people vote politicians in and out, so they do not take over the oil bidness.
And, contracts are enforceable in the government-provided legal system.
The rate-limiting factor is combo freedom-and-good-government.
Rate-limiting factor? Possibly water. Yet, just like we realized we had the capacity to bring the Six Million Dollar Man (“Gentlemen, we can rebuild him. We have the technology. We have the capability to make the world’s first bionic man. Steve Austin will be that man. Better than he was before. Better…stronger…faster”), we have the capacity to provide drinking water and water for irrigation and hydroponics, if things get tough.
Land? The entire population could have a modest suburban lot, with 4 per family, and fit well inside a region the size of Texas. If we hit 10 billion, then we always have Oklahoma.
About the only thing we cannot do is regain resources once they are contaminated radioactively.
Sorry to break the news to y’all. Plenty of food. Plenty of carrying capacity.
The number was 5.4 billion, not 5 million.
And it read to me that he was criticizing the Club of Rome nonsense, not endorsing it.
And the concerns he was raising are that colder weather will curtail production, not that it is currently too low or anything like that.
The best farmlands are being used, for the most part.
40% of corn grown in the US is used for motor fuel additive ethanol.
Much of the rest is used for animal feed.
All one needs to know to realize how much food there is, is review small number of statistics and trends: Over 1/3 of food grown is never consumed, it is wasted; the most prevalent food related health concern in the world is obesity, rates of which are exploding higher even in countries that were recently mired in poverty, with famine now very rare and as always more political than weather related; food is cheap, less than ever in history in terms of percentage of average disposable income.
There are plenty of other relevant stats, such as that there are more people than ever and yet there are more calories per person grown in the world than ever in human history, the percentage of people involved in food production is lower than ever, or that yields are setting new records nearly ever year, and do so by every metric one might choose.
Radioactivity is not an issue for food production, but cold weather is.
Late spring or early fall frosts and freezes can and do have hugely negative effect on crops.
Cold kills everything.
Warmth is life.
BTW, check your math.
Texas is 167,624,960 acres.
Many people do not live in fours.
And what about rivers, lakes, mountains and other steep terrain.
What about roads?
Stores, warehouses, places where people make stuff?
What would be the costs to having people evenly distributed across a wide area?
Everyone needs each of the things necessary to survival everyday.
These become far more expensive to deliver when people are spread out.
Transportation becomes impossible without extensive infrastructure.
And what does such a calculation have to do with food production?
People are already living the way they like in the US: Some like to be crowded into cities, some prefer to be out in open country and have wide spaces, and some are willing to spend a significant portion of their lives and money travelling long distances between work and home.
What has worked best in terms of prosperity is for people to be free to do what they want, within certain limitations, within central planning, oppressive rules and dictats, and without busybodies telling everyone else how they need to live.
Warming has had some beneficial aspects including a longer growing season and a 14+% increase in arable land between 1961 and 2014 (as reported by the UN). If the world cools by 1-2C, we will lose at that 14% of arable land and the growing season will decrease by up to a few weeks. While the USA will easily feed its population, the rest of the world will be in trouble. A steadily increasing population will add to the stress on world food supplies.
“5,400,000,000 people” is 5.4 Billion, not million.
BIG (Brother) government will always be our biggest problem.
To add to your optimism, just looking at the demographics of the world, the population will DECREASE before the end of the century, with China alone (due to their disastrous 1 child policy) due to lose 57% of its population. There is an will remain PLENTY of food for the world’s population. It will take politicians to screw it up (and they will-since the `60’s the only starvation has been caused by politicians).
Indeed Richard. And the best way to “reduce population growth” is prosperity. Look at the birth rates of the prosperous nations, they’re general low across the board (with many being below the replacement rate) and compare that to the birth rates of the poorest nations, they’re generally high across the board. Green policies that prevent the poor nations from having cheap, reliable energy only serves to keep those nations poor and thus runs counter to their purported goals of preventing the population from growing to “unsustainable” levels.
The World’s population is already shrinking in most countries. We will not hit the over-population estimates.
Rate-limiting factor? Possibly water. Yet, just like we realized we had the capacity to bring the Six Million Dollar Man (…“
Um, you do realize the Six Million Dollar Man isn’t a real person, he’s a fictional character.
That said, you are correct that we could pack a lot of people into a fraction of the space we currently are spread across. Population density of the US as a whole is somewhere between 70 to 90 per square mile.
compare that to the population density per square mile of :
New York City, NY (most densely populated major US city) is 27,016
Guttenberg, NJ (the most densely populated incorporated place in the US) is 57,116
Manhattan, NY (the most densely populated borough of New York City) is 69,467
Friendship Village, Md. (most densely populated unincorporated place in US) is 81,991
There’s plenty of space to fit more people should we ever need to.
Enginer01 sez:
electric sun model
Now I understand why you misspelled engineer…..
As an Aussie, it’s not wheat I’m worried about – what happens to all the refugees from the northern climes looking to migrate to warmer regions for a while?
Perhaps we are seeing some early signs of the weakness of SC 24 and the even weaker approaching SC 25. I live in a northern suburb of Houston. Its predicted to be 38F here on Halloween eve. In Lubbock, Tx it is predicted to drop to 19F the night before Halloween. 19F in Texas in October is quite unusual to say the least.
It’s 14F and falling (snow too) in the Denver area. It was -35F in Utah yesterday, breaking the October low record for the lower 48 states by 2F.
We will know before the world ends in 11 years who was right.
-35F in Utah yesterday
That is a special and interesting situation, called the Peter Sinks.
https://climate.usu.edu/PeterSinks/index.php
I guess it does.
The polar solar fields http://wso.stanford.edu/Polar.html ( up to now the best available forcast tool) point to a somewhat stronger SC25 than SC24, however still well below the average of the SC1…23. IMO one can’t give any evidence based forcast for lower than SC24 activity. It’s just a guess…
The trend is clearly visible in the equatorial dipole. He has the greatest impact on the Earth’s magnetosphere.
http://wso.stanford.edu/gifs/Dipall.gif
I see that one and raise you this one: I notice that nobody inserts images in comments any more. So a verbal description. The activity on Svalgaard’s graph is bounded and declining. The recent highs in 2017 touch the same lines from 1976. The other interesting thing is the low activity from the start of measurements in 1966 up to 1971. This is the likely cause of the 1970s cooling period. I take from all that the use of solar polar field strength to predict amplitude of maximum will work right up until it doesn’t.
Surely this should be termed the ‘Anthropocene Minimum’?
Due to excess CO2 from the Earth’s atmosphere sweeping across space and interfering with the reactions on the Sun? Because everyone knows that you use CO2 to put fires out, and our output is so strong that it’s affecting Space Weather as well as the conventional kind…
“…excess CO2 from the Earth’s atmosphere sweeping across space and interfering with the reactions on the Sun…” Sounds just like something AOC would push on the masses. Sadly, it would be accepted.
Don’t give the warmists ideas!
You used to use CO2 to put out fires but all those extinguishers have been removed from my office to save the polar bears – all 40 odd thousand of them. What we have is water mist extinguishers. Now, I know what you are thinking – how does that fit with an electrical fire? The answer seems to be – not very well. As in they don’t really work.
Whoever came up with that “bright” idea should be fired.
Fun.
Has Dr. Svalgaard predicted a slightly stronger SC25? I’ll be interested to see if he weighs in on this.
Yes, Leif Svalgaard has predicted a stronger SC25 than SC24:
https://leif.org/research/Prediction-of-SC25.pdf
… and has reconfirmed it here a few months ago:
https://wattsupwiththat.com/2019/06/21/sun-spotless-for-33-days-straight-airline-travelers-getting-dosed-with-70-times-more-radiation/#comment-2728143
“Solar Cycle 24 had a smoothed maximum amplitude of 116.4 in April 2104…” I think 2104 is a typo. Did you mean 2004 or 2014? Just askin’.
Is there any way at all to guess at what effects a long-term solar minimum will have on large freshwater bodies, like the Great Lakes? I think the Coast Guard stations on the Lakes will be prepared for it, but in general, the side effects like ice dams on rivers and the flooding that follows when/if they break up ought to be addressed, shouldn’t’ it? Better to be prepared than taken by surprise.
Snow in forecast tonight and tomorrow, along with rain – SLOP STORM!!!!
Thanks for feedback on this. It may seem unimportant, but haven’t we had enough similar events to prep ahead of the mess?
Exactly it comes to April 2014.
http://www.solen.info/solar/
Sara, look at the air circulation and get ready for the frost.
http://tropic.ssec.wisc.edu/real-time/mtpw2/product.php?color_type=tpw_nrl_colors&prod=namer×pan=24hrs&anim=html5
On November 1 it promises to be a snowstorm on the Great Lakes.
Yeah, we are supposed to get a mix of rain and snow tonight, long after I have hit the pillow. And I still have geraniums blooming. Time to put them in the garden shed. (Sigh.)
Today’s equipment seems to identify very weak sunspots that make the count that may have not been picked up in earlier cycles. Watching spaceweather.com the last couple of months had one pop up that had to be circled to be identified and lasted but just a couple of days.
I wonder if that would have been counted in previous cycles and does that make the current record overstated vs earlier cycles?
Leif has investigated this and published on the subject.
https://www.leif.org/research/Press-Conf-Ancient-Telescope-Sunspots.pdf
You need to look up the meaning of “unequivocal”
This is what Haigh actually wrote in her conclusions:
“This means that the value for the solar radiative forcing of climate change over the past one and a half centuries cannot be precisely established. Nevertheless, the results of statistical studies of global temperature records concur with those from climate models that, while increases in solar activity probably contributed 7-30% of the global warming apparent over the century leading up to the 1960s, the warming in the latter part of the 20th century is almost entirely due to the increasing concentrations of greenhouse gases from human activity. ”
“Currently the theory involving heating of the stratosphere by solar ultraviolet radiation, with effects transmitted by changes in winds and circulation down to the surface, is the most well-developed. This is not, however, exclusive of other proposed mechanisms and any or all of them may be act-ing to varying extents.”
” This raises the issue that the Sun might buy some time for the world to adjust to greenhouse gas–induced global warming. It would be rash, however, to become complacent on this basis for several reason”
Haigh wanted to keep her job, or at least have the thing see the light of day. Take no notice of the verbiage.
All such commentary ignores that there have been many periods in the past 10,000 year in which the world was warmer, and the vast majority of the history of the Earth was far warmer than the present era.
These warmer times were not a disaster, but led to great prosperity for all living things.
And these past temps have never been controlled by the amount of CO2 in the air, which has been both lower and higher, with temps both lower and higher for any give CO2 level.
CO2 is a red herring.
And the idea that warmth is bad is at once preposterous and illogical, inane and contradicted by all of Earth and human history, and is in fact just made up BS that only proves that large numbers of people will believe any lie without critical thought ever entering their minds.
The planet is in an ice age!
Nicholas
What does any of that have to do with my comment or with sunspots, which is the topic of this post?
” This raises the issue that the Sun might buy some time for the world to adjust to greenhouse gas–induced global warming. It would be rash, however, to become complacent on this basis for several reason”
“Back on March 7, 2006, the National Science Foundation issued a press release predicting that the amplitude of Solar Cycle 24 would be “30 to 50 percent stronger” than Solar Cycle 23.”
More than two years earlier (January 2004) M. Vukcevic published solar activity formula which forecast the SC24 within a decimal point.
What does formula forecast for the SC25?
Go to http://www.vukcevic.co.uk/SSN.htm
and follow instructions.
Interesting! How do you think that the sun behaves following your curve fitting? What’s the physics behind?
Curve fitting is nonsense – until it becomes predictive for many cycles.
And then, who knows….
Ralph
Formula numbers are based on the gas magnetic giants (Jupiter-Saturn-Uranus) resonance coupled into solar magnetic field.
The hypothesis is that the sun is physically by far too large for a power generator driving it, to have an internal self oscillating mechanism of about 11 years, additionally being damped down every 100 or so years. Therefore I looked for an external mechanism modulating these magnetic disturbances into what we know as the sunspot cycles.
Dr. Svalgaard did an early great work on the heliospheric current sheet. As the open solar magnetic field flows along heliosphere it encounters strong planetary magnetic fields, creating ever changing magnetospheres, eventually ‘short-circuiting’ the tail ends into the ‘magnetic reconnection’ (effect is observed as aurora). By doing so the reconnection turns open solar magnetic field into a close field and so establishing an electro-magnetic feedback loop between solar surface and planetary magnetospheres, NASA calls it ‘magnetic ropes’ or ‘portals’.
These links are particularly strong when any two magnetic giants occasionally line up along the Parker’s spiral, thus without presence of planets with powerful magnetic fields sunspot s would be still occurring randomly with no particular pattern as they do intra-cycle, while the external factors impose both 11 year and near centenary modulation of the otherwise random activity.
It’s only hypothesis, impossible to verify but easy to dismiss by anyone selling an alternative product.
p.s. typed on mobile phone apologies for possible errors.
Not sure what you mean by saying sunspots are random with no pattern?
Spots are relatively sparse outside of about 30 degrees North and South solar latitude. And few occur right near the equator. Thus when plotted over an entire cycle, two quite distinct lobes are seen, as in the familiar butterfly chart.
At the beginning of each cycle they are rather few and far between and mostly occur at the higher latitudes, near 30 degrees.
As the cycle proceeds, they become far more numerous and spread out across the full range of the 30 degree belts of latitudes they are most frequent in
Spots that form outside of 30 degrees are also most likely prior to solar max.
As the cycle winds down, spots at higher latitudes become infrequent or absent and the concentrations are near the equator.
Stronger cycles have far more spots at and above 30 degrees than weaker cycles.
There is for sure an element of randomness superimposed on the overall patterns, but there are patterns, and clear limitations to the degree of randomness.
An analogous situation can be seen in Earth with the pattern of hurricane formation and paths.
Or with ordinary mid latitude cyclones.
While much randomness exists in exactly when and where they form, it is obvious from charting all of them over a long period of time that some areas rarely or never have them, and other areas will see them on a regular basis.
Time scale distribution.
Vuk – just give us the answer 🙂
I agree.
Outline what you think will happen.
Anyone who wants the finer details can click links and such.
It is not as straight forward as it appears at first glance. We now that weak cycles tend to be longer, while strong ones are usually short. If SC25 is starting late and as I assume it is going to be rather weak then its peak might be later than usual 4-5 years from the current minimum, which is still not determined. To forecast the amplitude of the SC25 one has to assume year of its occurance and enter into formula.
I’m posting this from a handheld phone and being long away from home and my desktop I can’t give you value, but I vaguely remember that if max occurred 2025 or 2026 it might be around 50-55 on the old scale i.e about 5/8 of the C24.
Typo: know
“spacemen”
You un-wokeness is showing.
“Your”
“In her 2011 paper Haigh showed an unequivocal relationship between solar activity and climate as recorded in North Atlantic ocean sediments:
1. Not a peer reviewed paper. A briefing. with no code and no data.
2. NOT unequivocal . briefing states ” An example
is given in Figure 14, which shows fluctuations on the 1,000 year
timescale well correlated between the two records, suggesting a
long-term solar influence on North Atlantic climate”
A) NO measurement of the correlation or its signifance.
B) Author CLAIMS it SUGGESTS.. not unequivocal.
But Hey with the solar min coming up and a weak cycle 25.. skeptics be like “its gunna freeze”
Steve,
You didn’t read pages 18-20, and that it is a BRIEFING paper. It is a collection based on a number of published papers.
Grantham Institute for Climate Change Briefing paper No 5
Understand what a BRIEFING paper is now?
For an English major, it really is surprising how much of the English language he fails to understand.
Here’s what I don’t get with this solar stuff
If the Sun is cooling us down, yet the Earth is getting warmer, surely that means that CO2 is more powerful than previously thought?
No it is the EL-NINO effect that is the main cause, when it warms it is that in action, when it cools, it is LA-NINA in action.
Right now we have a weak El-Nino ongoing.
CO2 is a negligible player in the “heat” budget.
It could be that there is a long lag time in lower solar radiation effecting the oceans, I was sceptical about this but I am coming round to this idea now.
As other have noted our oceans tend to smooth out the effects of the sun. The energy is then released unevenly based on ever changing ocean cycles. The primary ones are the PDO/ENSO and the AMO/NAO/AO.
Since 1980 the PDO has been positive (warm mode) about 80% of the time and the AMO has been positive since the mid 1990s.
If this view is correct then we can expect these oscillations to trend more negative over the next 30-40 years. This should lead to a cooling influence similar to the 1960s and 1970s. In addition, the lower energy supplied by cycles 24 and 25 could enhance the cooling.
The wild card is what is sometimes referred to as the millennial cycle (cause of previous warm periods). My view is the millennial cycle could be either solar or ocean based as well. We are currently near the peak so I don’t expect significant cooling to occur no matter what.
The relationship between solar activity and climate is supported by thousands of papers. Criticizing one won’t get you anywhere.
(unfortunately for us, mosh has no intention of going anywhere)…
Kind of like how we are supposed to agree with all your homogenization and adjusting to get the “right” answer on just what the temperature of the Earth is to the hundredth of a degree? Or why the temperature record prior to the 1950’s was too high and had to be “adjusted” lower to get it right?
We have vast areas of the world where there are no physical temperature measuring devices (and a whole lot more where their accuracy is suspect) but you publish a global data set which is highly accurate and the gold standard?
Sorry dude, please don’t bring out any flaws or shortcomings when your whole methodology is comparable to a monkey and a dartboard.
Or to put it another way, Mosh should stop looking for the mote in others eyes until after he’s taken care of the beam in his own.
Saying a paper is not peer reviewed has as much relevance as criticizing the font.
“Steven Mosher October 29, 2019 at 6:39 am
1. Not a peer reviewed paper. A briefing. with no code and no data.”
Doesn’t matter. Peer review does not make any paper right or wrong. It just means a peer has reviewed it. Sometimes they haven’t even read the entire paper. Peer review covers many disciplines, sciences and industries. In my line of business, I have peer reviewed design documents but at no stage was I required to agree or disagree with any content in the document. The only requirement was to say it had been peer reviewed.
I have reviewed Irina Kitiashvili’s analysis and I am with Leif on this one. I support that SC25 will be stronger than SC24. Somewhere in between SC20 and SC24.
Sorry folks, solar activity is going upwards not downwards. Which is good because I like warming a lot more than I like cooling.
Cycle analysis supports a new solar activity maximum around 2055. Until then solar activity should be in the increase.

I’m there more with Landscheidts weaker cycle 25.
’til now he was right with cycles and El Niños.
We will see 😀
This is great. A betting pool would make it even more fun.
That would sure cure all this climate nonsense. And also cure all the weather/temp adjustments, because the last thing a gambler wants, is to get ripped off by unscrupulous scientists feigning the hottest year ever, every year.
That would put the variation within the range of SC 12-16 so don’t break out the short sleeves just yet. If multi-cycle groupings are more important than single cycles, then we are still on track for cooling over longer periods.
Thanks, Javier
Javier, please be so kind to assess your statement a few month ago that the minimum of SC24 was over in April because the 13 month smoothed SSN value of Silso reached a small value. FYI: the minimum holds on up to now and the SSN avarage of the last 4 month is 1.0. You must look back to SC5/6 to find such a low value for 4 monthin a raw.
The SC24 minimum holds ( I think about 1 year more) and the sunspot activity is by far lower than during the last minimum.
The sun was pretty active through most of the 20th Century, and we had mid-Century global cooling. We had increasing CO2 while we had mid-Century global cooling. So, the cooling had nothing to do with CO2 or the sun. Some want to blame the cooling on man-made aerosols, but that is only conjecture, not calculation, and the cooling was also happening in the Southern Hemisphere where man-made aerosols where insignificant.
Something else is happening, and it has a bigger temperature impact than the sun and CO2 on decadal time scales.
The most likely candidate is natural ocean cycles impacting the cloud cover and water vapor concentration in the atmosphere. Until these cycles and their impacts are understood, the impact of the sun and/or increasing CO2 on global temperatures cannot be measured or verified with observations.
I believe that the 2020s, 2030s and the 2040s will be decades of global cooling, and the sun and CO2 will not be able to alter that. It will largely be associated with the negative phase of the AMO, but the AMO will not be the sole reason for it. Multiple natural cycles and feedbacks will be in play, and it will take a lot of real atmospheric scientists to decipher the mechanisms.
(This theory was derived using the arcane practice of pattern recognition. No data sets were harmed or abused in the making of this theory!)
Following M. Lockwood, at least NH winters will be stronger / colder during solar minima
The problem with siting one thing, like the sun or CO2, and then saying that the weather will be X because of that one thing, is that it is far too simple. The Earth’s weather and climate are very complex, and figuring out the impact of one single thing on the system is virtually impossible. If, however, you know all of the significant players and how they interact, one can make a decent forecast.
We do not know the significant players and how they interact. The IPCC pretends to know the players by simply ignoring all the players they do not know. M. Lockwood is likely making the same mistake.
If you add the phrase, “all else being equal”, specialists improve their chances of being scientifically correct. But since nothing else is ever equal, their predictions have almost no skill. One could maintain some scientific credibility by saying that the probability of stronger/colder winters in the Northern Hemisphere increases at solar minimum, but a forecast for stronger/colder winters just because we have a solar minimum is a forecast that risks not only being wrong, but discrediting the importance of the solar cycle.
All factors must be taken into account in a forecast or in theory verification, and we still do not know all the factors. That leaves pattern recognition as the most viable tool for accurate multidecadal forecasts. You don’t have to know the players or the way they interact. You just have to be able to recognize the patterns they make.
In the case of NH winter and solar minima, there are several known players interacting:
Solar Influence on Global and Regional Climates
and
Are cold winters in Europe associated with low solar activity?
Clouds.
See
https://notrickszone.com/2019/10/28/scientists-the-entirety-of-the-1979-2017-global-temperature-change-can-be-explained-by-natural-forcing/
Yes, and the change in cloud cover was not caused by changes in atmospheric CO2.
Warming caused by a change in cloud cover unlike the CO2 hypothesis can quickly change from warming to cooling.
GCR correlated with cloud cover up until 1994 at which time there was a reduction in high latitude cloud cover.
Solar cycle 24 is different than solar cycle 24 in that the sunspot ‘groups’ are now made up of one or two tiny pores that have a life of few days.
Normal sunspot group life time for past cycles is around 20 days so the odd sunspot group would reappear after making the journey around the sun.
The warming and cooling cycle is clearly seen in the paleo data.
Does the Current Global Warming Signal Reflect a Recurrent Natural Cycle.
http://wattsupwiththat.files.wordpress.com/2012/09/davis-and-taylor-wuwt-submission.pdf
http://www.agu.org/pubs/crossref/2003/2003GL017115.shtml
Timing of abrupt climate change: A precise clock by Stefan Rahmstorf
Many paleoclimatic data reveal a approx. 1,500 year cyclicity of unknown origin. A crucial question is how stable and regular this cycle is. An analysis of the GISP2 ice core record from Greenland reveals that abrupt climate events appear to be paced by a 1,470-year cycle with a period that is probably stable to within a few percent; with 95% confidence the period is maintained to better than 12% over at least 23 cycles. This highly precise clock points to an origin outside the Earth system (William: Solar changes (more complicated than just a change in the solar magnetic fields/sunspots) cause the warming and cooling); oscillatory modes within the Earth system can be expected to be far more irregular in period.
When solar activity is considered most of people think of the TSI being driver of global temperature natural variability, but that may not be necessarily so. Sun has a hundred years magnetic periodicity cycle, based on difference between magnetic cycles in two hemisphere, therefore every 50 or so years as two hemisphere take a change over in magnetic cycle advance/lag there is either prolonged minimum or a low cycle. This periodicity is observed in instrumental temperature records too.
In my post further above there is a link http://www.vukcevic.co.uk/SSN.htm which quoted paper by M. Vukcevic. Paper contains solar activity formula based on three equations: periodicity, amplitude envelope and magnetic anomaly. It is anomaly equation that gives direct link to the global temperature variability. All three equations suggest low solar activity in late 2020, while the magnetic anomaly also points to global cooling at the time. Here is graphic representation of the above
http://www.vukcevic.co.uk/MM.htm
It appears that the mid century cooling you mentioned is associated with magnetic anomaly, i.e. it is part of the natural variability cycles.
“unprecedented”
No one seems to know what the word “unprecedented” means.
Given the numerous words used in English, that’s unprecedented.
“unprecedented” is to alarmists what “inconceivable” was to Vizzini
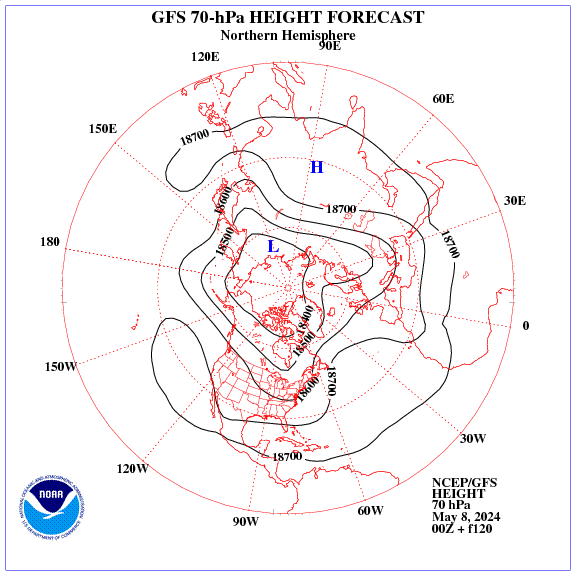
The polar vortex in the lower stratosphere create two centers. One of them is located over Canada.
https://earth.nullschool.net/#2019/10/30/0000Z/wind/isobaric/70hPa/orthographic=-109.96,72.36,338
The real discussion should be around whether the NASA approach is one garnering broad buy-in or whether it is playing to an agenda promoting a big NASA space budget in the 2020s. The concluded result is just what big space explorers would want to hear.
Reading the BTLs it appears that no concensus exists: NASA says 25, Vuk says 50-70, Leif Svalgaard says higher than 115. Doubtless others have opinions too: Hathaway? Abdusammatov?
The crux about arguments over a new Maunder is that no-one observed the last Maunder with modern technology so nobody really knows what one will look like. We did not observe the Dalton minimum with Hubble either, so we have no data record beyond crude sunspot numbers to compare the two types of minima.
If I were a bookie, the odds I would use currently would be 1/3: Dalton; 2-1 Maunder.
But I am very open to being educated by professionals in the field.
50ish on the old scale, but might be even lower if SC 25 is later than 2025.
Hardly a mention of Cosmic Radiation, very odd indeed.
NASA knows more about that than the above reports. A trip to Mars will involve serious GCR doses.
The best shielding on the Moon is lava tubes, on Mars too.
Or crystalline double-domes containing up to a dozen few feet of water. Micrometeorites would pock the outer dome with only slow escape of vapor. Plants, even tall trees inside. For the Lunar night, grow-lights.
I have seen a couple of these predictions for a weaker than 24 cycle 25. However, our esteemed Dr. Svalgaard has estimated that CY 25 is not to be any weaker than CY 24. Considering the continuing weakness in sunspots, I wonder if he has changed his mind?
The great thing about these types of forecast is that the can be verified or falsified in a reasonable time frame – unlike climate models that predict temperature in the year 2100.
Same thing with ENSO models – we know they don’t have much skill!
If this is correct, it could explain the renewed urgency of warmist propaganda. They must install their world socialist government before it becomes obvious that heating is not going to be a problem. This is their last opportunity to conquer the world.
“Lower solar activity means that it will become colder and colder is drier. Prepare accordingly.”
Might be true if it were the only influence, but it is not. Not only that, but the effect is relatively minor.

jorgekafkazar, While they might consider it their best opportunity, it won’t be their last, they’ll find something else to glom onto to be their trojan horse, same as when they transition from “global cooling”/”the ice age cometh” in the 1970s to global warming in the 1980s when it became apparent that mother nature wasn’t cooperating with their narrative. Similarly how they transitioned from talking about “global warming” to talking about “climate change” in the 1990s/2000s when, again, the world’s weather just wasn’t doing what it was supposed to – Kind of hard to sell global warming when the weather is brutally and abnormally cold with snow far from being “a thing of the past”. Climate change, on the other hand, is good to blame for what ever ails you, which is why everything under the sun gets labels as “because climate change”.
50ish on the old scale, but might be even lower if SC 25 is later than 2025.
Weak solar cycles appear to coincide with droughts ?
Thanks for these different appreciations, but I think it’s better to let real specialists speak here, e.g. Leif Svalgaard:
https://leif.org/research/Prediction-of-SC25.pdf
This is confirmed by guest poster and regular commenter Javier.
The two mya simetimes highly differ about the influence of solar cycles, but that is exactly the reason why I trust in their common view.
In five days the polar vortex will move over the northeast US.
“This is no joke, as a winterlike storm has the potential to put down a swath of heavy snow over a 750-mile long swath of the Heartland prior to the end of this week,” AccuWeather Senior Meteorologist Alex Sosnowski said.
Interesting graphic from Silo regarding the number of spotless days vs solar cycle amplitude. If this is indeed going to be a low cycle for 25, we are looking at several hundred more spotless days… We are currently at 226 spotless days this year with about 60 days to go in the year.
http://sidc.be/silso/IMAGES/GRAPHICS/spotlessJJ/SC25_SCvsNumber.png
I love heliophysics!
Thanks for linking that graphic. I eyeballed data for 18 cycles, with spotless days matched against maximum of the following cycle. The correlation was -0.65, and I believe the sampling standard deviation for uncorrelated values is sqrt(1/18) = 0.24. So the observed correlation is a 2.7 sigma event, which is pretty significant.
BTW the F10.7 flux was 64 on October 21st, and I can’t remember the last time I saw it that low.
See – owe to Rich
“… and I can’t remember the last time I saw it that low.”
Yes it’s a while ago:
1954 11 03 61.6
1953 02 24 61.8
1954 01 06 63.1
1954 04 02 63.5
Hey guys, does anyone know a good source of text data for sunspot numbers, preferably NOAA’s? I used to use:
ftp://ftp.ngdc.noaa.gov/STP/space-weather/solar-data/solar-indices/sunspot-numbers/american/tables , but it seems to have stopped in mid-2017.
TIA, Rich.
See – owe to Rich
I use this data since years:
– SSN: http://www.sidc.be/silso/DATA/SN_m_tot_V2.0.txt
– F10.7: http://lasp.colorado.edu/lisird/latis/dap/noaa_radio_flux.csv?&time%3E=1947-02-14T00:00:00.000Z&time%3C=2018-04-30T00:00:00.000Z
Rgds
J.-P. D.
Rich….
For SN, flux and Ap data…..(nice)
go here–>> ftp://ftp.swpc.noaa.gov/pub ..then click on WEEKLY and RECENT INDICES
Or this page at Omniweb:
https://omniweb.gsfc.nasa.gov/form/dx1.html
What a difference a few spotless months make in solar cycle projections!