Guest geological story-telling by David Middleton
Do you ever get tired of smarmy, snot-nosed articles like this?
Obituary: Remembering the Holocene Epoch
BY CHRIS WILSON
AUGUST 29, 2016The Holocene Epoch, which witnessed milestones from the development of Crater Lake to the invention of the electric guitar, died prematurely Monday in Cape Town at the age of 11,650. It is survived and succeeded by the Anthropocene Epoch.
The cause of death was the rapid alteration of the earth’s ecosystem due to nuclear weapon tests, micro-plastic pollution, agriculture, carbon emissions and other human contributions to the changing environment, according to the Anthropocene Working Group. News of the Holocene’s death could not be independently confirmed by the International Geological Congress, which is conducting a review of the evidence surrounding the epoch’s death.
If confirmed, the Holocene’s death at eleven-and-a-half millennia would make it by far the shortest-lived of its ancestors. Its immediate predecessor, the Pleistocene Epoch, died at over 2.5 million years old, while the Eocene Epoch survived to be nearly 22 million. But even for an epoch cut so tragically short, its accomplishments stand out.
“It set up these Goldilocks conditions for human civilization to take off,” says Nicholas Spano, a graduate student researcher at the Department of Integrative Biology and Museum of Paleontology, University of California, Berkeley. “During the Holocene, earth’s climate as a whole became much more stable.”
[…]
Time Magazine
Notes to Chris Wilson:
- After 10 years of lobbying the media, the Anthropocene Working Group has yet to produce a coherent recommendation for an Anthropocene Epoch and it is a near certainty that they will never produce a recommendation that could even come close to approval.
- Why in the Hell would you consult with a biology grad student, working in a museum, about the climate of the Holocene?
- Which Goldilocks conditions? Most of the Holocene was much warmer, with higher sea levels and less ice than today.
- Your smarmy snot-nosed diatribe is “not even wrong.”
This article is far less smarmy and snot-nosed, but still “not even wrong.”
Anthropocene in the Arctic
A behind the scenes account of how the scientific community came to terms with the changing landscape of the ArcticBy Anant Misra
Last Updated: Monday 28 January 2019
“But the Arctic tells no lies” — It is with these words that Mark C Serreze closes the last chapter of his book, Brave New Arctic. The words are at once mournful as well as menacing. What makes them truly ominous is that throughout the book, Serreze’s tone remains neutral and matter-of-fact, sometimes painfully so. Soon after discussing the declining population of polar bears—which he takes care to point out is due to a variety of factors—Serreze cheerfully mentions that bowhead whales are actually doing quite well as the loss in seaice has led to a bounty of food supply.As is evident from the aforementioned example, climate change is a complex phenomenon—one whose effects are still not entirely understood even by those who have spent a lifetime studying it. It is this complexity which drives the book and comes across as its most prominent theme. Serreze is forthright in admitting that throughout the 1990s and early 2000s, the scientific community was not clear on how to best distinguish human footprints of global warming from natural climate variability. This was mostly due to unreliable accounts and records which did not go far back enough to provide sufficient data for mapping climate change.
[…]
Down to Earth
The Anthropocene doesn’t exist… It’s not even wrong. But, in the spirit of ridicule, I will pretend that it does exist for the duration of this post.
Insufficient data
Allow me to repeat the last paragraph of Anthropocene in the Arctic:
As is evident from the aforementioned example, climate change is a complex phenomenon—one whose effects are still not entirely understood even by those who have spent a lifetime studying it. It is this complexity which drives the book and comes across as its most prominent theme. Serreze is forthright in admitting that throughout the 1990s and early 2000s, the scientific community was not clear on how to best distinguish human footprints of global warming from natural climate variability. This was mostly due to unreliable accounts and records which did not go far back enough to provide sufficient data for mapping climate change.
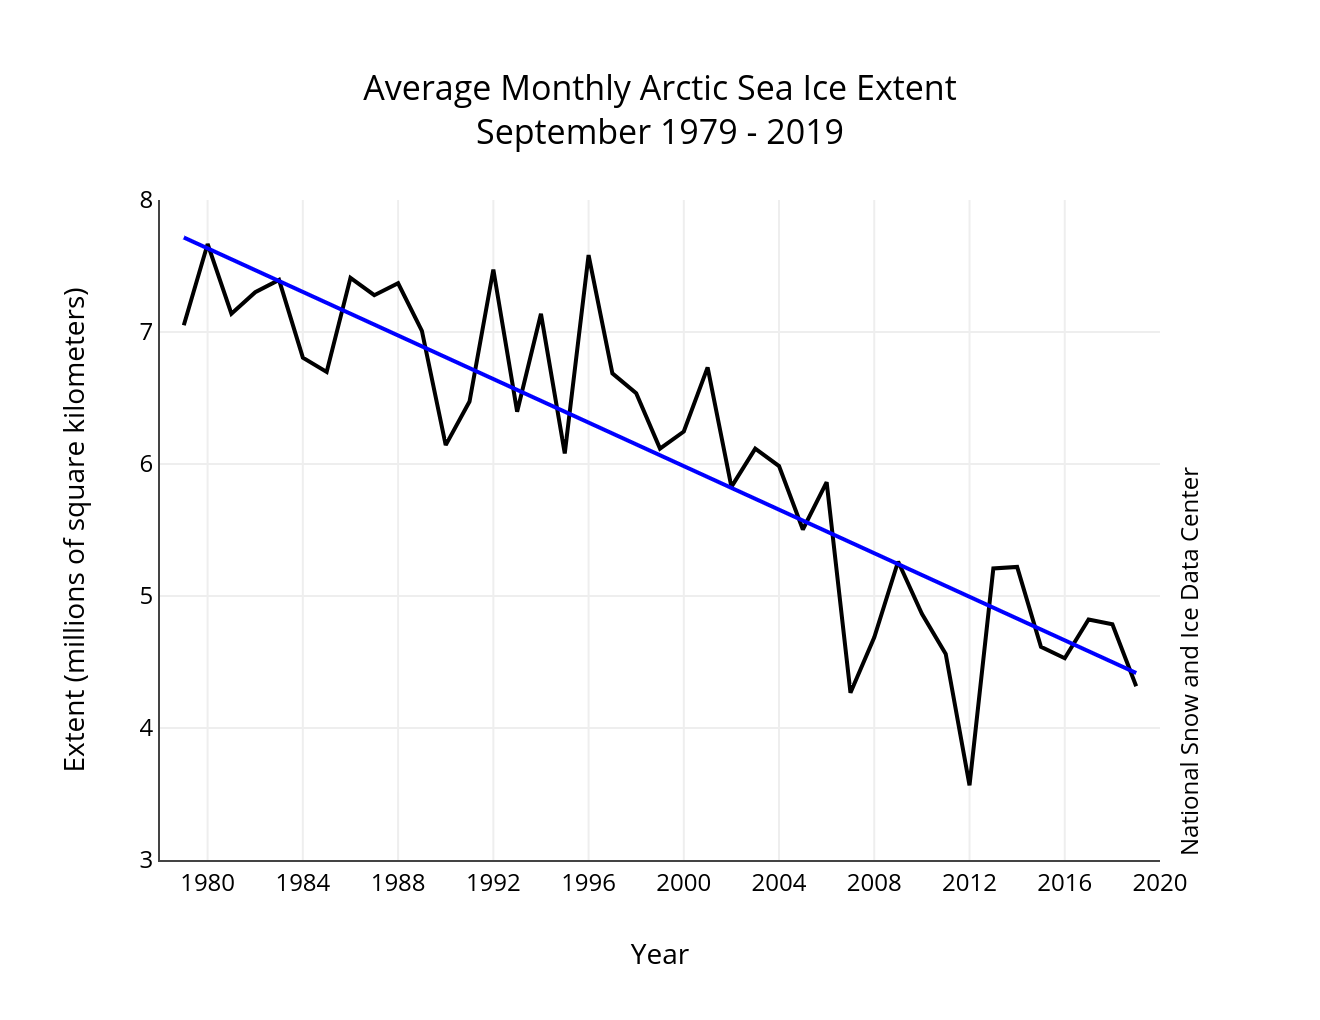
Mark Serreze has been the Director of the National Snow and Ice Data Center since 2009. NSIDC publishes a daily Arctic Sea Ice News and Analysis. Whenever someone says something like this, “Arctic sea ice extent for September averaged 4.32 million square kilometers (1.67 million square miles), the third lowest in the 41-year continuous satellite record, behind 2012 and 2007″, they’re usually citing the NSIDC. When the record length is only 41 years, “third lowest” doesn’t tell us very much. As noted in the article about Dr. Serreze, the “records which [do] not go far back enough to provide sufficient data for mapping climate change.”
In addition to lacking climate-relevant context, the measurements also lack a size context.

High-resolution image
Is 4.32 million square kilometers small? Medium? Large? Geologists are big on context and scale. When a geologist takes a picture with a person in it, the person is just for scale. Since quarters, lens caps and rock hammers are far too small to contextualize 4.32 million square kilometers, we need something bigger.
The Arctic Ocean is the smallest of the world’s five oceans (after the Pacific Ocean, Atlantic Ocean, Indian Ocean, and the Southern Ocean). The Northwest Passage (US and Canada) and Northern Sea Route (Norway and Russia) are two important seasonal waterways. In recent years the polar ice pack has receded in the summer allowing for increased navigation and raising the possibility of future sovereignty and shipping disputes among the six countries bordering the Arctic Ocean (Canada, Denmark (Greenland), Iceland, Norway, Russia, US).
Area:
CIA World Fact Book
total: 14.056 million sq km

What percentage of the Arctic Ocean is covered by 4.32 million square kilometers of sea ice?
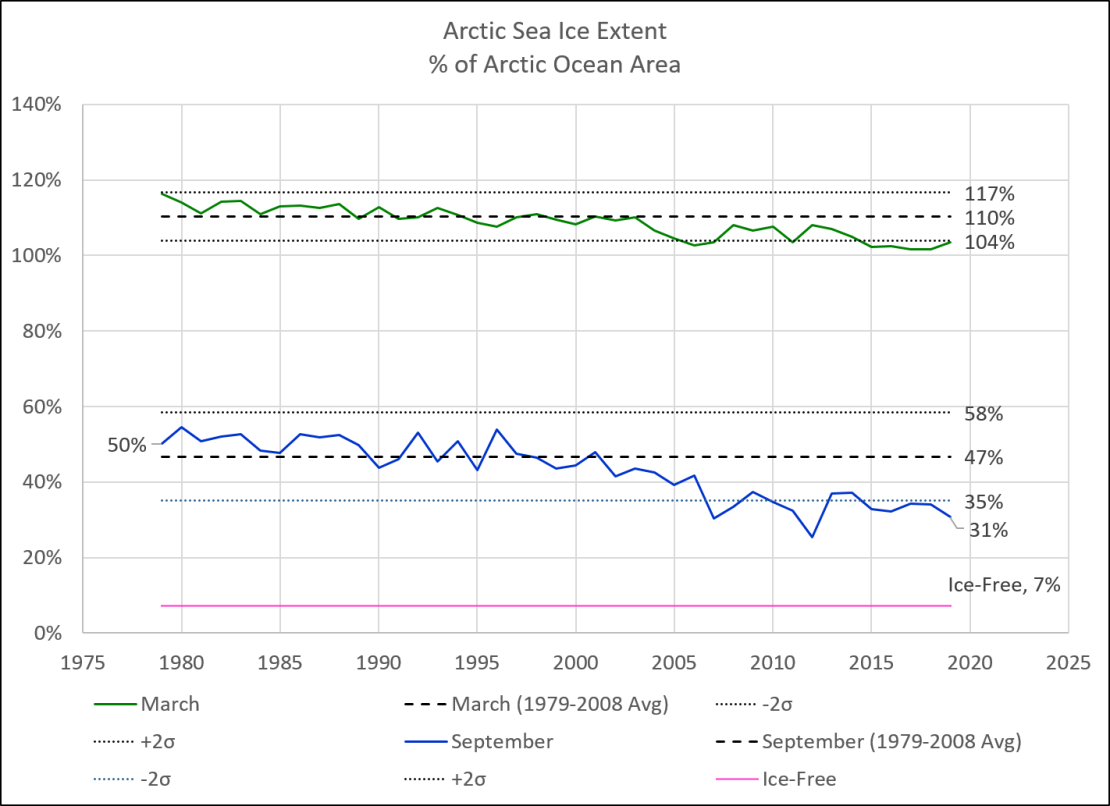
Now we have some context and scale. 4.32 million square kilometers is 31% of the Arctic Ocean… Just a bit below the climate “normal” range. Doesn’t sound like much of a death spiral to me. Bear in mind that the satellite record started right about here:

However, 41 years is much too short of a record length to determine what the climate “normal” should be. Fortunately, there have been efforts to reconstruct sea ice extent prior to the satellite record.

To look back into the past, researchers combine data and records from indirect sources known as proxy records. Researchers delved into shipping charts going back to the 1950s, which noted sea ice conditions. The data gleaned from those records, called the Hadley data set, show that Arctic sea ice has declined since at least the mid-1950s. Shipping records exist back to the 1700s, but do not provide complete coverage of the Arctic Ocean. However, taken together these records indicate that the current decline is unprecedented in the last several hundred years.
NSIDC
“The current decline is unprecedented in the last several hundred years” is a big No Schist Sherlock. Earth has been warming from the coldest climate of the Holocene (the Little Ice Age) for the last 400-500 years.
Kinnard et al, 2008, pieced together a reconstruction back to 1870…

Again, this lacks context and scale. Let’s plot it as a percentage of the Arctic Ocean surface area.

And now at the same scale as the NSIDC data.

According to the Kinnard reconstruction. The Arctic Ocean still has about half as much summer sea ice as it did at the end of Neoglacition, the maximum extent of Holocene glaciers and sea ice. Why is this a bad thing? Since 1870, Arctic sea ice has been retreating from this sort of climate “normal”…

But these disastrous polar expeditions were real.
Kinnard also featured a neat map:

Ok… So the minimum summer sea ice covered about twice as much area for 90% of the past 150 years… So what? Is 150 years a long time? Is it relevant to the Holocene Epoch? Is it one of the “Goldilocks conditions” of the Holocene? We clearly need more context and scale.
Back to the Anthropocene!
Stein et al., 2017 (H/T tty) provides a great description of a rather novel method of determining paleo sea ice extent.
In a pioneering study by Belt et al. (2007), the ability to (semi-)quantitatively reconstruct paleo-sea ice distributions has been significantly improved by a biomarker approach based on determination of a highly branched isoprenoid (HBI) with 25 carbons (C25 HBI monoene = IP25). This biomarker is only biosynthesized by specific diatoms living within the Arctic sea ice (Brown et al., 2014) and appears to be a specific, sensitive and stable proxy for Arctic sea ice in sedimentary sections representing Late Miocene to Recent times (Stein et al., 2012, 2016; Belt and Müller, 2013; Stein and Fahl, 2013; Knies et al., 2014). The presence of IP25 in the studied sediments is direct evidence for the presence of sea ice.
[…]
For more semi-quantitative estimates of present and past sea ice coverage, M€uller et al. (2011) combined the sea-ice proxy IP25 and phytoplankton biomarkers in a phytoplankton- IP25 index, the so-called ‘PIP25 index’:
PIP25 = [IP25]/([IP25] + ([phytoplankton marker] x c))
with c is the mean IP25 concentration/mean phytoplankton biomarker concentration for a specific data set or core.
[…]
Stein et al., 2017
This schematic diagram from Belt et al., 2013 relates the PIP25 index to sea ice conditions:

Generally speaking, the PIP25 index correlates to sea ice extent as follows:
- >0.7 = Extended, perennial (year-round) ice cover
- 0.5-0.7 = Seasonal ice cover/ice edge situation
- 0.1-0.3 = Reduced ice cover
- <0.1 = Ice-free year-round
Here’s an example from the Chukchi Sea:

Note that the sea ice at this location has only been seasonal since about 1,600 years ago. It was much lower than it is today for about 85% of the Holocene.
Stein et al. 2017, constructed a cross-section of PIP25 curves across the Arctic from the Fram Strait to the Chukchi Sea.

All four core locations currently reflect seasonal ice cover/ice edge situations (PIP25 index 0.5-0.7), with the Fram Strait being an ice edge situation and the other three reflecting seasonal ice cover.

Two key takeaways:
- Maximum Holocene sea ice extent occurred within the past 500-1,000 years at every location.
- The current sea ice extent is higher at all of the locations than over 50% to 85% of the Holocene.
When I plot the cross-section on Kinnard’s probability map, we can see that the entire area of low ice extent larger than present day, has been seasonal throughout most of the Holocene.

A significant reduction in Arctic summer sea ice relative to today, would be returning to Early Holocene conditions. If we currently have an “Anthropocene in the Arctic,” it’s actually icier than most of the Holocene’s “Goldilocks conditions.”
There’s nothing to see here, move along
According to the IPCC, summer sea ice will vanish by 2070 under RCP8.5 or muddle along under RCP2.6.

The temperature data point to muddling along…


References
Belt S.T., Müller J. “The Arctic sea ice biomarker IP25: A review of current understanding, recommendations for future research and applications in palaeo sea ice reconstructions”. (2013) Quaternary Science Reviews, 79 , pp. 9-25. Belt_2013
Fetterer, F., K. Knowles, W. N. Meier, M. Savoie, and A. K. Windnagel. 2017, updated daily. Sea Ice Index, Version 3. [Sea Ice Monthly By Year]. Boulder, Colorado USA. NSIDC: National Snow and Ice Data Center. doi: https://doi.org/10.7265/N5K072F8. [Accessed October 16, 2019].
Kinnard, C., Zdanowicz,C.M., Koerner,R .,Fisher,D.A., 2008. “A changing Arctic seasonal ice zone–observations from 1870–2003 and possible oceanographic consequences”. 35, L02507. Kinnard_2008
Stein, R. , Fahl, K. , Schade, I. , Manerung, A. , Wassmuth, S. , Niessen, F. and Nam, S. (2017), Holocene variability in sea ice cover, primary production, and Pacific‐Water inflow and climate change in the Chukchi and East Siberian Seas (Arctic Ocean). J. Quaternary Sci., 32: 362-379. doi:10.1002/jqs.2929 stein2017
The relationship between Sept sea ice extent and global warming
https://tambonthongchai.com/2019/09/28/sea-ice-extent-area-1979-2018/
Relevant geological features of the Arctic
https://tambonthongchai.com/2019/07/01/arctic/
https://tambonthongchai.com/2019/10/04/svalbard/
Dr. Sereeze mentioned a couple of times is not the director of NSIDC, Dr. Serreze is.
Clearly sea-ice is not going to help them with the Anthropocene concept.
And I think it is a mistake to pretend that the Pleistocene has ended just because we name this interglacial, one of many. The mistake was made before we understood the nature of the Pleistocene glacial cycle. Perhaps the Holocene should be demoted like
planetPluto.Getting rid of the Holocene would really destroy the argument for an Anthropocene.
1. D’oh! Will fix.
2. The only significant difference between the Holocene and prior Late Pleistocene interglacial stages is humans eating all of the megafauna.
3. I agree that the Holocene should be demoted, but it’s less likely to be demoted than the Anthropocene being accepted.
Our experiences are all different; mapping rocks in NW BC and SW Yukon can lead to far different opinions of whether the Pleistocene has ended or not than mapping in Texas. I remember being taught the Holocene too, then I found myself way up the Llewellyn Glacier, seeing nothing but ice from horizon to horizon (including fantastic mirages, btw) and thinking ‘Whad’y’a mean the Pleistocene is over–I’m standing on it!’ It’s melted back from its maximum, but it certainly has not all melted.
So I agree with you guys, and disagree with all the academics; The Pleistocene Is Not Over, we’re still in it and it’s an unstable condition for this planet, it will change.
And what any ‘How-dare-you-not-keep-it-constant’ Greta Goldilocks thinks is optimum just could not be more irrelevant.
So what is the scientific justification for misleading the eye with the linear fit in figure one?
Take away the straight line which forces the eye to see evidence of a constant and continuing decline and you see that sea ice is still at the same level it was in 2007 when all the screaming and crying and weeping for polar bears started.
There is no physics based reason to fit a linear model to that data and no justification to use that slope to suggest the same line will continue into the near and distant future.
One thing that graph does show is that the idea of “run away melting” was wrong. Up to 2007 it could be suggested from the limited record, but postitive feedbacks or tippings points, once engaged to not back off and result in no net change over a decade.
I don’t think the purpose of the trend line is to deceive. It’s simply to demonstrate the trend, to the extent there is one.
The “physics” basis is that CO2 is a greenhouse gas, the atmospheric concentration of CO2 is steadily increasing, and it is causing the bulk temperature of the atmosphere to very slowly rise. This, coupled with the fact that Earth is still warming up from the Little Ice Age means that Arctic sea ice should be slowly decreasing over time. The observations tell us that the climate sensitivity to CO2 is relatively low (TCR <1.3 °C per doubling).
The physics don't support a linear trend line. The physics more support an exponential trend line because the rate of melting should slow down as the summer ice edge moves northward.
That said, the math supports a linear (R2>=0.78) a little better than an exponential trend line (R2>=0.75). However, it’s more appropriate to simply show how the ice is currently behaving relative to natural variability, as I did in this post.
I thought CO2 followed, not led, temperature increase. Am I wrong?
It mostly follows.
David- I think sea ice is much like temperature. The data has a lot of built in trend- one year is very likely to tend to follow the previous year(s). That makes data that has not been de-trended pretty much useless as a graph.
A trend line on biased data is simply wrong, statistically. Seen by the many articles that show trends in temps, etc. that are meaningless due to picking opportune start and end points.
Yes, but…
Arctic sea ice is at lowest for date in recent history… after ending the melt season at second lowest in recent history… with record low volume, 3rd lowest area, less old sea ice than ever…
clearly the sea ice has not ‘recovered’ and clearly this is not just the low point in a natural cycle. It is a continuing decline.
so, why is the arctic sea ice still at such low levels right now? with lower maxima? Late refreeze?
It looks like a structural change may be happening in the Barents and Bering too…
(I would also point out that in the early Holocene orbital inclination produced much more insolation on the summer ice, causing lower sea ice levels -something not in play today)
If we are not careful, the Arctic might become habitable.
Yeah and the Russians will be in like a shot drilling for oil and gas to sell to the chinese
Recent history is what ? The USN took photos of the non ice in March 193?. No ice in march at the North Pole. That recent history? Or 1979 at the end of the 1950 to 75 cold PDO ? or the AMO ?
“No ice picture” at Norhtpole in March? In the 193something?
Tell me which Internet-HOAX victimized ou on that?
You made my day.
The United States Navy.
The North Pole may not have been totally ice free in 1962, but there clearly was a lot of open water…
SSN 578 Skate
SSN 584 Seadragon in background…
This is what a submarine (SSN 638 Whale, 1969) looks like when it breaks through ice…
SSN 578 Skate in 1959…
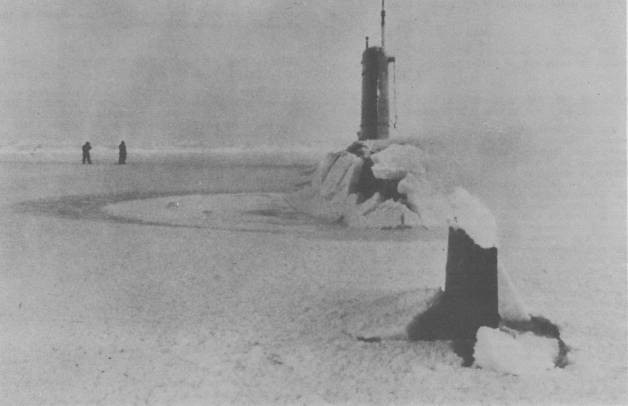
Clearly, in 1962, neither Skate nor Seadragon had to break through ice.
That isn’t the Skate surfacing at the pole in 1959.
Then the Navy made a mistake…

Dear David,
The information below the picture is correct. But it does not state that the picture you see is the surfacing in March 59.
The caption is written in English…
Unless the US Navy is wrong, Skate surfaced through the ice, at the North Pole on St. Patrick’s Day 1959, during the month when the ice should have been at its thickest.
The photos from 1962 don’t mention the month. They are probably from summer months.
Read the report of the commander of the Skate:
https://books.google.co.uk/books?id=YEgEAAAAMBAJ&pg=PA130#v=onepage&q&f=true
David Middleton October 18, 2019 at 1:48 pm
Then the Navy made a mistake…
Yes they did, that photo shows an earlier surfacing over two days cruise south of the Pole when they left some crewmen on the ice to film the Skate surfacing through the ice . The Skate surfaced at the Pole in darkness in March 1959.
Actually they did, according to the commander of the Skate they both searched for a lead in the vicinity of the Pole but were unable to find one.
By the way here’s an image from the Skate’s first surfacing at the pole in 59.
https://tinyurl.com/y6orrvek
The photos from 1962 don’t mention the month. They are probably from summer months.
23rd August 1962
How much sea ice is the “Goldilocks” extent?
The current ice conditions at the four core locations are lower than the Holocene maxima; however they are equivalent to PIP25 indices between 0.5 and 0.7, the Fram Strait is probably close to 0.7. This is well-above the Holocene minima that occurred during the Early Holocene insulation maxima…
If human activities have retarded the climatic decline into the next glacial cycle (doubtful), it would actually be a very good thing.
It really is amazing how griff actually believes he’s saying something intelligent.
David demonstrates what is wrong with using 1979 as the starting point for measuring sea ice, then griff pipes in with how sea ice is lowest in recent decades.
If griff didn’t exist, we’d have to invent him.
That sea ice has declined since the coldest period since the Little Ice Age is nothing that needs explaining.
When the earth’s temperature warms up by 3C and gets back to the average of the last 10,000 years, give me a call.
Great story-telling with science, David! For sure Chris Wilson has confused Archaeology and Geology, and he should be remanded to beginner classes for each. I really like the Gladys Knight charts, they clearly show a decline of natural origins underway and Arctic sea ice coverage may only recover completely at the onset of the next Glacial cycle of our current Ice Age. Keep Fracking!
Slaps self on forehead! I had to Google “Gladys Knight charts” before I got the joke… Pips!
Sorry, David, but I would have thought you would be an expert on what part of Gladys Knight were “her Pips!”.
That’s why I slapped myself on the forehead! LOL!
From Stein et al 2017:
The main factors controlling the millennial variability in sea ice and surface-water productivity are probably changes in surface water and heat flow from the Pacific into the Arctic Ocean as well as the long-term decrease in summer insolation, whereas short-term centennial variabil- ity observed in the high-resolution middle Holocene record was possibly triggered by solar forcing.
I suppose the present decline in Arctic sea ice area is an aspect of that short-term variability, probably enhanced by human activities. This decline has negative feedbacks. The Arctic can radiate more energy to space. Also the annual amplitude of sea ice area (and volume) increases, as September area decreases more than March area. This implies that the forming of cold arctic bottom water increases and eventually cools the oceans. Maybe the Arctic has a short term cycle of its own.
I’d agree it produces negative feedback — certainly very cold, land-produced air mixing w/humid air off the open ocean produces more high-albedo snow in surrounding land than otherwise. Just a much larger example of “lake-effect” snow on the NA Great Lakes. Alot of snow right now in adjacent Arctic lands:
http://www.natice.noaa.gov/pub/ims/ims_gif/DATA/cursnow_asiaeurope.gif
Mark Serreze was put in place by the same Al Gore cabal that marginalized Bill Gray and denied him funding. Mark continues to get awards and funding for pushing a narrative while ignoring other information, despite the fact it’s been a decade since he announced “the arctic is screaming”, without sea-ice in fact decreasing.
Serreze tends to overlook all evidence of low sea-ice levels in the past. Thanks for including the information about “biomarkers” indicating much less ice in the early Holocene. There is also good work by geologists indicating sea-levels were a bit higher then. I noticed such work went unfunded and unpublished, and even was to some degree “disappeared”, under the last president’s 8 year reign-of-error.
I tend to distrust reconstructions, because they take the scanty evidence of where the sea-ice lay, and fill in all areas behind that “edge” with solid sea-ice, when even the early Nimbus satellite images show “holes” in the sea-ice behind the “edge”.
All you need to is poke through fascinating the history of whalers and explorers in the arctic, and there is plenty of evidence for swings in the extent of sea-ice. For example, not only was there the phenomenon of the practically-open Arctic Ocean of 1817, due to sea-ice being shifted from north of Fram Strait down into the Atlantic to a degree where it grounded icebergs on the coast of Ireland, but there apparently were low amounts in the Northwest Passage as well: In 1819 William Parry was able to sail further west in the channel that now bears his name than was possible for many years afterwards (and was impossible to do last summer.) Then, only 25 years later, there was the tragedy of the Franklin expedition getting trapped in the same waters. And there are other examples of swings. Barentzs rounded the northwest tip of Svalbard and landed on the north coast in June of 1597, which would have been impossible to do last June.
Hopefully now that the reign-of-error is over we can start to drain the swamp of too much politics polluting arctic research. Hopefully the 2017 study by Stein of biomarkers is a sign of good things to come.
“Serreze tends to overlook all evidence of low sea-ice levels in the past.”
Yeah, it looks like sea ice levels were about the same as today back in the warm 1930’s. Then, the weather cooled off for several decades down through the 1970’s, and sea ice increased during that period, and then the weather warmed from 1980 to the present, to about the same level of warmth as experienced in the 1930’s, and the arctic sea ice is at a similar level. CO2 was not a significant factor in the 1930’s, yet the arctic sea ice levels are similar to today. Perhaps this means CO2 is not a significant factor today, either.
I’ve never been able to locate Vinnikov et al., 1980. He does use that image in this 2012 lecture motes handout…
https://www.atmos.umd.edu/~kostya/Sclim/Reports/lecture_April_19_2012.pdf
The pre-satellite period is clearly not very accurately quantified.
I like that temperature chart Vinnikov uses in the link showing the warmth of the 1930’s.
The 1930’s warmth just pops up everywhere. Then along came the CAGW industry to erase it.
I’d like to see a return of trees and beavers to Ellesmere Island.
Ellesmere Island is the most northerly Island in Canada.
Hippos coming back to the Thames would be interesting.
I’m confused about several things.
1 – Why do people have to NAME things they don’t really understand and can’t control?
2 – Why do they not take the Gakkel Ridge formation (which is volcanically active, and slow spreading) into account when they put this stuff together?
3 – Why aren’t they including solar output in their conclusions?
4 – Are these questions too hard?
Shhhh! You’re not supposed to ask those questions….
Oh, but Chaswarnertoo, they must be asked!!
I had others, but I kept laughing so hard that I startled the cat.
If you graph data and then fit a straight line, you’re inviting the reader to extrapolate. A curved line might provide a more accurate idea of what’s going on.
The minimum sea ice extent looks like it’s bottomed out. link The straight trend line is misleading.
commieBob said:
“fit a straight line, you’re inviting the reader to extrapolate. A curved line might provide a more accurate idea”
Yes, Yes, YES!!!!
I can fit a curved line, I can fit a *very* curved line. I can fit a higher order polynomial.
{As some of you may know, the higher order polynomials fly off wildly, shooting up to outer space, or plummeting to the center of the Earth. It’s a Feature, not a Bug.}
All you have to do is gently adjust and correct the data like NASA GISS does. Then you can make graphs proving 60 meters of Sea Level Rise, or 20 degrees of temperature rise by 2100. You can make the oceans boil, or freeze into a Snowball Earth, even at the same time, if you want.
And the best part of it is:
You do not have to use any shady data handling techniques not already in widespread use in the Climate Science community.
(As a side note, about 5 years ago WUWT ran a few quick stories about the R programming language, with the author encouraging interested users to take a look. I did so, and found that the R language is the language of Statistics and has excellent Graphics capabilities. Plotting climate data is so easy, I have been making great and scary plots I would never have wasted my time with otherwise. Without the good tip from WUWT, I would never have discovered this powerful tool.
So Remember: When you see scary graphs from me showing disaster and the end of the world, know that it is All Your Fault!)
One worse than R is Matlab. It provides a plethora of statistical tools and it’s super simple to use. If you have a data set, plug it into Matlab. Then you try the tools singly, or in combination, until you find a result that looks interesting. No actual knowledge of statistics is required.
If there is an anthropocene, it started thousands of years ago when Europeans started burning down forests to make room for farmland.
But geologists require a clear marker in the geological record millions of years after the fact to identify periods of time. What is the marker for thousands of years ago? What is the marker for post WW2?
Yep. The Holocene is the Anthropocene.
That said, the Global Stratotype Section and Point (GSSP or “Golden Stake”) for the Holocene won’t last millions of years. It’s in the NGRIP ice core in Greenland.
http://www.stratigraphy.org/GSSP/Holocene.pdf
One more reason that the Holocene should not be classified as a formal epoch. While glacial ice technically is “rock”, the Holocene GSSP will be deformed out of existence, probably within 100,000 years.
There aren’t many sedimentary rocks that are only 60-70 years old. So an Anthropocene GSSP would have to be even more fake than the Anthropocene itself.
How about the natives burning prairies to herd wild animals for slaughter, it did not start with Europeans.
Artificial radio isotopes from nuclear weapons.
Which will all be gone within a few 100 thousand years, just like the Holocene GSSP.
“when Europeans started burning down forests to make room for farmland”
So forests destroyed to make room for farmland outside Europe doesn’t count?
Hint: farming did nor originate in Europe, it originated in SW Asia, China, New Guinea and Mexico.
Errr, yes, that’s the Holocene.
A post WW2 marker could be a rise in general radioactivity due to around 35 years of nuke testing.
Not quite as obvious as the K-T boundary [or more correctly the Mesozoic-Cenozoic boundary] and might not be measurable in a million or two years.
The Holocene itself is a bit iffy. Is it an interglacial or not ?
If it is just an interglacial much of the current discussion is inconsequential as glaciers will bulldoze everything away ready for the next interglacial.
Don’t get rid of your fur coats just in case.
(SNIPPED, you are banned) SUNMOD
Those reconstructions of the past Arctic Ice are Bull.
In the 1920s there were almost identical conditions to now.
There are many description by people who were actually there, not some computer model.
There’s a lot of anecdotal information to support the notion that the 1920’s to 1930’s were similar to today. Kinnard even acknowledges that the pre-1950 part of their reconstruction is not particularity reliable.
However, the sediment core reconstructions indicate that the ice was seasonal at those locations, like it is today. But it’s not possible to reconstruct seasonal ice extent from these data.
Talking about people who were actually there I suggest you read about Ada Blackjack. After the expedition’s arrival in 1922 Wrangel Island was inaccessible for two years due to impenetrable ice, that doesn’t happen these days. Also the Russian expedition that landed there in 1926 was cut off due to continuous heavy ice surrounding the island. A rescue expedition was run in 1929 using the icebreaker Fyodor Litke, the ship was trapped in ice for 2 weeks and was only able to make a few hundred meters per day and finally made the island on August 28th. Again nothing like that these days, currently surrounded by open ocean.
OTOH, by the 1930s and ‘40s, the Northern Sea Route was open, used by both the Red Navy and, remarkably, the Kriegsmarine.
He lost me at ‘declining population of polar bears.’ What evidence does he cite for that statement?
Wait, what? This article is a spoof, right? It’s The Onion, posing as Time to throw us off, right? Tell me that’s it. Because otherwise, we’ve crossed through the Twilight Zone headlong into the Idiot Zone.
Congratulations! You arranged dozens of words into four sentences without making a single point. Good for you, man!
He was referring to the Time magazine article I quoted.
Congratulations yourself. Moron.
“However, perhaps the most perplexing aspect of the Mississippi River delta ecosystem is the fact that there is little indication that fisheries productivity has decreased. ” This was in a 2014 publication by three otherwise good, experienced scientists. I examine, reading whole thing often too tedious and repetitious, lots of marine science papers, mostly biological, and the negativity is often rampant.
There has got to be the “Anthropocene” in there somewhere. Maybe they just never had any decent geology, but the delta is one of the most steadily active places. But you have to go there.
As to the 20s and 30s—Drinkwater, K. F. 2006. The regime shift of the 1920s and 30s in the North Atlantic. Journal of Marine Systems. 68(2-4):134-151.
Be sure to read this amusing take-down of the Anthropocene in the Atlantic magazine of all places.
Great stuff as always DM
https://www.theatlantic.com/science/archive/2019/08/arrogance-anthropocene/595795/
Good article. I wrote a post on it back in August…
https://wattsupwiththat.com/2019/08/14/a-science-journalist-nails-the-anthropocene/
There is more to the north than just ice.
I prefer trees.
Historical Aspects of the Northern Canadian Treeline HARVEY NICHOLS (late ’70s paper)
http://pubs.aina.ucalgary.ca/arctic/Arctic29-1-38.pdf
ABSTRACT From palynological studies it appears that northernmost dwarf spruces of the tundra and parts of the forest-tundra boundary may be relicts from times of prior warmth, and if felled might not regenerate. This disequilibrium may help explain the partial incongruence of modern climatic limits with the present forest edge. Seedlings established as a result of recent warming should therefore be found within the northernmost woodlands rather than in the southern tundra.
Amazing, claiming the death of an epoch without definitive geological proof the new epoch exists and the old epoch ended.
N.B.; the “Goldilocks conditions for human civilization” exists because of the warm interglacial.
Apparently the doofus claiming the death of the holocene believes it means the death of the “Goldilocks conditions”.
Let us hope, for mankind’s sake, the “Goldilocks conditions” continue!
It is obvious that anything that may seem problematic at first sight may seem harmless or even wishful when relativated within a greater context.
Nevertheless, all (American) people thinking that ‘the Globe is cooling’ just because Northern CONUS experienced weakening polar vortices and subsequent harsh cooling air masses, might focus on the graphs below, showing the daily absolute vales / departures from the 1981-2010 mean for Arctic sea ice extent in recent years (source: colorado.edu):
https://drive.google.com/file/d/1-rIi_Ml6yinPkUWPDFPz4VEy9BUX4fZL/view
The absolute values are uninteresting. What has interested me is this:
https://drive.google.com/file/d/19I6WWxw-xavC0H7K7tS_Ocef8BE2gzcs/view
We can better compare the different years when using anomalies.
There is no daily area (aka 100% pack ice) info visible at the source web site, but it actually doesn’t behave very different.
Well, to be honest: I hope that there is no correlation at all between the current Arctic ice situation and that prevailing in February over Southern Canada and Northern CONUS.
I don’t need to care that much: we experience mild winters since a few years here in Germany, and these are welcome!
Anthropocene is old stuff and matters no more.
The really important new “era” is of course “Gretaceous” \sarc
Never heard of Crater Lake –
https://www.google.com/search?q=Crater+Lake&client=ms-android-huawei&sourceid=chrome-mobile&ie=UTF-8&ctxs=2&ctxsl_trans=1&tlitetl=de&tlitetxt=Crater+Lake&authuser=1
TÜV Rheinland, TÜV Technical Inspection Association Certified.
gave allowance to macro plastic polluters for female+safety+bosom+supporters
https://www.google.com/search?q=micro-plastic+pollution&client=ms-android-huawei&sourceid=chrome-mobile&ie=UTF-8
https://www.make-it-in-germany.com/en/visa/local-contacts/states/rheinland-pfalz/
https://www.google.com/search?client=ms-android-huawei&sxsrf=ACYBGNSQdJ_m4etGPi-mzUeyZcZRtT4sAg%3A1572269492533&ei=tO22XZ2FIK-Ek74PyvGSSA&q=female+bosom+support+safety&oq=female+bosom+support+safety&gs_l=mobile-gws-wiz-serp.
That same TÜV Rheinland gave approval to
https://www.google.com/search?client=ms-android-huawei&biw=360&bih=518&sxsrf=ACYBGNT1BKbC9jXV9vJh1gd73il6VCTPrw%3A1572270433787&ei=YfG2XYXaL4eP6ASAxrLIBQ&q=tuev+rheinland+give+approval+brazil+dams&oq=tuev+rheinland+give+approvebrazil+dams&gs_l=mobile-gws-wiz-serp.