By Dave Burton, reposted from Sea Level Info
[Follow-up to https://wattsupwiththat.com/2019/09/01/cnn-vs-what-the-science-says/]
CNN’s war with the facts continues in this Monday article, by CNN Chief Climate Correspondent, Bill Weir:
https://www.cnn.com/2019/09/09/weather/alaska-climate-crisis-summer-weir-wxc/index.html
The gist of the article is that Alaska was too hot this summer. How ridiculous is that?
If we can’t even agree on something as obvious as the fact that Alaska is too darn cold, then is there any hope that we can ever agree on anything? It is a testament to the power of relentless propaganda that the Left has managed to convince even many shivering Alaskans and Canadians that a warmer climate above the 49th parallel would somehow be a bad thing.
I would not say that anthropogenic (manmade) global warming (AGW) is a myth. But the “climate crisis” is certainly a myth. In fact, the “climate problem” is a myth. Fear of AGW is based on confusion and superstition, not science.
There is convincing evidence that emissions of CO2 and other radiatively-active gases do have a warming effect. But there’s no convincing evidence that it’s at all harmful.
One of the nice things about “global” warming is that it isn’t really very global. Rather, thanks to “Arctic amplification,” and negative feedbacks that limit warming in the tropics, the warming is disproportionately in the far north, where it is a blessing.
As the great Svante Arrhenius wrote on p.63 of his book, Worlds in the Making (English, 1908) [or Världarnas utveckling (Swedish, 1906)], “By the influence of the increasing percentage of carbonic acid [CO2] in the atmosphere, we may hope to enjoy ages with more equable and better climates, especially as regards the colder regions of the earth, ages when the earth will bring forth much more abundant crops than at present, for the benefit of rapidly propagating mankind.”

The best evidence is that AGW is real, but modest and benign, and CO2 emissions and consequent rising CO2 levels are beneficial, rather than harmful. (Here’s a list of of good resources for people wanting to learn more about climate change.)
That CNN article is a mess. It’s the nature of weather that you can always find somewhere which is experiencing record something. So what? Unusually mild weather in Alaska is something to celebrate, not fear!
One especially blatant bit of misinformation in that CNN article is the part about ticks. The article says:
Historically, that blood-sucking bug would not survive the Alaskan climate. Not anymore. “It’s kind of like a Russian roulette,” she says. “Eventually, a tick is going to come and it’s going to be able to overwinter and then establish in our wildlife population up in Alaska.”
That’s utter nonsense. Never in American history has the southern Alaskan climate been too harsh for ticks and tick-borne diseases, no more than California’s climate is too harsh for medflies. The danger posed by those pests has nothing to do with climate change, and everything to do with people carelessly importing the pests.
Lyme is not a tropical disease. It was first discovered in chilly Lyme, Connecticut. (Likewise, Rocky Mountain Spotted Fever was first discovered in chilly Idaho.)
Here’s a map of Lyme risk in the lower-48 States (red is worst):
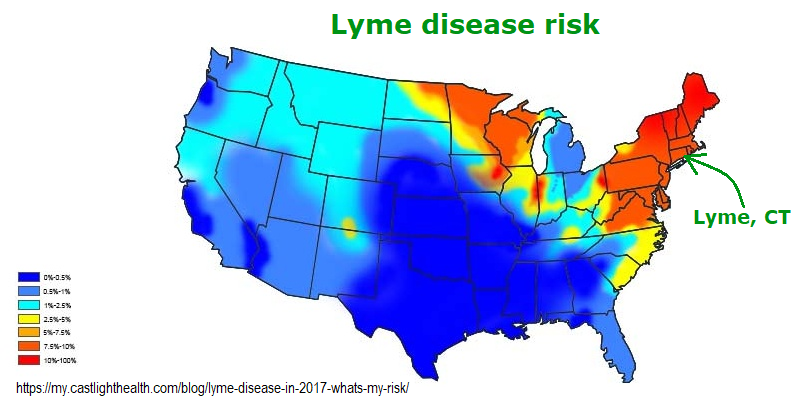
As you can see, even Maine and northern Minnesota are not too cold for the deer ticks that carry Lyme disease.
Here are the climate norms for Anchorage, AK vs. a town in central Maine (where ticks carrying Lyme disease are endemic):
Anchorage, AK Dover-Foxcroft, ME
Month High / Low(°F) Precip High / Low(°F) Precip
January 23° / 14° 4 days 24° / 3° 8 days
February 27° / 17° 4 days 28° / 5° 7 days
March 31° / 20° 3 days 37° / 16° 8 days
April 43° / 32° 2 days 50° / 28° 9 days
May 53° / 42° 3 days 64° / 40° 10 days
June 59° / 51° 4 days 73° / 49° 11 days
July 62° / 55° 7 days 78° / 55° 10 days
August 61° / 53° 10 days 77° / 53° 9 days
September 55° / 46° 10 days 69° / 44° 8 days
October 43° / 34° 8 days 55° / 34° 9 days
November 28° / 19° 5 days 42° / 25° 9 days
December 25° / 17° 5 days 30° / 12° 10 days
Notice how much colder the winter nights are in central Maine.
But CNN would have you believe that Alaska used to be too cold for ticks. It is complete poppycock.
Dave
Elsewhere accused me of being stuck with 70’s science, out of date & touch.
Arrhenius proposed the RGHE in 1896. Spencer Weart noted that Savante’s contemporaries considered him full of baloney back then. In 1909 R. W. Wood debunked RGHE through experimentation. Classical science back when it had some semblance of integrity.
RGHE is over 120 years old. How current is that?
Now for something completely contemporaneous: the UCLA Diviner mission.
Point the First
UCLA considers 71.6 F to be the earth’s “average” temperature, about 22 C. That doesn’t mesh w/ IPCC’s & WMO’s 15 C or Trenberth/NOAA’s 16 C. So much for scientific consensus. How does anybody know whether the earth’s “average” temperature is going up or down when they can’t even agree on what it is?
Point the Twoth
Per UCLA the moon is blazing hot on the lit side and bitter cold on the dark, the 2nd most extreme variation in the solar system, because it has not an insulating atmosphere like the earth.
Hmmmm.
The extremely obvious corollary is that without the atmosphere the earth would be much like the moon (Nikolov & Kramm knew it, wouldn’t say it.) that is: blistering hot on the lit side and bitter cold on the dark, a total contradiction and refutation of RGHE that postulates exactly the opposite.
The 30% reflective albedo created and sustained by the atmosphere cools the earth compared to no atmosphere.
The atmosphere’s insulating properties, i.e. thermal resistance, is how come the surface is warmer than the ToA just like a house.
And RGHE/man caused climate change/global warming goes kerbluey!
The 672 hour day on the Moon has a lot more to do with its extremes. If Earth had a 672 hour day, the maximum daytime temperatures would be much hotter and nights would be much colder, yet if the albedo was the same, the average temperature would be the same as it is now, as long as the average temperature is considered to be the equivalent SB temperature corresponding to the average emissions of the surface.
BTW, since temperature is an abstraction of stored energy and the consequential emissions of that stored energy, the ONLY average temperature that has any relevance is the equivalent Stefan-Boltzmann temperature of the average NET emissions of the surface. The NET emissions of the surface are limited to the SB emissions corresponding to its temperature since anything else (latent heat, thermals), plus the return of that energy to the surface is already accounted for by the temperature and its corresponding emissions.
Too bad it’s not too cold for mosquitos in Alaska. Those things are bad there.
Agreed, that the moon’s very long days and nights are a major reason for its temperature extremes. (A nit: day+night = 708.73 hours, not 672, on the moon.)
That’s also one of the reasons that the Moon’s average temperature is much colder than the Earth’s, even though the Moon’s average distance from the Sun is identical to Earth’s, and the Moon’s average albedo is lower than Earth’s. Since radiative cooling increases with the 4th power of absolute temperature, the hot side of the moon loses heat disproportionately faster than the cold side, resulting in a lower average temperature.
The other reason that the Moon’s average temperature is colder than the Earth’s is the only reason most climate alarmists are aware of. It is because of how GHG’s in the Earth’s atmosphere affect its “color” (in the far IR, rather than visible).
Albedo is commonly given as a single number, as if the percentages of incoming solar radiation reflected & absorbed had nothing to do with its wavelengths. In other words, a single-number albedo figure approximates the Earth as a graybody. But that’s a very/i> rough approximation.
In reality, what happens both incoming and outgoing radiation varies considerably with wavelength. The Earth’s surface is not gray, and its atmosphere is even less so.
The Earth’s atmosphere is relatively transparent to some wavelengths, and thoroughly opaque to others. The ground is “grayer” than the air, but its color also varies. (That’s how satellites can measure the “greening” of the Earth, because its color is slightly changing.)
GHGs cause warming of the atmosphere because they increase atmospheric absorption of outgoing radiation, while having little effect on most incoming radiation. That atmosphere, in turn, warms the surface, by several mechanisms, including IR “back radiation.”
That different effects of GHGs on incoming and outgoing radiation are possible because incoming and outgoing radiation have very different spectra. Most incoming radiation is near IR, visible, or shorter. Most outgoing radiation is far IR or longer wavelengths.
Dave,
The day length has nothing to do with the average temperature and only effects the difference between the min and max. The average temperature is less than Earth because there’s no clouds or GHG’s to absorb surface emissions and redirect them back to the surface. The Moon’s average temperature is independent of its day length because it always receives the same rate of solar energy, the same average rate of emissions is required to offset the solar energy and the only proper average temperature is the SB equivalent of the average rate of emissions.
Note that if you geometrically average T, rather than T^4 (or emissions), a colder average temperature will emerge, but that temperature is not at all representative of the actual average emissions temperature which is all that matters relative to its radiant balance.
“The Earth’s surface is not gray, and its atmosphere is even less so.”
The Earth’s surface is nearly an ideal BB and the atmosphere is definitely a gray body and when a gray body is put between a black body and the environment, the net result is also a gray body.
In fact, it’s grayness that warms the surface above and beyond what the Sun can do on its own. Grayness is the attenuation of the emissions due to the surface temperature and the emissions ultimately exiting into space. Atmospheric absorption is what manifests grayness and some (about half) of what the atmosphere absorbed from the surface is returned back to the surface providing addition input energy that can only be offset by increasing the emission temperature of the surface.
co2isnotevil wrote, “Note that if you geometrically average T, rather than T^4 (or emissions), a colder average temperature will emerge,…”
I don’t believe I’ve ever seen anyone calculate an “average temperature” over multiple locations (or even for the whole Earth) by first averaging T^4 and then calculating the “average T” from the average T^4. Who does that??
Hmmm… I suppose that could account for the large variation in “average” temperatures which Nick Schroeder noted above. Does UCLA do that?
co2isnotevil continued, ” but that temperature is not at all representative of the actual average emissions temperature which is all that matters relative to its radiant balance.”
That depends on where you measure it. I would agree for TOA.
But the T^4 rule only applies to radiative emissions, and that’s now how most of the heat is removed from the Earth’s surface.
I think convective heat transfer is very roughly proportional the temperature difference between surface and air.
I don’t know what the rule is for evaporative cooling as a function of temperature. I think it is greater than linear but I don’t know how much greater. Do you?
co2isnotevil followed up, saying, “The Earth’s surface is nearly an ideal BB and the atmosphere is definitely a gray body…”
A BB has no color. The Earth’s surface is quite colorful. A BB reflects no light. The Earth’s surface reflects quite a lot.
A graybody absorbs every wavelength to an equal extent. The Earth’s atmosphere is nothing like that. It is completely opaque to some wavelengths, and nearly transparent to others.
co2isnotevil continued, “In fact, it’s grayness that warms the surface above and beyond what the Sun can do on its own. Grayness is the attenuation of the emissions…”
You’re using a different definition of “grayness” than I’m using. I guess it depends on the context: If you’re talking about the extent to which absorptivity percentage differs from a blackbody then your definition makes sense.
But I’m using it in comparison to something which has “color” (variation in absorptivity with wavelength). In that context, “grayness” means absence of color. “Gray” means that all wavelengths are absorbed to an equal extent. In that context, the atmosphere is nothing like a graybody.
Dave,
“Who does that??”
Anyone who has analyzed satellite data where W/m^2 are geometrically averaged as the sensors on weather satellites respond approximately linearly to W/m^2 of incident power.
If you have 2 identical masses of the same material at different temperatures and uniformly mix them without adding or removing any energy, the resulting temperature will be the average of the two. However; if you have a body radiating at 2 different temperature, its equivalent radiant temperature is the single temperature that body would need to be at in order to emit the same amount of energy. This will be the equivalent temperature of the average emissions which is also equivalent to the fourth root of the average T^4.
“But the T^4 rule only applies to radiative emissions, and that’s now how most of the heat is removed from the Earth’s surface.”
The effects from all non radiative emissions (latent heat, thermals, etc) plus the return of that energy to the surface are already fully accounted for by the steady state average temperature and its radiant emissions. What effect do you think these non radiant sources of heat entering the atmosphere, plus the offsetting energy returned to the surface has on the steady state average temperature and its corresponding emissions, other than the effect they are already having?
This red herring was added by Trenberth back in AR1 and has definitely confused many on both sides.
Don’t be a racist /sarc.
Grayness has nothing to do with color and is quantified by a dimensionless emissivity between 0 and 1 that linearly scales the black body emission power of a radiator at some temperature. This attenuation can be uniform across all wavelengths or limited to specific wavelengths, moreover; the SB relationship between W/m^2 and equivalent temperature is independent of the spectral character of the W/m^2 being emitted. Even the emissions of a laser has an equivalent temperature based on the W/m^2 delivered to a target and SB is used to calculate that temperature.
Dave,
“… rule is for evaporative cooling …”
About 390 W/m^2 leaves the surface as transported by photons and about 100 W/m^2 leaves as transported by matter in the form of latent heat and convection, so about 80% of the energy that leaves the surface is transported by photons and 20% is transported by matter. Keep in mind that only the energy transported by photons can leave the planet and only the photon energy absorbed by GHG’s and clouds is split evenly going into space and returned to the surface, while any energy transported into the atmosphere by matter can only be returned to the surface by matter, since matter can not ordinarily leave the planet. To the extent that energy that was latent heat is radiated away from condensed atmospheric water, that water is also absorbing energy as photons and in the steady state, must be absorbing the same as its emitting.
Sigh. This was a typo:
“…and that’s now how most of the heat is removed from the Earth’s surface…”
I meant to type:
“…and that’s not how most of the heat is removed from the Earth’s surface…”
Sorry about that.
I wrote, “Who does that??” (calculate average temperatures by averaging T^4) … “Does UCLA do that?”
co2isnotevil replied, “Anyone who has analyzed satellite data where…”
I meant specifically who. E.g., Nick Schroeder wrote above, “UCLA considers 71.6 F to be the earth’s “average” temperature, about 22 C. That doesn’t mesh w/ IPCC’s & WMO’s 15 C or Trenberth/NOAA’s 16 C.” Do any of those organizations calculate an “average” temperature for the Earth by averaging T^4 and then taking the 4th root?
I don’t think so. But I could be wrong.
co2isnotevil wrote, “What effect do you think these non radiant sources of heat entering the atmosphere, plus the offsetting energy returned to the surface has on the steady state average temperature and its corresponding emissions, other than the effect they are already having?”
It’s an enormous effect.
The water cycle is a classic phase-change refrigeration cycle, just like the Freon refrigeration cycle in your refrigerator: Water evaporates at the surface, absorbing latent “Heat Of Evaporation” (evaporative heat loss). Because the molecular weight of water vapor molecules is just 18 (compared to 28 for nitrogen), water vapor is a lifting gas, and moist air is lighter than dry air (contrary to intuition). So the moist air rises to the mid-troposphere, where the water condenses into clouds, releasing the latent heat which it had absorbed at the surface.
That process is the most important way in which heat is removed from surface of the Earth.
co2isnotevil wrote, “Don’t be a racist /sarc.”
Haha! 😀
co2isnotevil continued, “Grayness has nothing to do with color…”
That seems to be a minority opinion. I googled it and the first definition I found was, “A grey body is defined as a body with constant emissivity over all wavelengths and temperatures.” A looked at a few more definitions, and they were all similar to that.
co2isnotevile wrote, “About 390 W/m^2 leaves the surface as transported by photons and about 100 W/m^2 leaves as transported by matter in the form of latent heat and convection,…”
That can’t be right. Where did you hear that?
When engineering electronic systems for use in zero-G, you either need forced air or else drastically larger heat sink radiators, because of the absence of convective cooling. I think radiative cooling accounts for only a small part of the cooling from a finned heat sink.
Likewise, if 80% of the cooling was radiative, then greenhouses made from plastic sheeting would hardly get warm at all, because they work by blocking convective heat loss.
Hmmm… googling… well, this NASA page claims that, on average, 48% of net solar radiation is absorbed at the Earth’s surface, and of that 48, 25 is lost through evaporative cooling, 5 is lost though convective cooling, and 17 is lost through net radiative cooling. (That adds to 47, not 48 — must be rounding error.) 17/(25+5+17) = 36% of the cooling is radiative (not 80%).
That “convective” number is lower than I expected. I wonder if it’s right?
Dave,
“It’s an enormous effect.”
Think of the temperature as the state. Whatever effect non radiant power leaving the surface and then returning has on the surface temperature is already manifested by the steady state average temperature. You’re trying to count it twice. First as its affect that’s already accounted for by the average temperature and its corresponding emissions and then you’re trying to say that there are other effects that have not manifested themselves that still need to be accounted for. What are the additional effects on the temperature and emissions that you think non radiant energy entering and leaving the atmosphere has, that’s not already accounted for by the steady state surface temperature and its corresponding emissions?
“A grey body is defined as a body with constant emissivity over all wavelengths and temperatures.”
The ‘all wavelengths’ qualification is highly misleading. A thermometer registering the temperature is responding to W/m^2 independent of its wavelength. Whether the W/m^2 are at one wavelength, in the form of an ideal Planck distribution or are arbitrarily spread across random wavelengths, the thermometer will read the same temperature as long as the total W/m^2 are the same and that measured temperature will be proportional to the fourth root of the W/m^2 per the SB LAW and I emphasize that it’s a LAW of physics which is an exceptionally high bar to meet. Feel free to identify any other law of physics that supports your position, but I guarantee you will fail as no such physical law exists.
If you pay careful attention to my words, I always qualify the model as an EQUIVALENT gray body model, that is, the equivalent ideal gray body whose bulk radiant behavior is indistinguishable from the radiant behavior measured for the planet. moreover; what I’m concerned about is the bulk RADIANT balance and bulk sensitivity, whose analysis only cares about the Joules and not the wavelengths of the energy arriving or leaving the planet. One Joule represents the same amount of work, independent of its wavelength.
You’re blinded by complexity that either has no effect on the analysis or has an effect that’s already accounted for. I can’t really blame you, as your misconception is a consequence of how the IPCC has completely bungled the science, This has led to so much bad science that unfortunately, too much of which has been canonized as ‘settled’ since AR1.
Best practices modeling relies almost exclusive on equivalent modeling, yet this most basic modeling concept seems to be far over the heads of so many. An equivalent model is an idealized model whose macroscopic behavior is indistinguishable from the more complex system being modeled and whether you know it or not, all GCM’s are also equivalent models. If the macroscopic behavior of a system can be observed, then validating the equivalent model is trivial. Such is the case with the climate system and there can no question whatsoever that the bulk behavior of the planet doesn’t conform to the results of any GCM (except perhaps the Russian one) moreover; the MEASURED behavior is indistinguishable from that of a gray body whose emissivity is 0.62, as unambiguously shown in this plot:
http://www.palisad.com/co2/tp/fig1.png
The green line represents the idealized gray body model with an emissivity of 0.62. You can’t deny that even the monthly data (the 25K small red dots) rapidly converges to a behavior that’s indistinguishable from a gray body. The longer term averages are represented by the larger green and blue dots, specific to the slices in each hemisphere. What is it about this data that eludes you? Furthermore; the exceptionally odd behavior of clouds that leads to the mostly constant EQUIVALENT emissivity from pole to pole can only be explained if constant grayness (constant emissivity or constant absorption) is a goal driving convergence of the system.
I would be very skeptical of anything NASA claims related to climate science, especially if it’s originating from GISS. You should also be very skeptical of anything Wikipedia says about climate science, as there are demonstrable biases driving it as well. Much of the damage William Connolly (a UK green party activist) did is still there.
Under Hansen, widely regarded as the godfather of climate alarmism, GISS moved from supporting science conforming to the scientific method to supporting science conforming to a political narrative. This corruption of climate science has continued and expanded under Schmidt who as Hansen’s chief propagandist was hand picked by Hansen to succeed him.
BTW, convection can not cool the planet as only radiant energy can leave the planet. Relative to the surface, all convection can do is move existing energy around. To the extent that it cools in one place it will necessarily warm in another. Net warming and cooling can only occur when new energy arrives at the planet or when energy is emitted from the planet.
co2isnotevil wrote, “Whatever effect non radiant power leaving the surface and then returning has on the surface temperature is already manifested by the steady state average temperature. You’re trying to count it twice.”
No, I’m not. Evaporative & convective cooling really do cool the Earth’s surface, by transporting heat away from the surface. That warms the atmosphere, which increases the rate at which the atmosphere radiates to outer space.
I quoted a definition saying, “A grey body is defined as a body with constant emissivity over all wavelengths and temperatures.”
co2isnotevil replied, “The ‘all wavelengths’ qualification is highly misleading. A thermometer registering the temperature is responding to W/m^2 independent of its wavelength.”
I don’t know what the way a thermometer works has to do with the definition of a gray body, but no thermometer works that way.
Most thermometers work by convective temperature equalization with their surroundings, which causes thermal expansion of a material (moving a gauge), or which changes some other measurable property of the probe.
IR thermometers work by measuring the spectral distribution of emitted infrared light. I have one that I keep on my microwave oven, for measuring the temperature of reheated coffee.
A thermometer which attempted to measure temperature by measuring “total W/m^2” would be extremely limited, because the temperature it measured would vary dramatically with its distance from the emitting object. You’d need to combine the intensity measurement with some sort of range measurement, to try to calculate a temperature estimate. It wouldn’t work very well.
co2isnotevil continued, “If the macroscopic behavior of a system can be observed, then validating the equivalent model is trivial…”
Only if you can wait long enough.
When a model is making predictions thirty or fifty years into the future, by which time it will be long since obsolete and disused, it is effectively unverifiable. That’s one of the key problems with GCMs.
The utility and skillfulness of models is dependent on two or three tests (depending on how you count):
1(a). How well the processes which they model are understood,
1(b). How faithfully those processes are simulated in the computer code, and
2. Whether the results can be repeatedly tested against reality, so that they can be refined.
Specialized models, which try to model reasonably well-understood processes, like PGR or radiation transport, can be useful, because the processes they model are manageably simple and well-understood. They pass test #1(a), and hopefully test #1(b), at least. Some of them even pass test #2.
Weather forecasting models, such as the ones which generate these hurricane projections, are also useful, even though the processes they model are very complex, and rather poorly understood, because the models’ short-term predictions can be repeatedly tested, allowing the models to be validated and refined. They fail test #1, but at least they pass test #2.
But more ambitious models, like the CMIP GCMs, which attempt to simulate the combined effects of many poorly-understood processes, over time periods too long to allow repeated testing and refinement, are of dubious utility. They fail both #1 and #2.
(Worst of all are so-called “semi-empirical models,” which aren’t actually models at all.)
Measurements from the real world are evidence. GCMs are not. They’re best understood as untested hypotheses. They make predictions, but it will be decades before there’s any hope of testing those predictions.
Their defenders say they’re trustworthy, because they accurately “hindcast” the past. But that’s only because they’ve been “tuned” against the past.
The earliest GCMs are about 30 years old, now. Unsurprisingly, their predictions, thirty years ago, were wildly inaccurate.
Some would object that today’s GCMs are far more sophisticated than the early GCMs were, 30 years ago, and that’s true, at least if you equate complexity with sophistication. But that doesn’t mean their predictions are any better than a coin toss.
Here’s NASA in Dec. 2006, trying to predict solar activity just four years out. They predicted, on the basis of “a sophisticated computer model of the sun’s inner dynamo,” a very intense Solar Cycle 24, peaking in 2010 or 2011:
https://science.nasa.gov/science-news/science-at-nasa/2006/21dec_cycle24/
Their article began:
They were, of course, spectacularly wrong, about everything. Instead of “one of the most intense cycles since record-keeping began” we got an extraordinarily weak Solar Cycle 24. Instead of peaking in about four years, in 2010 or 2011, it didn’t peak for over seven years, in 2014. Impressively, their “sophisticated computer model” did much worse than simple coin tosses would have done.
NASA’s sophisticated computer model of the Sun was as wrong in 2006 as their sophisticated computer model of the Earth’s climate was in 1988.
I have no confidence that today’s GCMs will look any better, in thirty years.
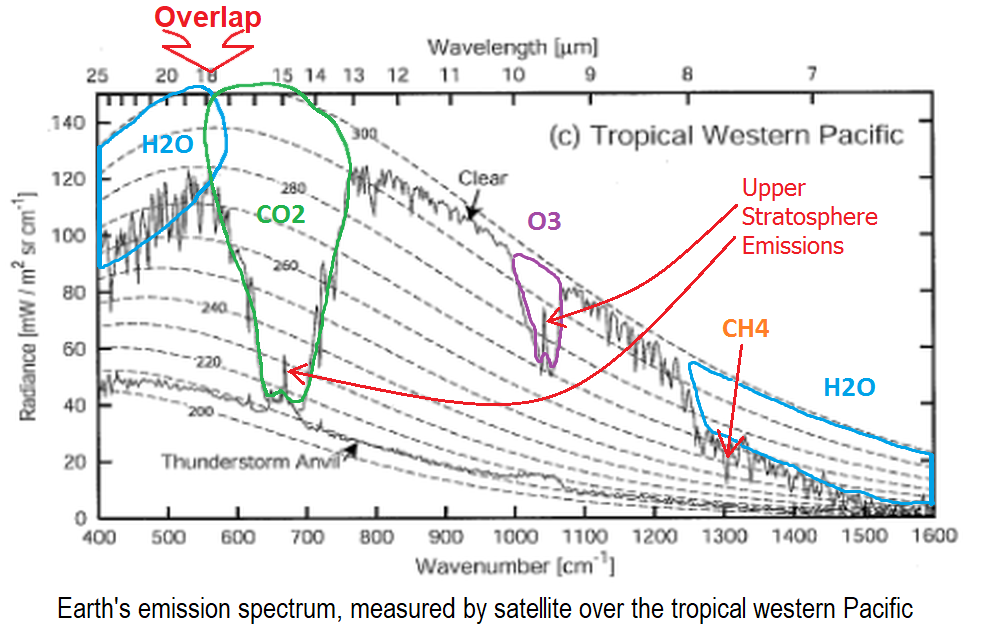
co2isnotevil wrote, “the MEASURED behavior is indistinguishable from that of a gray body whose emissivity is 0.62, as unambiguously shown in this plot…”
I don’t understand that plot, but the Earth’s emission spectrum is nothing like a grey body:
co2isnotevil wrote, “You should also be very skeptical of anything Wikipedia says about climate science, as there are demonstrable biases driving it as well. Much of the damage William Connolly (a UK green party activist) did is still there.”
Not only is the damage Connolley (not Connolly) did still there, he is still there, too. He and his cabal of activist allies ruthlessly enforce their point of view in all climate-related Wikipedia articles, to the enthusiastic applause of Wikipedia czar Jimbo Wales.
co2isnotevil wrote, “BTW, convection can not cool the planet as only radiant energy can leave the planet. Relative to the surface, all convection can do is move existing energy around. To the extent that it cools in one place it will necessarily warm in another.”
That is incorrect. Convection and especially evaporation cool the surface of the Earth, transporting heat from the surface to the atmosphere. The warmer atmosphere, in turn, radiates energy to outer space. As I previously mentioned:
Dave,
“That warms the atmosphere, which increases the rate at which the atmosphere radiates to
outer space.”
This is where you’ve been misled. The atmosphere can’t further warm the surface past the temperature that the surface has warmed the atmosphere to, the rate that energy leaves the planet is linearly proportional to the NET rate that energy leaves the surface and the NET energy leaving the surface is proportional to its temperature raised to the fourth power, or more precisely, the only relevant average temperature of the surface is the SB equivalent temperature of the net average emissions by the surface. The data could not be any more clear that for each W/m^2 of photons that leaves the TOA, 1.62 W/m^2 of PHOTONS must leave the surface. Latent heat and convection are not photons leaving the surface.
Trenberth ARBITRARILY conflated the energy transported by photons with the energy transported by matter which has left a trail of misinformation arising from this egregious assumption. The only source of radiant emissions (photons) emitted by the atmosphere are the secondary emissions of GHG’s caused by either a collision or the absorption of another photon and the BB emissions by the liquid and solid water in clouds. Air molecules in motion representing the kinetic temperature of the atmosphere do not emit photons and have no effect on the photon (radiant) balance or the sensitivity.
GHG emissions are independent of the energy transported in and out of the atmosphere by matter (latent heat, convection) beyond any effect these have had on the temperature. To the extent that the water in clouds emits photons, that water must be in the steady state in order to consider the effect on the sensitivity, so it must be absorbing the same as it emitting, otherwise, that water would heat (or cool) without bound.
co2isnotevil wrote, “The atmosphere can’t further warm the surface past the temperature that the surface has warmed the atmosphere to…”
That’s the slayer fallacy. Regardless of whether the atmosphere is warmer than the surface, or the surface is warmer than the atmosphere, warming either will have a warming effect on the other.
(And neither the surface nor the atmosphere is at a single temperature, anyhow.)
co2isnotevil wrote, “the rate that energy leaves the planet is linearly proportional to the NET rate that energy leaves the surface”
Well, if the atmosphere didn’t absorb and emit, that would be true, as “equal to” is a special case of “proportional to.”
co2isnotevil wrote, “the NET energy leaving the surface is proportional to its temperature raised to the fourth power…”
That’s true only for the radiative component. It is not true for evaporative and convective transfer of energy from the surface to the atmosphere.
co2isnotevil wrote, “for each W/m^2 of photons that leaves the TOA, 1.62 W/m^2 of PHOTONS must leave the surface. Latent heat and convection are not photons leaving the surface.”
That’s incorrect. Photons leaving the Earth for outer space come from a mixture of sources. Some are, indeed, emitted from the surface, and pass through the atmosphere. But others are emitted from radiatively active gases in the atmosphere, which got that energy, by evaporative or convective transfer, or even (less often) by absorbing incoming solar radiation which never made it to the surface.
co2isnotevil wrote, “The only source of radiant emissions (photons) emitted by the atmosphere are the secondary emissions of GHG’s caused by either a collision or the absorption of another photon and the BB emissions by the liquid and solid water in clouds.”
Mostly agreed, except that:
1. Water is not a blackbody.
2. There is some dust in that atmosphere, too.
co2isnotevil wrote, “Air molecules in motion representing the kinetic temperature of the atmosphere do not emit photons and have no effect on the photon (radiant) balance or the sensitivity.”
I assume that by “air molecules” you mean N2, O2 & Ar, and you’re not including the radiatively active trace gases, which are part of the air.
co2isnotevil wrote, “GHG emissions are independent of the energy transported in and out of the atmosphere by matter (latent heat, convection) beyond any effect these have had on the temperature.”
But energy received through evaporative and convective transfer DOES increase the temperature of the atmosphere, of course.
co2isnotevil wrote, “To the extent that the water in clouds emits photons, that water must be in the steady state in order to consider the effect on the sensitivity, so it must be absorbing the same as it emitting, otherwise, that water would heat (or cool) without bound.”
I have no idea what you’re trying to say here, but it certainly is not true that water (or anything else) must absorb the same amount of radiant energy as it emits, since there are many other ways of energy transfer to and from the water.
Arrhenius also advocated panspermia, meaning life on earth began when alien DNA arrived on earth. Should all the alarmists also believe in panspermia?
Actually, that idea is very much in vogue today. Science keeps finding earlier and earlier examples of life, leaving not enough time between the Earth’s cooling and the earliest bacteria for complicated things like DNA and RNA to evolve. But it would have eons of time to evolve if it formed earlier somewhere else. However, nothing more complicated than amino acids has ever been found in meteorites.
Not just amino acids, but all the constituents of the molecules of life have been found in meteorites, to include such complex organic compounds as sugars, fatty acids and nucleobases, plus phosphate groups. Everything needed to make RNA, DNA, proteins and cell membranes.
Carbonaceous meteorites contain a wide range of extraterrestrial nucleobases
https://www.pnas.org/content/108/34/13995
Carbonaceous chondrites are definitely interesting. Here’s a picture of a suspected one from a bolide fall that I witnessed. During a grid search of the area, I was able to collect about 20 samples totaling about 4kg.
http://www.palisad.com/pics/meteorite.jpg
This is the biggest piece I found at almost 1 kg and is characteristic of a CM1 type with an organic odor like the Murchison meteorite as well some regions of fusion crust. It tests positive for amino acids (ninhydrin test), free carbon, water, and other organics that react vigorously with H2O2, one class of which may be lipids, although that’s not definitive. It contains so much free carbon that it even conducts electricity. Under magnification, the matrix is a combination of intertwined black and dark gray material that without magnification appear almost jet black. It’s not very dense, contains small opalescent inclusions, no visible chondrules except under magnification and what look like microscopic diamonds. It’s a really cool piece of rock.
The specific event was this one:
https://fireball.amsmeteors.org/members/imo_view/event/2007/274
I was deep in the Sierra back country just North of Yosemite watching the Perseid Meteor shower when when it arrived and it basically exploded above my head as it approached a cliff face about 50 yards from camp. It’s possible that it may even be a piece of the Swift-Tuttle comet responsible for the Perseids.
Even the idea that all life in our galaxy is based on the same evolution of DNA and RNA is starting to gain traction. It won’t be long before we know one way or another.
If, and it’s a big if, there’s life on Titan, it might use a different info storage system. Whether that chilly moon does harbor life, we might learn in coming decades. Discovering the biochemistry and molecular biology of such hypothetical organisms could take longer.
It’s also possible that another nucleic acid preceded RNA in the chemical evolution of large biomolecules. Researchers have substituted non-canonical nucleobases for the four* in RNA and even made entirely novel nucleic acids, using not just different nucleobases, but new sugars.
https://www.nature.com/scitable/blog/bio2.0/synthetic_nucleic_acids_beyond_dna/
*DNA also uses four nucleobases, but one is different from (but related to) one of RNA’s four.
NASA’s mission to Titan:
https://www.nasa.gov/press-release/nasas-dragonfly-will-fly-around-titan-looking-for-origins-signs-of-life
Dragonfly will launch in 2026, arrive in 2034 and fly to promising locations around the big, icy moon until 2037.
John,
The moons of Jupiter and Saturn are too close to Earth to be absolutely sure that any life there didn’t have a common origin to life on Earth, regardless of its nucleotide composition. Saturn’s orbital diameter is about 2.8 billion km, which at only 1 KPH takes about 300K years to cross and rocks that can harbor life have been moving around the solar system much faster than that and for many billions of years. We already know life can survive the vacuum of space, that it can survive some impact events and that given the time that’s passed, it’s hard to believe that pockets of life as close as they would be in our solar system haven’t already cross contaminated each other.
It’s thought that DNA evolved from RNA, so if we do find life on Titan whether it has the same RNA or not, whether or not it has something like DNA and whether or not that DNA is the same as ours will be interesting to know, especially if methane, rather than water, is the necessary liquid. RNA has survived because it still serves a useful purpose, although there could have been precursors to RNA comprised of different nucleotides, or even having just 1 pair instead of 2, and that didn’t survive because subsequent versions evolved that were much better at doing what the old versions did. A more primordial nucleic acid could have been delivered to Titan and either didn’t evolve further or could have even evolved differently.
Life on Enceladus might be more like life in Earth’s oceans, whether it evolved separately or not, since conditions are expected to be about the same. It should also be easier to detect by putting the right sniffers into the water/ice stream that it ejects. We already know it has a salty ocean containing organic molecules. If life is there, we might already have it’s fingerprint in the data, but just haven’t recognized it yet.
Ever watch Ben Stein’s “Expelled – No Intelligence Allowed”?
The treatment of scientist who don’t agree with the subjects “consensus” should sound familiar.
At the end he interviews one of the people advocating such treatment. When asked where “life” came from, aliens was his answer.
Nick
“The extremely obvious corollary is that without the atmosphere the earth would be much like the moon…”
To me the obvious corollary is that without greenhouse gases the atmosphere would moderate the extremes of a naked planet and warm considerably in the process. Adding GHG’s gives the atmosphere the ability to cool radiatively. That’s it.
Comparisons with a naked planet are irrelevant to a discussion about GHG’s and global warming.
Svante was on the right track, but way off in his estimation of the warming effect, and the importance of negative feedbacks. His later works only partially corrected his early mistakes. He was right about warming being beneficial.
I agree with most of what you wrote, Crispin, but adding GHGs enables the atmosphere to absorb more of the outgoing radiation which would otherwise escape. That warms the troposphere.
The Earth’s emission spectrum is almost entirely below (longer than) about 4.5 µm. The Sun’s emission spectrum is mostly well above (shorter) than that. GHG’s “tint” the atmosphere at wavelengths longer than 4.5 µm. (For CO2, the absorption band is around 14.2-15.8 µm.) So the GHGs in the Earth’s atmosphere have little effect on incoming solar radiation, but a substantial effect on outgoing longwave radiation.
CO2 in the atmosphere does increase stratospheric emissions of 15 µm LW IR radiation. You can see that in the narrow spike (marked with a red arrow) in the middle of the big green “CO2” notch, in this depiction of the Earth’s emission spectrum (measured by satellite over the tropical western Pacific):
I truly do not understand why the large amount of scientists who know about the climate lie, do not speak out on a national level? Why is the truth only found on blogs and some websites? If factual science proves that CO2 isn’t as bad as they are making it out to be, and that “record” weather levels are not actual records, then why must countless people suffer mass anxiety and financial ruin by buying EV’s and solar panels… There must be a lot of respected scientists who know the truth and who can national speak the truth?
Show me the money baby.
My comment is for the people who believe the lie of “we are doomed” because if co2.. I suffered horribly due to the lies, anxiety isn’t a joke… I would love the truth to be told, I want old weather temps to be told to the masses, even the imaq melt was a lie, two ships habe got stuck in ice within the last month, yet al gore and his friends say all the ice has gone… obama bought a 15 dollar mathars vin yard house… I want and need the truth to be told on a national level so people can live their lives free of fair and anxiety
Simple, get everyone in your personal sphere to vote for Trump…4 more years would be the last “nail in the coffin” for all these lunatic lefties and you would be able to continue life without all the fake anxiety these nuts force upon you ! IMHO
Show me the Permanent Revolution baby.
Why do they lie? We have the best scientists money can buy. link
“Trust us, we’re scientists.” What a joke.
Please note that I support science and curiosity driven research. It’s necessary so engineers can have new tools to solve the problems of the world. It’s why Malthus has been wrong, up to now.
CommieBob, true about the money, but the real reason Catastrophic Anthropogenic Global Warming won’t go away is because it serves the greater agenda. AOC’s former aide, the one that cobbled up the “Green New Deal” even admitted this recently.
They say “We need a global government to combat huge global problems like Global Warming” they really mean “We want to be in control of a global government with all the perks, so we need a Really Scary Hob-goblin that creates enough fear that the governments of the world will hand over national sovereignty – Global Warming! Behold, ye mighty and despair!”
They say “We shouldn’t be eating meat because cow farts are cooking the planet!” they really mean “We hate killing the poor cute little animals, got to get everybody to stop eating animals, I know we’ll fold it into Global Warming even though the numbers don’t work – Global Warming! Take that you evil omnivores!”.
Every far left agenda needs a catastrophe to make it so scary that even thinking, well meaning folks will ceded power to the left out of fear. Somebody said “Never let a good catastrophe go to waste.” If there are no decent catastrophes around, they make them up. A constant “State of Fear” (title of Michael Crichton’s great novel about this).
By the way, this isn’t new. In the middle ages they burned “witches” because of bad weather. Somebody doesn’t agree with you – get them blamed for something nobody can control and ruin their lives. Problem solved.
Thank you, commieBob, for that link. I’ve added it to my list of such articles & papers:
https://www.sealevel.info/papers.html#lilienfeld2017
Good collection.
Because they are dependent on grant money. AGW is the cash cow that keeps on giving. They do their work, give a nod to the AGW god, and poof more money. Disprove AGW and the money goes away.
Because of bullying by stronger powers (media, politicians, professional organizations).
Bingo. I even hint that I dont toe the line, boom, I am history. Seen voting Republican, gone. Conservative posts on Facebook, poof. MAGA hat, my coworkers show up at my house to burn it…the house, hat, and me inside. Don’t laugh, it really is that bad.
As others have pointed out there is a lot of money at stake. Not just grant monies, and salaries, but Big Green is potentially a multi trillion dollar parasite industry sucking the blood out of the middle classes world wide.
It is not only about money but also political power and control of society and changing economic systems. It is also about pride and reputations.
To speak the truth that the science is not settled or to point out the uncertainties of the science is to commit career suicide. Access to publishing in many scientific journals is effectively closed to skeptics by a few gate keepers, as the Climategate emails show. The peer review system has been corrupted and is tightly controlled by warmist academics as revealed by Climategate. The main stream media usually decline to cover skeptic view points or papers at all, and if they are mentioned it is usually to heap derision up on them .
Actually many scientists have come forward. You will not hear about them the national narrative, though.
Fear of the unknown is a powerful motivator, but the driving force behind the misinformation is the IPCC. Far too many are unaware of their institutionalized conflict of interest that has kept climate science broken since the very first IPCC report and whose alarmist rhetoric is echoed ad nauseam by an ignorant MSM. When you repeat the same lies over and over, people start to believe them.
Why?
Closed environment of like-minded zealots, operating on pure theory, with heavy doses of predetermined bias, that’s never corrected by the reality.
My guess is they’ve convinced themselves whatever fudging of the facts isn’t even ‘lying’. After all, the best liars lie to themselves best.
The BBC, for one, will no longer give airtime to ‘climate change deniers.’
Alaska’s record high temp….was over 100 years ago……100F in 1915
“the warming is disproportionately in the far north,”
Which means it’s doing what it’s supposed to do….move it up and out of here
The claim is the average temp of the planet has increased 1.4F…an average
…and the Arctic has increased 3.5F
…somewhere it’s way below 1.4F
If we don’t ditch fossil fuels, Alaska might get habitable.
No it won’t
Dave,
A better choice for Alaska would have been Fairbanks. Anchorage is modified by proximity to water.
“The best evidence is that AGW is real”
Nope.
There is an anthropogenic component of GW but it is from water vapor increase, not CO2 increase. The WV increase and therefore GW is intrinsically self-limiting.
The water vapor increase resulting from temperature increase is easily calculated from the vapor pressure vs temperature relation. The standard global warming theory assumes that WV increases only as indicated by the temperature increase.
The observation is that, at least since it has been accurately measured worldwide, WV has been increasing about TWICE that expected from temperature increase. Therefore, WV increase has been driving temperature increase, not the other way around. Calculations are provided in Section 8 of my blog/analysis http://globalclimatedrivers2.blogspot.com .
I did extensive research into where the extra WV comes from. It is documented in Section 9. The WV increase results mostly (about 86%) from irrigation increase.
NASA/RSS have been measuring water vapor by satellite and reporting it since 1988 at http://www.remss.com/measurements/atmospheric-water-vapor/tpw-1-deg-product . Fig 3 in my b/a is a graph of the NASA/RSS numerical data. When normalized by dividing by the mean, the NASA/RSS data are corroborated by NCEP R1 and NCEP R2.
Brilliant read, thank you
Variations in the total column water vapour in the atmosphere since July 1983 according to The International Satellite Cloud Climatology Project (ISCCP) up to not including 2010 had declined.
Relative atmospheric humidity (%) at three different altitudes in the lower part of the atmosphere (the Troposphere) since January 1948 (Kalnay et al. 1996). Data source: Earth System Research Laboratory (NOAA). Pre-1973 data from the United States is not homogeneous according to Elliot and Gaffen (1991). Had declined up to September 2019, but remained stable over the past decade.
Specific atmospheric humidity (g/kg) at three different altitudes (1,2&3) in the lower part of the atmosphere (the Troposphere) since January 1948 (Kalnay et al. 1996).
1) Declined up to August 2019 at 300mb.
2) Declined until the mid-1980’s and increased slightly since at 600mb.
3) Increased until 1960’s, decreased until late 1970’s and then increased slightly since at 1000mb.
The Tropics using NASA/RSS measuring water vapor by satellite are showing a decline between-20S and +20N oceans only, for this century until 2015.
Relative humidity measurements are not useful for GW assessment without accompanying temperature.
Any measurements prior to 1988 can only be spot-checks and not truly global.
I graph both the +20 to -20 latitude (tropical) and the +60 to -60 numerical data provided by NASA/RSS. The Fig 3 graphs are for latitude -60° to +60° (which they call global).
I find it curious that you point out the 2002-2014 tropical decline trend but fail to mention the similar GLOBAL decline trend for the same period. In fact you erroneously assert the decline is “between-20S and +20N oceans only”.
The 0.6 kg/m^2 per decade WV uptrend, combined with the Hitran assessment of the relative importance of CO2 vs WV and the cancelling of ground level CO2 warming with above-tropopause CO2 cooling (both shown at #8 in Section 2) demonstrate that GW is controlled by WV, not CO2.
At first it appeared that the uptrend of about 0.6 kg/m^2 per decade had ended in about 2002 but the 2015-2016 super el Nino and subsequent smaller el Ninos are indicating that the uptrend might not be over but the current el Nino trend is down.
Not true because the atmospheric temperatures from satellites measured are the accompanying temperature. RH measurements relate directly to how they effect global temperatures. If the RH is going up and global temperatures are going up then energy is definitely increasing in the atmosphere.
RH going down, but temperatures up only indicate the energy needed to remain same temperature before is now less.
The rate of evaporation of water from any surface is directly proportional to the specific humidity difference between the surface and the adjoining air. The mass ratio with moist air and dry air explains nothing about how they are related to pressure, the surface temperatures or atmospheric temperatures at cloud level and below.
I do agree that WV and not CO2, control temperatures because the energy required to reach a certain temperature is dependant on RH, not SH and certainty not CO2.
The recent El Nino has ended , but there is no indication that the El Nino trend is down yet. While solar activity remains low the El Niño trend will likely increase.
MG,
Make note of how RH and temperature change during a clear day. As the day heats up, RH declines. As the day cools down, RH goes back up again. Temperature drives RH, not the reverse.
WV is a ghg which slows the flux of radiant energy from surface to space. More WV molecules means more slowing. One of the metrics for the number of WV molecules is absolute humidity. Another is Total Precipitable Water, TPW.
WV affects the average global temperature trend by its characteristic as a ghg not its influence on effective specific heat.
Your comment “While solar activity remains low the El Niño trend will likely increase” is interesting. I could not think of any causation. I did a rough comparison of el Nino and SSN 1998-2019 and they don’t correlate. IMO the declining solar activity since 2014 and high el Nino activity since 2014 are simply coincidence.
Solar radiation causes this RH decline because it speeds up evaporation and has little to do with temperature other than it can slow it down when weaker strength during different seasons.
Once close to sunset arrives RH increases because solar radiation can’t evaporate it and again it has little to do with temperature. This change in RH occurs whether it is 40c or -40c and when remaining roughly 10c during day and 10c at night.
RH mainly determines the temperature on land rather than SH because the more WV in the atmosphere, the more energy is needed to reach the same temperature. That’s why after incoming thunderstorms cause so much cooling because the energy required changes with increasing WV to keep the same level.
This is mainly referring to ocean surfaces not land because the latter is determined from above, but the other from below. The oceans with high specific heat capacity content with stored solar energy do have far more influence than WV as an ghg above its surface. This is reflected when Strong El Nino’s have the largest short term affects on global temperatures.
Cold dry air moving over the edge of a relative much warmer sea or lake draws up large amounts of SH due to evaporation forming clouds that eventually lead to precipitation. (one example lake effect snows)
The SH, total column and AH are far more related to differential temperature gradients so significant evaporation can occur with cold or warm bodies of air. Just that warm bodies of air usually store more WV, but also warm bodies of air can be very dry. It’s generally only showing an increase or decease in differential temperature gradients.
Regarding El Nino the cause is down to the solar influence on the changing Walker circulation. It’s weak during low solar activity and strong during high solar activity. The reason why there were also numerous La Nina’s between the 1950’s and 1970’s because of generally high solar activity. It is a natural negative feedback mechanism and declining solar activity since the 1990’s has brought about an increase in El Nino’s since.
Forgot to add to this from WUWT showing solar activity was low around 1998 and 2019.
If we can’t even agree on something as obvious as the fact that Alaska is too darn cold, then is there any hope that we can ever agree on anything? It is a testament to the power of relentless propaganda that the Left has managed to convince even many shivering Alaskans and Canadians that a warmer climate above the 49th parallel would somehow be a bad thing.
+100, sums it up accurately. Is there a mental-condition description for this pathology? Cultism seems too understated.
I would describe it as “collective stupidity”, even cultists are not as stupid as climate alarmists.
Sadly, collective stupidity is not a new phenomenon. Burning witches was an example from the recent past as was feeding virgins to volcanoes from slightly earlier in history, to please the “gods”.
Rain dance routines fall into the same collective stupidity but as that is something specific to a minority group we have to call it cultural idiosyncrasy, the last part of the word (crasy) almost covers it.
Thanks Rod, and yes, my thoughts went back to examples of historical/ancient mental pathologies (sacrifices, witch-hunts, etc), and I would venture that the current versions are every bit as irrational as those, and potentially more destructive given the numbers affected.
Off topic, sort of.
Have you seen McKibben’s latest screed in Time magazine? Words fail me.
This article? Bill says the climate apocalypse is coming.
———————-
Hello From the Year 2050. We Avoided the Worst of Climate Change — But Everything Is Different
Let’s imagine for a moment that we’ve reached the middle of the century. It’s 2050, and we have a moment to reflect—the climate fight remains the consuming battle of our age, but its most intense phase may be in our rearview mirror. And so we can look back to see how we might have managed to dramatically change our society and economy. We had no other choice.
There was a point after 2020 when we began to collectively realize a few basic things.
https://time.com/5669022/climate-change-2050/
McKibben is as stupid as he is misinformed.
But even brains and education are of little use to a deranged sociopath, so it hardly matters that he has neither.
The invented-from-thin-air fiction that warming is necessarily a bad thing, has got to be considered the most successful part of the whole warmista litany of lies.
Prior to 1988, everyone knew that there were warm and cold periods in the past.
And it was equally clear that the cold periods were awful times, and the warm periods were highly beneficial.
Beneficial for people, for human endeavors in general, and beneficial for crops, and life in general.
No one argued otherwise.
This was known equally well to scientists and historians, and common sense was not even required to understand how obviously true it is that cold kills and warmth brings life.
And yet without debate, evidence, or even any recollectable argument or cogent explication, somehow millions (perhaps many hundreds of millions) of people have had the notion planted in their brains that human being and all living things are in mortal danger of extinguishment if the globe was to warm by an amount which is barely perceptible, on a planet which is in an ice age, above the temperatures of most awfully and frigidly cold period on our planet in some 10,000 years or more!
It defies explanation, and yet is barely even spoken of.
Huge numbers of seemingly intelligent and educated people have been brainwashed into forgetting how much people hate to be cold, how completely and utterly life is diminished by cold temperatures, and how a huge portion of our planet is in a state of being a perpetually frozen wasteland, a frozen lifeless Hell, which is barely survivable by the hardiest of creatures.
People in northern Europe march in protest, to proclaim their abject terror at the prospect of a tiny amount of warming, and inanely do so in the dead of Winter while bundled up from head to toe, against what would be a fatal lack of warmth without such specialized clothing!
Doomsday death cult alarmists intone gravely that there is a possibility that the hottest places on the planet could, MAYBE, become hot enough to kill a person, at some unspecified point in the future.
That they do so without evidence is bad enough.
That they do so while seemingly oblivious to the well known fact that an entire continent is currently and perpetually far below the temperature at which a human being will die within minutes without head to toe specialized clothing, and a huge swath of the surface of our world is permanently or seasonally far too cold for an unprotected human being to survive even a single night, and yet are never called out on this contradiction, shows us how completely and thoroughly the world has been brainwashed.
Good for you Dave Burton.
Thank you for being one of the few who are aware of this and willing to say what needs to be said.
CO2 as a poisonous pollutant, somewhat milder temperatures as unsurvivable, frozen wastelands as necessary for survival of life on Earth…that people (including and especially the supposedly well-educated and highly intelligent “woke” branch of our species) in 2019 can be easily convinced of each of these is proof positive that human beings are in general an unthoughtful and illogical lot.
Thank you, Nicholas.
Malaria is another disease falsely linked t climate change…
https://malariajournal.biomedcentral.com/articles/10.1186/1475-2875-7-S1-S3
“I would not say that anthropogenic (manmade) global warming (AGW) is a myth.”
No one says that, so that’s a straw man. It is conjecture, nothing more. If it exists, it is too small an effect to distinguish with natural warming.
“The best evidence is that AGW is real, but modest and benign”. Nope. There is no real world evidence. Models are not evidence. But yeah if it does exist, however small, it is entirely beneficial.
Ticks are not mobile. Whether it is warmer some place or not, ticks totally rely on hitching a ride on deer or other ungulates. Any scientist worth his salt, or any honest journalist, would immediately question any climate hypothesis and ask how have deer changed the transportation of ticks.
According to much research, “Nationally, the white-tailed deer population has increased from about 500,000 in the early 1900s to 25 million to 30 million today, according to various researchers.”
http://www.nbcnews.com/id/6835501/ns/us_news-environment/t/deer-eating-away-forests-nationwide/#.XXpwjC3Myu4
Similar change in the western USA’s black-tailed deer.
I am totally amazed by how ignorant climate alarmists are regards basic ecology. Alarmists are so blinded by groupthink they fail to ask the most basic scientific questions such as ‘what are the alternative hypotheses’ other than CO2!
It is however a material fact that Alaska is now seeing much warmer – even record – temperatures. Which is clearly climate change, isn’t it?
“Alaska is now seeing much warmer … temperatures … Which is clearly climate change …”
Given the short period of time that it has been happening, I would call it weather.
Allah, God if you will, gave us warmth, abundant harvests, and unprecedented prosperity. People around the world are healthier, and living longer. Yet, the watermelons (green on the outside, red inside) believe we are in a crisis.
“Yet, the watermelons … believe we are in a crisis.”
I wonder, do they believe we are in a crisis or do they need to create a crisis in order to implement their plans?
The main point is that the Climate Alarmists define any change whatsoever as “catestrophic”. As if the earth has ever been unchanging since it was formed 4+ billion years ago.
Every time change occurs, there are winners and losers. Climate alarmist talk only about the losers, and never ever talk about the winners.
The fact is there is no such thing as “Goldy Locks climate” that is “just right”. It just is. Whatever it is, is what it is, and it has no good or bad characteristics, it just has its characteristics
If climate change were intrinsically “bad”, then the fact that life exists at all on this planet is a bad outcome, by that measure. Because until the earth first gained an atmosphere, and then when early simple lifeforms converted CO2 to oxygen through photosynthesis, this planet was no place for anything but the simplest life forms, like bacteria. It took until about half a billion years ago with the Great Oxygenation Event before life even remotely as complex and abundant as we see it today was able to to survive.
Bottom line, warming is GOOD for humans and most life forms. Cooling is BAD for humans and most life forms. Warming is therefore a net winner, not a net loser.
Glad you picked Dover-Foxcroft, my hometown!
I would disagree with granting that AGW has been reliably established. My reading on geochemical cycles leads me to think that the recent CO2 rise could be largely natural, and that mankind’s contribution to the increase in CO2 could be minor. I certainly think that stating that AGW is firmly established is unfounded.
I have an old album titled “Saturday Night in Dover-Foxcroft. Very Funny.
Dave, Svante Arrhenius was wrong. Svante Arrhenius got it backwards because in the real world temperature increases precede CO2 increases. CO2 is regularly outgassed by the ocean according to Henry’s Law of Solubility of Gases, with significant temperature and pressure dependence.
The world is going berserk over trying to shoehorn reality to fit Arrhenius’ backwards idea to the point where it has metastasized into a malignant tumor, a blight on science and society.
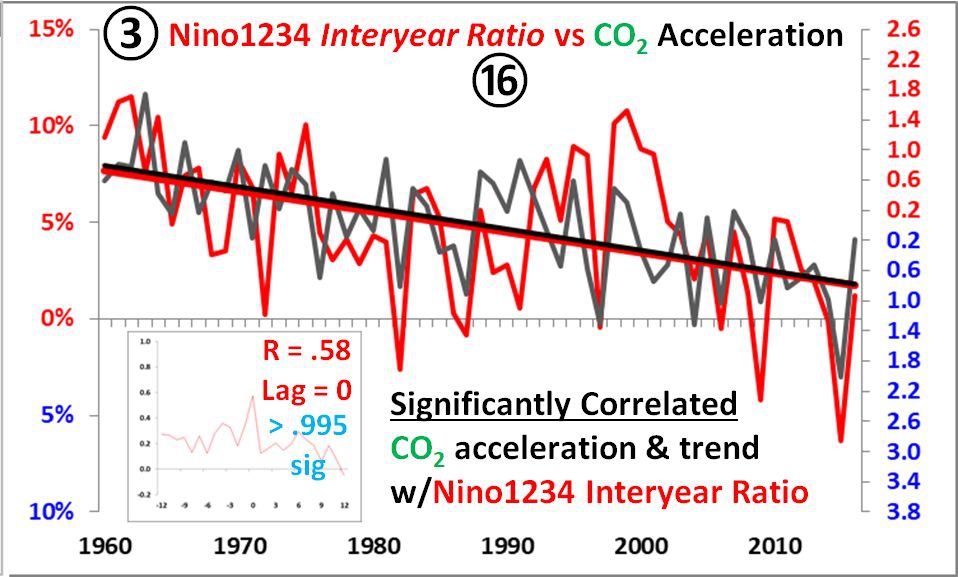
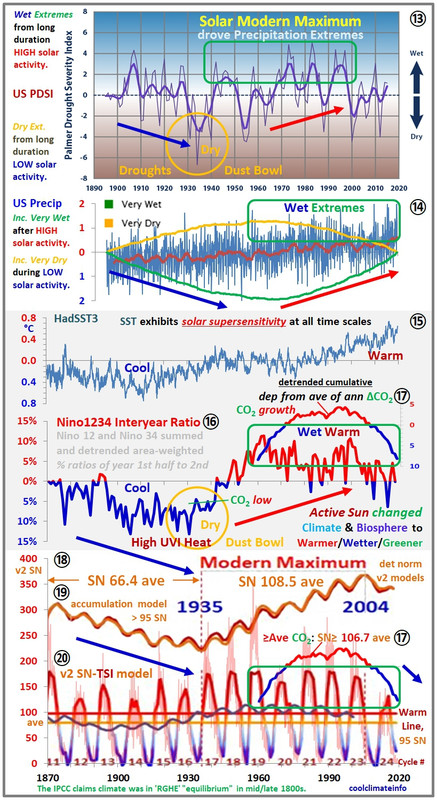
Since Mauna Loa CO2 data collection began in 1958, the years with the greatest annual departure from average for detrended cumulative annual CO2 were when Nino3/4 were high, when sunspots averaged above 106.7, at >.995 significance:
CO2 significantly accelerates with Nino1234, indicating a primarily natural origin for ML CO2:
The benefit from higher solar activity is more warmth, more CO2, and more precipitation, leading to more greening. US precipitation data was detrended here, but not noted:
Henry’s Law CO2 solubility curve was also reproduced using Nino12 & 34 with ML CO2 data. 😉
Human CO2 emissions are indistinguishable from noise compared to predictable natural outgassing.
Climate change is all-natural and solar-driven via TSI. CO2 is a response to the sun-warmed ocean.
CO2 is confused as the warming agent because it outgasses above 25.6C, before Nino34 gets warm enough for positive MEI and more negative central pacific outgoing longwave radiation, CP OLR, from increased tropically evaporated clouds that characterize El Nino conditions.
The Nino 4 region never drops below the sinking/outgassing threshold, thus is continually producing CO2 year-round, driving the upward trend in ML CO2. If Nino 4 dropped by four degrees, with Nino 3 following, all ocean CO2 outgassing would cease. Until it does the ocean is a net source of CO2 each year, although the cooler areas that sink CO2 vastly outnumber the highly-productive tropics.
Bob Weber wrote, “Svante Arrhenius was wrong… CO2 is regularly outgassed by the ocean according to Henry’s Law.”
That’s incorrect, Bob.
In pre-industrial times, the oceans sometimes outgassed CO2 and sometimes absorbed CO2. (Of course the oceans are always both outgassing and absorbing CO2, but I’m talking about the net flux.) That’s no longer true. Now, with the partial pressure of CO2 in the atmosphere increased by about 47% (280 ppmv → 411 ppmv), the oceans are net absorbers of CO2 from the atmosphere, even in cool La Nina years, as required by Henry’s Law.
Bob continued, “the years with the greatest annual departure from average for detrended cumulative annual CO2 were when Nino3/4 were high”
Temperature fluctuations largely explain the year-to-year variation in CO2 flux, only. They do not explain the long-term trend. The long-term trend of increasing CO2 levels is due to mankind’s CO2 emissions.
Mankind is currently adding an average of about 40 Gt CO2 to the atmosphere, per year, equivalent to nearly 5 ppmv. But atmospheric CO2 levels have increased by only about 2.4 ppmv/year (averaged over the last ten years). The difference is the CO2 removal rate, mainly by terrestrial “greening” and absorption into the oceans. Roy Spencer wrote about it here:
http://www.drroyspencer.com/2019/04/a-simple-model-of-the-atmospheric-co2-budget/
Bob, are you “coolclimatedotinfo“? He had a discussion similar to this over on Judith Curry’s blog, last year. Hans Erren explained all this to him very well.
Hans quantified the amount of atmospheric CO2 increase that you could plausibly get from the amount of warming the Earth has seen recently. He calculated about 10 ppmv.
In fact, that’s a generous, high-end estimate: at most 10 ppmv, certainly not 130 ppmv.
Maybe it wasn’t obvious how he got that. Let me show you. It’s pretty simple.
The ice cores show that, even after long equilibration, a full transition from glacial maximum to interglacial probably corresponds to a globally averaged temperature increase of about 5°C (and about twice that at the poles). That produces a CO2 level change totally only about 90 ppmv. That’s only about 18 ppmv CO2 level change per °C.
In contrast, since 1958 mankind’s the atmospheric CO2 level rose by about 96 ppmv, during a time period when globally averaged temperatures rose by only between 0.4 and 0.9°C.
CO2:
https://sealevel.info/co2.html
Temperatures:
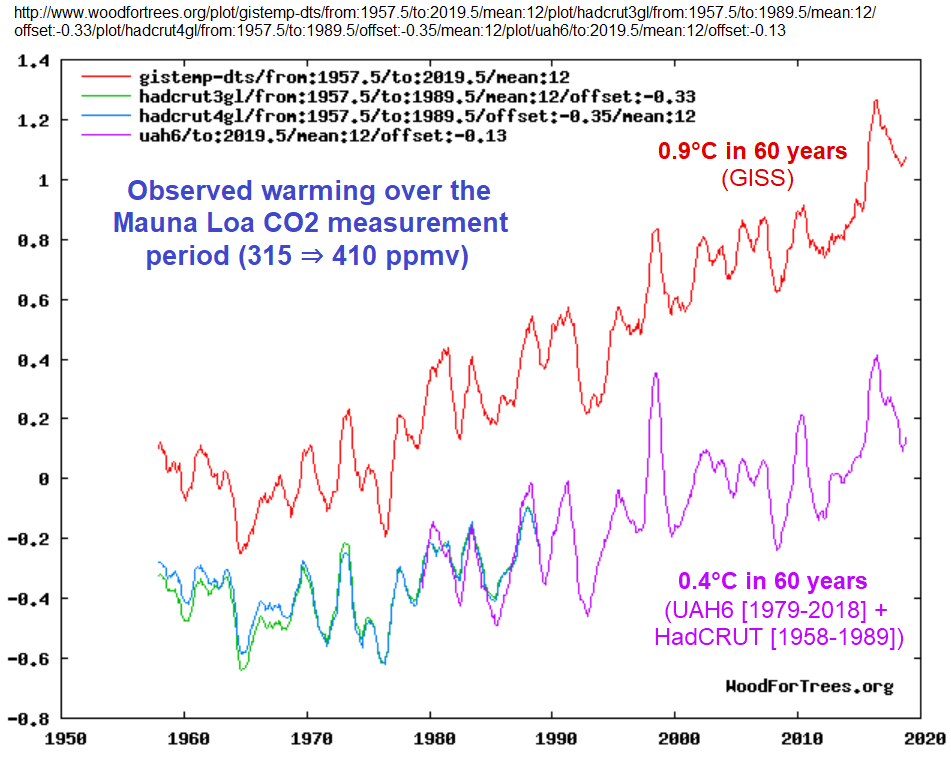
I hope it’s obvious that <1°C of warming could not cause a 96 ppmv increase in CO2 level.
At first glance, if you believe GISS's high-end (0.9°C) figure, you might think that the warming could explain (0.9°C)×(18 ppmv/°C) = 16 ppmv CO2. But that's over just sixty years. The (avg. at least 500 yr) delay seen in the ice cores between the reversals in temperature trend and the reversals in CO2 trend which follow, suggests that the equilibration time must be at least hundreds of years. So, to get 18 ppmv from 1°C of warming would require hundreds of years of equilibration (and 60% of that CO2 increase was in just the last 30 years).
So Hans Erren’s estimate of 10 ppmv was actually probably on the high side. In such a short amount of time I doubt that that the tiny 0.4 to 0.9 °C of warming could cause even half that much of a rise in CO2 level.
It certainly couldn’t cause a 96 ppmv increase.
If that 96 ppmv resulted from global warming, it would mean temperatures warmed more in the last sixty years than they warmed going from last glacial maximum to the Holocene Climate Optimum. If that had actually happened, then even I would be a climate alarmist!
Bob continued, “ “
“
I don’t understand that graph. I suppose that “NINO1234” must be an averaged ENSO index? Okay, but that graph appears to show a 150-long ENSO cycle, and it goes back about eighty years further than we actually have ENSO data. None of that makes any sense.
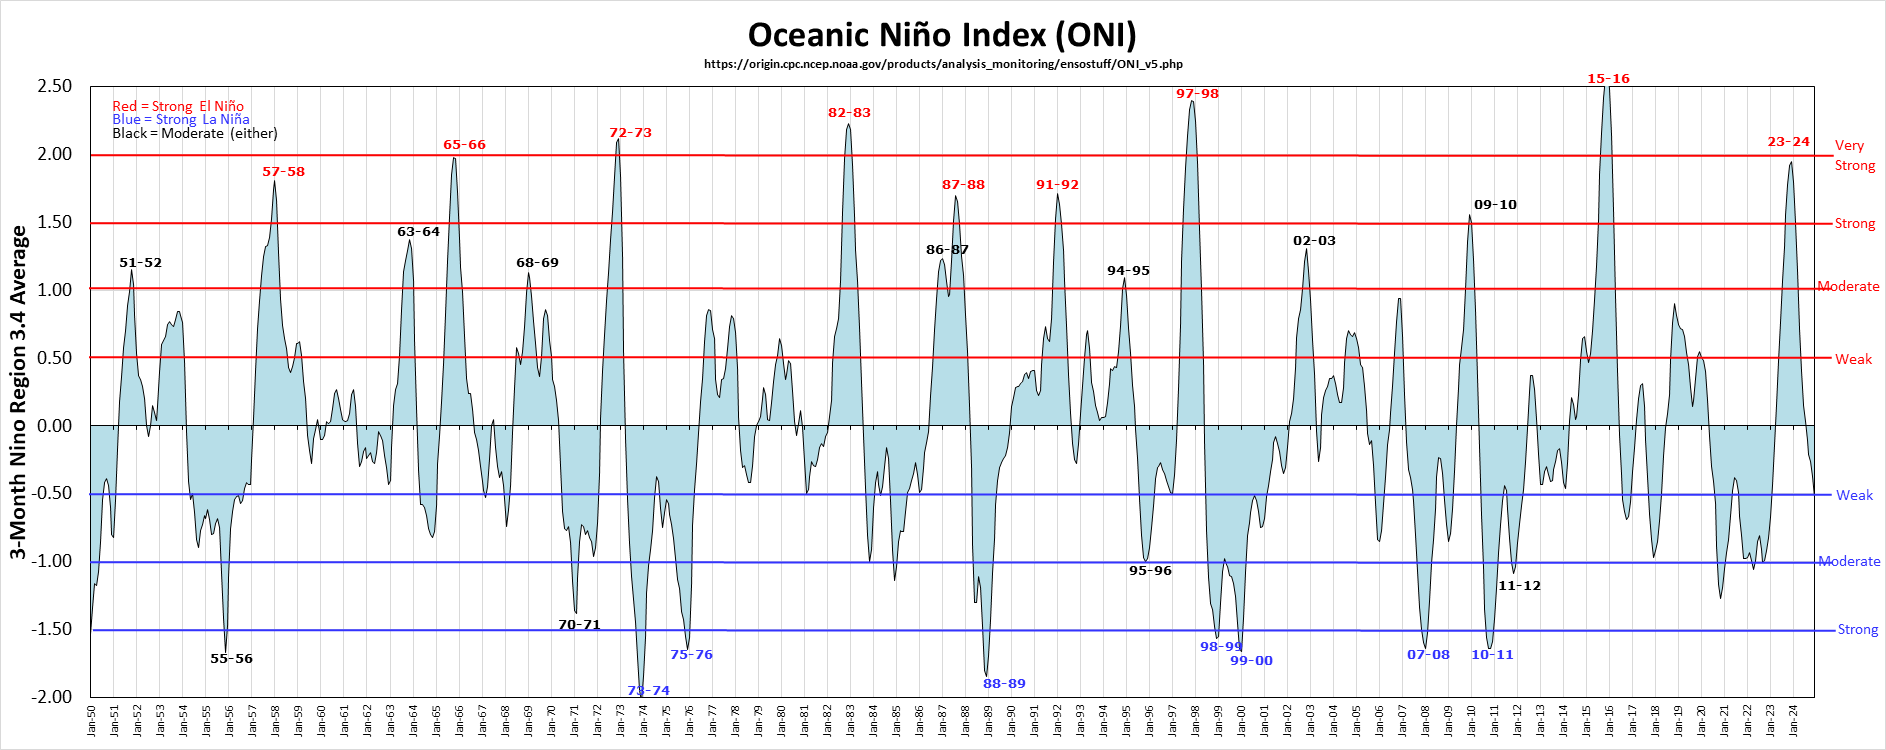
Here’s a more conventional ENSO graph:
Here’s Trenberth’s UCAR page:
https://climatedataguide.ucar.edu/climate-data/nino-sst-indices-nino-12-3-34-4-oni-and-tni
Bob continued, “CO2 significantly accelerates with Nino1234, indicating a primarily natural origin for ML CO2:
 “
“
Nothing “indicates a primarily natural origin for ML CO2.” We put that CO2 in the atmosphere.
It’s simple arithmetic: when you put 8.053 Gt of CO2 in the atmosphere, the average atmospheric CO2 level increases by precisely 1.00 ppmv.
The interesting thing is that even as mankind adds CO2 to the atmosphere, natural negative feedbacks are simultaneously removing about 20 Gt CO2 per year from the atmosphere, moving the carbon into other carbon reservoirs (mainly the oceans, biosphere & soil).
If the oceans were really outgassing CO2, then (unless the terrestrial biosphere sucked it all up & more) CO2 levels would be rising at more than twice the current rate.
That graph makes no sense to me, either. “NINO1234 Interyear Ratio”? “CO2 Acceleration?” Similar-looking but unlabeled graph traces?
It appears to be some sort of exercise in curve-matching between small fluctuations in an ENSO index and small fluctuations in CO2 level at a single arbitrarily chosen location. Or something like that.
I guess it doesn’t matter. I think we all understand that year-to-year fluctuations in CO2 level are mostly explained by global temperature fluctuations (largely driven by ENSO) and, though you didn’t mention it, occasionally by large volcanic eruptions.
Of course, that has almost nothing to do with the long-term CO2 trend, in which anthropogenic CO2 emissions are driving atmospheric CO2 levels higher.
Bob continued, “The benefit from higher solar activity is more warmth, more CO2, and more precipitation, leading to more greening. US precipitation data was detrended here, but not noted:
 “
“
Sorry, I don’t understand that collection of very colorful graphs, but here’s a graph showing U.S. “very wet” percentages by year on the top, and “very dry” percentages by year on the bottom:
https://www.ncdc.noaa.gov/temp-and-precip/uspa/wet-dry/0
“Very dry” years might be trending down very slightly (not much), and there’s no apparent trend in “very wet” years.
The plot #3 link refers to plot #16 of the Sun-powered image (they were all made to fit on one page but are split up here) where on plot #16 the Nino1234 Interyear ratio,/b> is defined, as a percentage. The CO2 acceleration curve is what it sounds like, the change in the monthly CO2 change, ppmv/mo/mo. The plots imply that CO2 significantly changes with Nino1234.
What is Nino1234 really and why is it used? It gets down to knowing when the maximum CO2 production happens, that it’s regular every year like clockwork, as shown in the first plot of the next link, peaking in May. Any annual net increases in CO2 are going to be driven only by the annual changes occurring in the first half of the year when the detrended average annual CO2 anomaly is positive. CO2 then net sinks in the second half of the year. The CO2 trend heavily depends on the net positive anomaly increases in the first half of the year compared to the second half, thus the interyear ratio was conceived as a percentage, the area-weighted sum of ratios for Nino 12 and Nino34 of the first half of the year to the second half of the year, for each year, then the complete time-series was detrended.
I started with these plots of ML CO2 and Nino region annual averages, originally using Nino34 as shown. Then I realized Nino 3 was a better fit, which yielded a lower sinking/outgassing threshold.
The R=.96 since 1870 significantly indicates sunspot activity drives Nino1234 which drives CO2.
The detrended 12-month change in CO2 is a good indice to use because it removes the annual CO2 cycle, while detrending takes out the trend obviously, leaving the real CO2 anomaly. Cross-correlations with Nino34a, MEI, and CP OLR indicate this real CO2 anomaly lags Nino34a, MEI, and CP OLR by 1-2 months a very high significance >.995.
So while CO2 starts to outgas before MEI goes positive and CP OLR goes negative, the real CO2 major production lags Nino34 by 1-2 months, due to upwelling time.
Svante Arrhenius was wrong. A higher solar activity powered sun-warmed ocean enables higher CO2 production in the first half of the year from the Nino 3 & 4 regions, driving the CO2 trend.
All the mass balance methods are missing the real action, so whatever Hans said is wrong.
yikes! formatting fixed here hopefully:
The plot #3 link refers to plot #16 of the Sun-powered image (they were all made to fit on one page but are split up here) where on plot #16 the Nino1234 Interyear ratio is defined, as a percentage. The CO2 acceleration curve is what it sounds like, the change in the monthly CO2 change, ppmv/mo/mo. The plots imply that CO2 significantly changes with Nino1234.
What is Nino1234 really and why is it used? It gets down to knowing when the maximum CO2 production happens, that it’s regular every year like clockwork, as shown in the first plot of the next link, peaking in May. Any annual net increases in CO2 are going to be driven only by the annual changes occurring in the first half of the year when the detrended average annual CO2 anomaly is positive. CO2 then net sinks in the second half of the year. The CO2 trend heavily depends on the net positive anomaly increases in the first half of the year compared to the second half, thus the interyear ratio was conceived as a percentage, the area-weighted sum of ratios for Nino 12 and Nino34 of the first half of the year to the second half of the year, for each year, then the complete time-series was detrended.
I started with these plots of ML CO2 and Nino region annual averages, originally using Nino34 as shown. Then I realized Nino 3 was a better fit, which yielded a lower sinking/outgassing threshold.
The R=.96 since 1870 significantly indicates sunspot activity drives Nino1234 which drives CO2.
The detrended 12-month change in CO2 is a good indice to use because it removes the annual CO2 cycle, while detrending takes out the trend obviously, leaving the real CO2 anomaly. Cross-correlations with Nino34a, MEI, and CP OLR indicate this real CO2 anomaly lags Nino34a, MEI, and CP OLR by 1-2 months a very high significance >.995.
So while CO2 starts to outgas before MEI goes positive and CP OLR goes negative, the real CO2 major production lags Nino34 by 1-2 months, due to upwelling time.
Svante Arrhenius was wrong. A higher solar activity powered sun-warmed ocean enables higher CO2 production in the first half of the year from the Nino 3 & 4 regions, driving the CO2 trend.
All the mass balance methods are missing the real action, so whatever Hans said is wrong.
These are contradictory mutually exclusive statements. Here’s the fixed version:
If the year-to-year fluctuations are agreed upon as mostly explained by … ENSO, then the trend is owed to ENSO.
MM emissions correlate 28% with ML CO2, but it’s only a very very small number by comparison to accumulated annual naturally outgassed CO2. The presumptions going into isotope ratios and other studies are usually built upon assumptions like most of the CO2 is man-made now.
The slow rise in Law Dome CO2 out of the 1800’s that arced upward into modern ML CO2 is a reflection of the low-solar period that produced less CO2 annually transitioning into a higher solar activity epoch with higher annual CO2 production due to solar-induced Nino warming.
Bob Weber concluded this comment, “…whatever Hans said is wrong.”
Wrong. Hans was exactly correct, and he cited this wonderfully clear and comprehensive analysis by Ferdinand Engelbeen, which you really should read.
Ferdinand wrote it twelve years ago, so the “current” figures he uses are a bit dated. But his analysis is the clearest and most complete I’ve seen, anywhere. Anyone who wants to understand the evidence for the origin of the increased CO2 level in the atmosphere needs to read Ferdinand’s compelling analysis.
Hans is as confused as Ferdinand and you. CO2 is mostly outgassed as I show.
There is no point in reading confusion from warmist hand-maidans. How many times have you guys posted your stuff? Hundreds? Who hasn’t seen it? It’s old news and it’s still wrong! The natural CO2 increase is due to a solar warmed ocean temperature increase, with a very small human component.
What should happen Dave is you should understand why I am perfectly correct, that CO2 conforms to natural law, Henry’s Law, which doesn’t leave very much room for man-made emissions.
What makes you think the last century of CO2 increase was any different than previous periods historically when CO2 increased after the temperature rose? It’s no different today because the same principles applied then as now.
Bob Weber (apparently a/k/a “coolclimatedotinfo“) wrote, “The plot #3 link refers to plot #16 of the Sun-powered image (they were all made to fit on one page but are split up here) where on plot #16 the Nino1234 Interyear ratio is defined, as a percentage.”
Without a link to “plot #16 of the Sun-powered image” (whatever that is) that explanation doesn’t explain anything.
Bob continued, “The CO2 acceleration curve is what it sounds like, the change in the monthly CO2 change, ppmv/mo/mo. The plots imply that CO2 significantly changes with Nino1234.”
“Monthly”?? The monthly CO2 change at Mauna Loa is overwhelmingly dominated by the seasonal cycle. In June, July, August, September, and occasionally October, the CO2 level falls. In the other months the CO2 level rises. The first plot here shows that:
https://www.esrl.noaa.gov/gmd/ccgg/trends/
That pattern is not global. In the southern hemisphere it is very different. At Cape Grim, the seasonal cycle amplitude is much less, and the sign is reversed. The peak month is September, which is the month which typically has the lowest CO2 level at Mauna Loa. Here’s a graph contrasting the CO2 seasonal cycles at Mauna Loa (northern hemisphere) and Cape Grim (southern hemisphere):

Bob wrote, “What is Nino1234 really and why is it used? It gets down to knowing when the maximum CO2 production happens, that it’s regular every year like clockwork, as shown in the first plot of the next link, peaking in May.”
I have no idea what “the next link” refers to, but that’s just the seasonal cycle, which does not affect the long term trend.
Bob wrote, “Any annual net increases in CO2 are going to be driven only by the annual changes occurring in the first half of the year when the detrended average annual CO2 anomaly is positive.”
Nonsense. Transient and cyclical components of the Mauna Loa CO2 “Keeling Curve,” like the seasonal cycle, and ENSO/AMO/volcano-driven temperature effects, do not significantly affect the long term trend. The long term trend is determined by the CO2 which mankind adds to the atmosphere minus the CO2 removed by natural negative feedbacks, like “greening” and absorption into the oceans, which are only slightly affected by temperature transients.
If you don’t understand how that is possible, consider this “synthetic” function, which loosely resembles the Keeling Curve to date:
y = 290 + (x-1958)*0.5 + 0.5*1.03^(x-1845) + 0.8cos((2π*x)/(4.5)) + 3.5cos(2π*x)
Note well: I did not try to make this function a precise match to the actual Keeling Curve. I just “eyeballed” it to get something with a loose resemblance to the Keeling Curve, to illustrate the principle: that periodic and quasi-periodic components, like the seasonal cycle and ENSO, do not affect the long term trend.
I graphed it using one of many free online graphing calculators. Here’s the graph it generates:
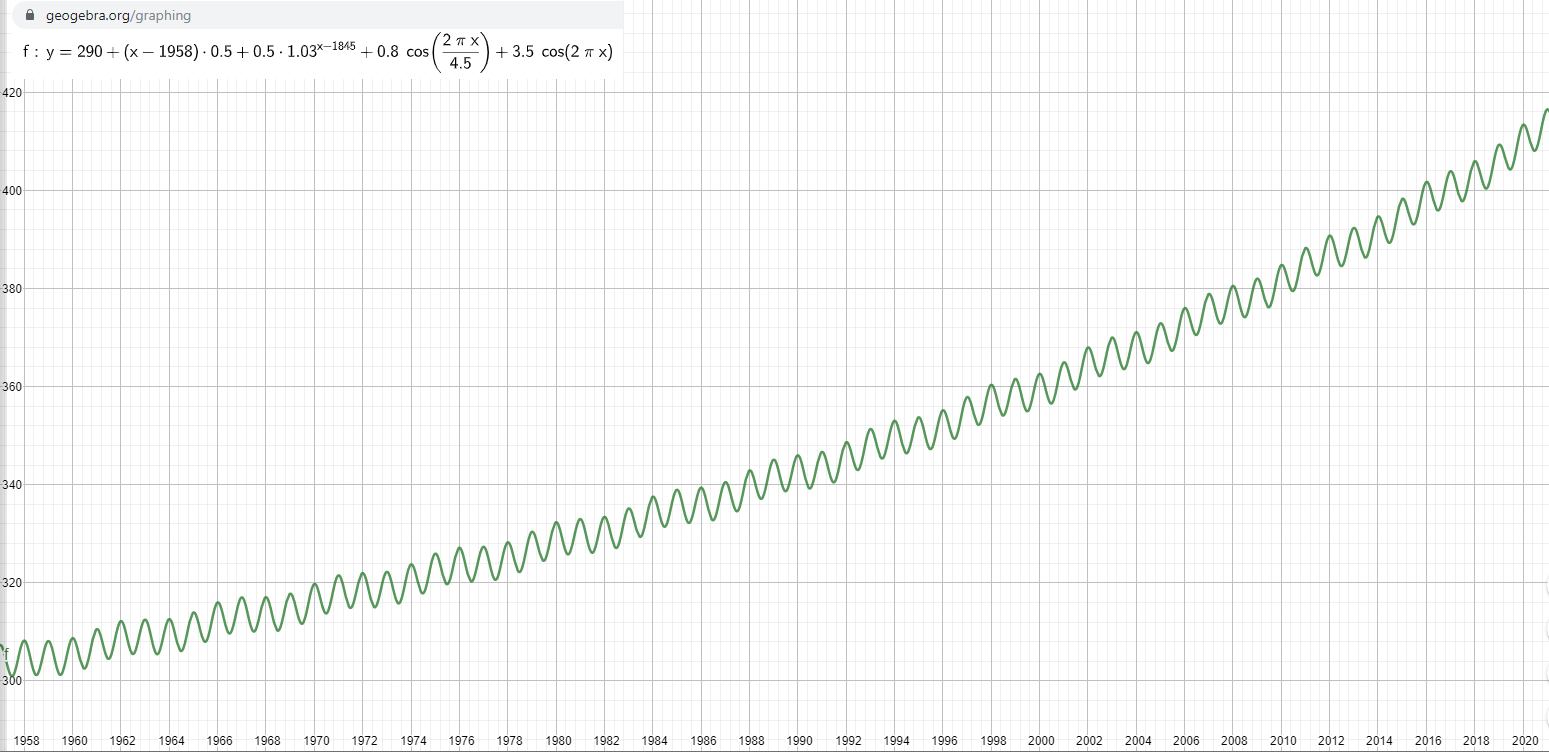
The function is trivially decomposed into periodic and long-term trend components.
Part #1: Long term trend:
290 + (x-1958)*0.5 + 0.5*1.03^(x-1845)
Part #2: An unnaturally regular periodic variation, with period similar to the average ENSO period:
+ 0.8cos((2π*x)/(4.5))
Part #3: A seasonal cycle component:
+ 3.5cos(2π*x)
I hope it is obvious that Parts #2 & #3 do not affect the long term trend. if you graph just Part #1 alone, the long term trend is identical to the long term trend of the entire synthetic function.
Bob continued in his next comment, “If the year-to-year fluctuations are agreed upon as mostly explained by … ENSO, then the trend is owed to ENSO.”
Wrong. ENSO is a quasi-periodic phenomenon. It does not significantly affect the long-term trend in CO2 levels.
Bob continued in his next comment (out of thread, below), “Dave you are a very confused man. All you did was make yourself look dumb. Nino1234 was defined as noted on one of the images: Nino 12 and Nino 34 summed and detrended area-weighted % ratios of year 1st half to 2nd.”
Yes, I’m definitely too dumb to decipher what “Nino 12 and Nino 34 summed and detrended area-weighted % ratios of year 1st half to 2nd” means.
Bob, it sounds like you’ve been listening to Murry Salby, Ed Berry, or Hermann Harde, who contend that adding CO2 to the atmosphere does not significantly affect the level of CO2 in the atmosphere.
Read that sentence again. If it sounds ridiculous, that’s because it is ridiculous.
They would have you believe that the anthropogenic CO2 just vanishes from the atmosphere, and Salby, at least, thinks that the atmospheric CO2 level is increasing by more than 2 ppmv each year simply because global mean temperatures are now about 1°C warmer than they were during the Little Ice Age.
That is obviously completely wrong. I posted a detailed critique of one of Salby’s lectures, in the comments on his youtube video, in two parts: here, and here.
Dave you are very confused man. Let’s get this out of the way first as it seems to really bother you. My wordpress login is coolclimateinfo, which I obtained in order to converse at Dr. Judy’s site. Is that good enough for you, or did you think it meant something sinister?
You are very much fooling yourself. Henry’s Law is confirmed by ML CO2 and Nino3, meaning CO2 is just about all-natural.
The other crap you talk about at the bottom of your comment is pure drivel. If it hasn’t dawned on you by now, let me the first to tell you Dave I do my own work. Whatever those other guys said has no bearing on what I’ve done, none whatsoever. They may be right also for all I know, but in either case I won’t be accepting any attempted smear by you using their names. You have just acted out more warmist slander Dave Burton.
The problem we (you) are having is you’re not learning. I told you why the Nino1234 Interyear ratio is important to understanding the annual CO2 trend, but you didn’t pay any attention, instead you wish to defer to man-made emissions. Where is the evidence for such a perfectly synchronized emissions profile? Which is it, emissions or vegetation like Ferdinand says?
This gets to the other main problem I pointed out to him, you guys can conceive a variety of carbon budgets to suit your needs of the moment as long as you ignore the elephant in the room, natural outgassing, so off you go running with whatever sounds good into non-reality.
Dave you are a very confused man. All you did was make yourself look dumb.
Nino1234 was defined as noted on one of the images:
Nino 12 and Nino 34 summed and detrended area-weighted % ratios of year 1st half to 2nd.
Your ramble mentions volcanic eruptions. Can you see the disruptions in 1984 and 1991?
US precipitation anomaly data was detrended, which ironically reveals a trend.
The mass-balance approach needs this proper perspective Dave Burton.
Let us not forget the evidence from the Carbon isotopic excursion. Fossil fuel burning, enriched in the C13 isotope, is detectable via the Delta C13/14 ratio. This is the fingerprint of human produced CO2.
WBWilson, I think you mean the 13C/12C ratio (rather than 13C/14C), but yes, isotopic analysis shows that much less than ((411-280)/410)=32% of the CO2 in the atmosphere originated as fossil fuels.
Yet mankind has raised CO2 levels by (411-280)=131 ppmv, which is ((411-280)/280)=47%.
Does that sound like a contradiction? Well, it would be — if there were no processes constantly exchanging atmospheric carbon for carbon in other reservoirs, mainly the biosphere & oceans.
Because of those exchanges, the expected value of the residence time for a CO2 molecule added to that atmosphere is only about 16.6 years, even though the practical residence time (or “adjustment time”) for CO2 added to the atmosphere (ignoring the “long, fat decay tail”) is about fifty years.
The 16.6 year figure is most easily derived from the famous 14C “bomb spike” decay curve (resulting from the nuclear atmospheric test ban), because it showed an 11.5 year half-life:
http://2.bp.blogspot.com/-G79oXdgIZC4/UnteTCVaGGI/AAAAAAAAAA0/AbSzY3s5ZP0/s1600/logc14.jpg
The fifty year figure can be derived by comparing net atmospheric CO2 removal rates to CO2 levels in the atmosphere (including the comments):
http://www.drroyspencer.com/2019/04/a-simple-model-of-the-atmospheric-co2-budget/
the practical residence time… is about fifty years
As ML CO2 data is 61 years old now, this means what, all the CO2 now is man-made? So the claim is the CO2 sinks in the ocean and also greens the earth. This would mean all the tree growth in the past 50 years came from man-made emissions, with plenty of extra CO2 to sink into the ocean, correct Dave Burton? All the trees and all the grasses, plants, etc are now made from man-made emissions, not natural CO2?
If your numbers were right and humans actually cut-off emissions by 2030 as the CO2 lunatics want then earth would inevitably quickly starve for CO2 in 17-50 years, reaching a zero point, and most plant life would cease from lack of CO2, taking animal life down with it, including us.
I hope you can see how insane that sounds, how insane your thinking is Dave Burton.
I wrote, “the practical residence time (or “adjustment time”) for CO2 added to the atmosphere (ignoring the “long, fat decay tail”) is about fifty years.”
In reply, Bob asked, “As ML CO2 data is 61 years old now, this means what, all the CO2 now is man-made? “
No. When Mauna Loa measurements of CO2 began, in 1958, the atmospheric CO2 level was about 315 ppmv, which was 35 ppmv above the estimated 280 ±10 ppmv “pre-industrial” level. What the 50 year “adjustment time” or “practical residence time” means is that if CO2 emissions had ceased in 1958, then in fifty years (i.e., 2008) about 63% of that 35±10 ppmv would be gone from the atmosphere, so the CO2 level would have fallen to about 293 ppmv.
(Caveat: The “about fifty year” figure is deduced from an examination of the response of natural negative feedbacks (“greening,” oceanic absorption, etc.) which remove CO2 from the atmosphere, to elevated CO2 over the Mauna Loa measurement period. My arithmetic above (calculating “293 ppmv”) uses that figure for the pre-Mauna Loa period, for which it might be inaccurate.)
You do appear to understand according to your human-dominated CO2 system that annual CO2 will eventually drop down to nearly zero production if all man-made CO2 emissions ceased, which I say can’t happen at all, as I can see the annual CO2 production is heavily dominated by natural outgassing, and thus man-made emission reductions would not have a big influence on CO2 levels or the climate (as climate is sun-warmed, not CO2-warmed).
Why doesn’t it concern you that ML CO2 is so perfectly synchronized over 61 years to the natural insolation cycle but not with anything man-made?
Why hasn’t that one clue made you doubt all the fervent man-made CO2 claims?
Bob Weber, I ma just back from a nice trip to Germany, thus somewhat late in the discussion…
The main carbon cycle is a seasonal cycle, which moves lots of CO2 in and out the atmosphere and is near entirely temperature driven. As the largest land mass is in the northern hemisphere, the cycle in the NH is dominated by land plants which use a lot of CO2 in spring/summer and release a lot of CO2 in fall/winter. Ocean temperatures make that ocean CO2 follow the reverse path, but in this case plants win the contest: higher temperatures give lower CO2 in the atmosphere…
That already shows that your basic reasoning is wrong: the seasonal change in CO2 is caused by seasonal temperature changes and doesn’t affect the long term CO2 increase at all, as the seasonal CO2 change goes in the wrong direction with temperature:
http://www.ferdinand-engelbeen.be/klimaat/klim_img/seasonal_CO2_MLO_trend.jpg
What you can see in that graph is that the seasonal amplitude hardly changed over the decades, but the residual increase did about a threefold. That is simply because human emissions increased a threefold over the same time frame and so did the natural sinks than used that extra CO2 (oceans and plants). The remaining increase in the atmosphere therefore also increased a threefold over time…
The extra CO2 did not come from warming oceans, as the solubility of CO2 in seawater only changes with about 16 ppmv/K around the average ocean surface temperature. Confirmed by over 3 million seawater samples over the past centuries and the CO2/T ratio over the past 420.000 years in the Vostok ice core. Thus the warming ocean surface is good for only some 10 ppmv increase since the Little Ice Age. That is all, the rest of the about 115 ppmv increase comes from our over 200 ppmv emissions…
Bib Weber,
May I use an analogy to a fountain, where some 1000 l/min is pumped from a drain to the fountain and that water floes back into the drain. Some maintenance man adds 1 l/min by opening a small supply and forget about it. After a while the drain gives an overflow, because of that 1 l/min extra, even if that is only 1/1000 of the main flow…
The point is that the main flow is bidirectional and more or less in equilibrium (with small changes due to temperature changes), while that 1 l/min is only input…
In the case of CO2, the seasonal changes don’t change the level of CO2 in the atmosphere after a full seasonal cycle, as long as inputs and outputs are equal, no matter how much in reality is released: as longs as as much is absorbed, the net result is zero change. That level is set by the ocean surface temperature per Henry’s law. Only the difference between inputs and outputs does change the CO2 content of the atmosphere. That difference is influenced by an extra input: the CO2 pressure in the atmosphere increases and pushes more CO2 in oceans and vegetation per Henry’s law. But that is not fast enough to remove all extra CO2 released by humans in the same year as released…
Thank you for that, Ferdinand, and happy birthday!
Ferdinand, perhaps you glossed over that I am well aware of the CO2 seasonal cycle.
Let me show you Ferdinand Engelbeen that you are flat-out wrong.
That already shows that your basic reasoning is wrong: the seasonal change in CO2 is caused by seasonal temperature changes and doesn’t affect the long term CO2 increase at all, as the seasonal CO2 change goes in the wrong direction with temperature:
I’m not wrong. I show you in that image linked above that the seasonal change responds to seasonal Nino temperature, so where was I wrong?
You are wrong Ferdinand. My image shows the seasonal CO2 change moves with seasonal Nino3, & 34 some, not so much Nino4, so how are you even right when you’ve claimed it goes in the wrong direction?
In the case of CO2, the seasonal changes don’t change the level of CO2 in the atmosphere after a full seasonal cycle, as long as inputs and outputs are equal, no matter how much in reality is released: as longs as as much is absorbed, the net result is zero change. That level is set by the ocean surface temperature per Henry’s law. Only the difference between inputs and outputs does change the CO2 content of the atmosphere. That difference is influenced by an extra input: the CO2 pressure in the atmosphere increases and pushes more CO2 in oceans and vegetation per Henry’s law. But that is not fast enough to remove all extra CO2 released by humans in the same year as released…
Here you show you know nothing useful about Henry’s Law.
The bulk of outgassed CO2 occurs 1-2 months after the temperature increases.
Henry’s Law CO2 solubility curve made from Nino3 and ML CO2 data:
The 2.1 ppm converts to 1.8 gm/kg. How about that!
CO2 is therefore mostly natural, as it conforms to natural law, Henry’s Law.
Your hand-waving tall-tale of seasonal vegetation decomposing perfectly on time every season to make the very regular seasonal CO2 curve just doesn’t cut it. Where’s your evidence for that great big hand-wave?
Carbon budgeting math lends itself to wrong creative CO2 accounting, like yours, when reliable physical principles and irrefutable natural laws are ignored and/or misunderstood.
Bob,
You make it far more complicated than necessary by looking at the changes at the seasonal level with the Nino area’s. Simply plot the derivatives of temperature, CO2 and δ13C from 12-month averages and you have removed the seasonal amplitude, which is mainly (NH) vegetation driven and opposite to the temperature changes. That the latter is dominated by land plants is easy to see in the opposite CO2 and δ13C changes, especially at ground level in the NH:
http://www.ferdinand-engelbeen.be/klimaat/klim_img/seasonal_CO2_d13C_MLO_BRW.jpg
If the oceans were the dominant factor, CO2 and δ13C would parallel each other, while we see that they change in opposite direction.
What is left if you take the derivative of 12 month averages is the response of CO2 and δ13C to temperature changes without the seasonal swings. That shows that ocean temperature changes increase the rate of change of the CO2 increase and decrease the rate of change of δ13C with a lag of a few months. That means that – again – land plants have the largest CO2 response to changing temperatures. In this case plants in the tropics, which respond negative to higher temperatures and more drought, because of changing rain patterns:
http://www.ferdinand-engelbeen.be/klimaat/klim_img/temp_dco2_d13C_mlo.jpg
During the Pinatubo eruption, the reverse pattern is visible, as lower temperatures and more light scattering enhanced photosynthesis in the tropics…
Thus on periods of 1-3 years, the CO2 increase responds to temperature changes in the same direction (opposite to seasonal changes). In both cases dominated by plant life, but that doesn’t say anything about the long-term increase of CO2.
As the whole biosphere (plant uptake and plant decay + insects + animals + humans) is a proven sink for CO2, based on the oxygen balance, they can’t be the cause of the increase in the atmosphere:
http://www.sciencemag.org/content/287/5462/2467.short
and
http://www.bowdoin.edu/~mbattle/papers_posters_and_talks/BenderGBC2005.pdf
So what causes then the increase in the atmosphere? Not the Nino area’s, which only give short living changes, not a permanent increase in temperature. You simply can’t derive a long term trend from a short term variability.
Moreover that isn’t even necessary, as the solubility of CO2 in seawater is measured by over 3 million seawater samples and its equilibrium with the above atmosphere is exactly known. See:
https://www.pmel.noaa.gov/pubs/outstand/feel2331/maps.shtml
and the next page for the overall CO2 exchange over a year, which proves that besides vegetation also the oceans are a net sink for CO2, thus not the cause of the CO2 increase in the atmosphere.
The the change in equilibrium between oceans and atmosphere with temperature is about 16 ppmv/K, that is all. See the solubility of CO2 (1 bar) in fresh water with temperature:
http://www.engineeringtoolbox.com/gases-solubility-water-d_1148.html
For seawater, exactly the same solubility for CO2 gas, according to Henry’s law, but because of the higher alkalinity about 10 times more CO2 dissolves in seawater (that is the Revelle/buffer factor) but then as bicarbonates and carbonates.
Thus all together, the Nino area’s show a good correlation with the variability of the CO2 rate of change, but that is just the noise of +/- 5 ppmv/K (or +/- 1.5 ppmv absolute) around the 90 ppmv trend since the measurements at Mauna Loa and the South Pole started, here enhanced for the 1990-2002 Pinatubo/El Niño period:
http://www.ferdinand-engelbeen.be/klimaat/klim_img/temp_co2_1990-2002.jpg
CNN – If their lips are moving they’re lying. Even some of the numbest skulls have figured that out.
https://www.breitbart.com/the-media/2019/09/11/nolte-another-week-another-ratings-collapse-at-far-left-cnn-msnbc/
“Primetime:
Fox News: 2.215 million
MSNBC: 1.408 million
CNNLOL: 869,000
Total Day:
Fox News: 1.313 million
MSNBC: 833,000
CNNLOL: 665,00
In all of cable TV during the primetime hours, Fox news came in second last week, behind only EPSN. MSNBC slid into third, while CNNLOL dropped to ninth, losing to the Hallmark Channel, HGTV, The Learning Channel, and Investigative Discovery.”
I’ve lived in Albert for 30 years. This summer is the first I can recall seeing ticks. It’s also the coldest summer I can ever remember, which followed a brutal winter.
Alberta?
I like how they completely omitted how RED hot the salmon fishing was on the Kenai Peninsula. It was record breaking.
Sockeye salmon continue to surge into Kenai River
https://www.adn.com/outdoors-adventure/fishing/2019/07/29/sockeye-salmon-continue-to-surge-into-kenai-river/
Historic run: Salmon strong at Russian River
https://mustreadalaska.com/historic-run-salmon-strong-russian-river/
Red salmon runs peaking in Seward
https://www.ktuu.com/content/news/Red-salmon-runs-peaking-in-Seward-510994491.html
For a braoder (though older) Alaskan climate issue, see this from 2015: “Baked Alaska? Propaganda film suggests children in Alaska have no snow”
I live in the Alps. The extreme temperature range is +40C to -20C, normally +35C to -10C. We have lots of ticks and usually remove one per day from the cats. They seem to survive the extreme winters very well. The ticks that is. The cats hate the snow and ice. They don’t ski.
Agree — dogs & cats here in the US central Appalachians can get ticks anytime of the year except perhaps the “cold core” of the winter when the temp does not get above freezing for days/weeks (and of course snowcover does stop them temporarily). At those coldest times the ticks are just “waiting” for it to get above freezing. And bitter cold winters don’t reduce their numbers when temps warm up. They can freeze w/o getting killed.
No evidence CO2 changes temperature…it can’t choose when to turn on or off the heat in some places and not others
https://reality348.wordpress.com/
The warmest decade in January occurred in 1979-1988. The failure to warm indicates that the much celebrated hypothetical link between carbon dioxide and atmospheric temperature is absent. Carbon dioxide is well mixed. It’s supposed effects on the temperature of the atmosphere, via ‘back radiation’ should be present in all locations, at all times, continuously. Plainly, if it skips the entire southern hemisphere, in January, for thirty years, its a furphy
Post says: There is convincing evidence that emissions of CO2 and other radiatively-active gases do have a warming effect.
Please show this convincing evidence.
Anthony’s CO2 jar experiment shows otherwise.
warmer / cooler temperatures – ARRGH! Like a https://www.google.com/search?q=fingernail+scratching+chalkboard&oq=fingernail+scratching+&aqs=chrome.
And tautologic too!
Can’t that be left with higher / lower temperatures.
Just asking.