Reposted from Chris Martz Weather
 We’ve made it three weeks without extreme weather and/or climate change hysteria making rounds on social media. Unfortunately, that streak has come to an end, making the lives of most weather forecasters like me a lot more difficult.
We are quickly approaching climatological peak of the Atlantic hurricane season¹ (September 10th) (Figure 1), thus it should be NO surprise to anyone that we have seen an uptick in tropical activity. However, I stand corrected - people are losing their minds about it.
 Figure 1. NOAA hurricane climatology.
Hurricane Dorian is now a Category 1 storm (as of the time I wrote this article – September 6 at 9:06 PM EST) with maximum sustained winds at 92 miles per hour (80 knots), and it’s quickly pulling offshore moving northeast (Figure 2).²
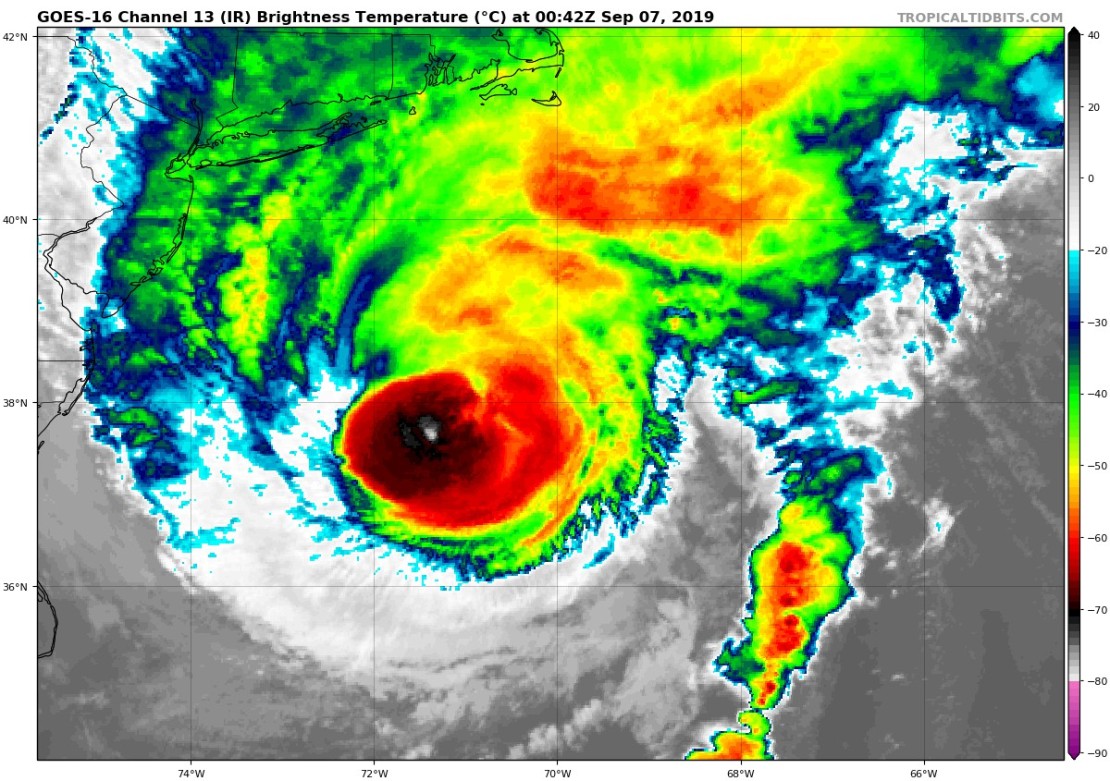 Figure 2. – NASA GOES-16 IR satellite image of Dorian. – Tropical Tidbits.
Dorian ravaged the Bahamas over Labor Day Weekend, as it stalled over Grand Bahama Island as a Category 5 hurricane. According to official reports, at least 30 people have died and unfortunately, that death toll is expected to rise in the coming days.
According to Dr. Philip Klotzbach, a meteorologist at Colorado State University, Dorian was the most intense hurricane (by wind speed and minimum central pressure) to strike the Abaco Islands and Grand Bahama.³ It was also the first Category 5 hurricane to make landfall on either island within the period of record keeping, which dates back to 1851.³ Hurricane Dorian also tied with the Labor Day (1935), Gilbert (1988), and Wilma (2005) for the second strongest hurricane on record in the Atlantic basin by wind speed (185 mph or 160.8 knots).³ The only hurricane that was stronger by wind speed was Hurricane Allen in 1980, which had maximum sustained winds as high as 190 miles per hour (165.1 knots).³
As usual, government officials, journalists, and even some meteorologists have taken these statistics and have been promoting climate alarmism about how hurricanes are becoming increasingly intense due to man-made climate change. They argue that warming oceans are providing more fuel to hurricanes, which is indeed true, however, that’s only one part of the story.
Without looking at hurricane mechanisms, it’s easy for one to be susceptible to these ideas. Therefore, it’s important we take a step back and look at the big picture.
Debunking the SST myth
I want to debunk the popular myth that has been circulating around the internet. Warmer sea surface temperatures (SST) does not guarantee that hurricanes will become more frequent or more intense.
While warm water temperatures extending from the surface down to around 150 feet (45.72 meters) below the ocean surface are required to be warmer than 80°F (26.67°C) for “fuel” for a tropical cyclone to develop,⁴ there are many other factors that govern hurricane activity not only on short-term time scales, but also decadal and millennial time scales, the latter of which I’m not going to explore in this article.
Warmer sea surface temperatures do not spontaneously spawn hurricanes. It just doesn’t work that way. Most of the time, there has to be a pre-existing atmospheric disturbance, preferably an area of low pressure where thunderstorms can form around (as that’s essentially what a hurricane is).
Low atmospheric pressure is caused by the convergence (meeting) of winds in the low levels of the atmosphere. Where these winds meet, they are forced to rise. In the Northern Hemisphere, low pressure systems spin counterclockwise as a result of the Coriolis Force. The Coriolis Force in and of itself initiates vorticity in the atmosphere whereby winds can converge at the surface.
In addition to low-level convergence, the atmosphere in the lower to mid-levels of the troposphere must be fairly saturated in order for tropical cyclogenesis.⁴ The air becomes more humid if there is more evaporation occurring, which is a function of warm sea surface temperatures.⁴ Once the atmosphere in the low and mid-levels of the atmosphere is saturated, that means clouds will form as the air reaches the dew point temperature whereby water vapor must condensate out into liquid water droplets.⁴
If there is very high thermodynamic instability, or a sharp decrease in temperature with altitude, then more condensation will occur. The more condensation that occurs releases latent heat into the atmosphere, causing it to warm up (Figure 3).⁴ As the warmer air rises and expands, it’s forced to diverge once it reaches the tropopause and flow clockwise, thereby decreasing the air pressure at the surface.⁴
 Figure 3. Latent heat and expansion of air. – WW2010.
If the outflow of winds high in the troposphere is outpacing the converging winds at the surface, the air pressure will decrease around the center of the storm.⁴ If the central air pressure in the eye decreases, the storm will strengthen.⁴
 Figure 4. Hurricane cross section. – WW2010.
The lower the minimum central pressure of a tropical cyclone is, the sharper the pressure gradient (change in air pressure with distance) will be between the eye and the surrounding environment. This sharp gradient creates an imbalance which the atmosphere tries to equalize by increasing the wind speed.
While warm sea surface temperatures, high moisture content, vorticity, and low pressure are needed for hurricane development, other factors like dry air and wind shear can drastically weaken a tropical cyclone or inhibit any tropical development altogether.⁴
If dry air is too abundant, that suppresses convection (cloud building), and if wind shear is too high, then the hurricane becomes vertically tilted or disorganized, cutting off the updrafts formed by convergence.⁴
 Figure 5. Atlantic ocean hurricane activity: high wind shear versus low wind shear. – WW2010.
Whether natural or man-made, global warming periods are known to increase the frequency of El Niño events because of the general warmth.⁵ ⁶ When there is an El Niño occuring, wind shear in the Atlantic tends to dominate preventing tropical cyclones from developing.⁵
 Figure 6. Multivariate ENSO index since 1950. – ResearchGate.
La Niña years conversely tend to produce more hurricanes in the Atlantic basin due to lesser wind shear. It is for this reason for why I think that the Atlantic basin was very quiet between 2005 and 2017. Keep in mind, hyperactive seasons like 2005, 2017, and even 2018 (not hyperactive, but bad) were La Niña years.⁷
 Figure 7. La Niña years. – Golden Gate Weather Services.
Thus, one has a really hard time making the argument that global warming will produce stronger and more frequent hurricanes in the Atlantic. There’s no sound science or statistics to back claims like that.
There are other theories that suggest that while hurricanes will NOT become more frequent or intense due to climate change, they may become more wetter. By wetter, they mean increased rainfall. This is an interesting and plausible theory. NOAA has suggested it. But, until we start to see increases in hurricane rainfall, this theory doesn’t hold water.
REFERENCES
[1] “Tropical Cyclone Climatology.” National Hurricane Center. Accessed September 6, 2019. https://www.nhc.noaa.gov/climo/.
[2] Cowan, Levi. “Current Storm Information.” Tropical Tidbits. September 6, 2019. Accessed September 6, 2019. https://tropicaltidbits.com/storminfo/.
[3] Klotzbach, Philip. “Hurricane Dorian Meteorological Records/Notable Facts Recap.” Colorado State University. September 5, 2019. Accessed September 6, 2019. https://tropical.colostate.edu/media/sites/111/2019/09/Hurricane_Dorian_Records.pdf.
[4] “Hurricanes: growth processes.” WW2010. 2010. Accessed September 6, 2019. http://ww2010.atmos.uiuc.edu/(Gh)/guides/mtr/hurr/grow/home.rxml.
[5] “Hurricanes: Interaction with El Niño.” WW2010. 2010. Accessed September 6, 2019. http://ww2010.atmos.uiuc.edu/(Gh)/guides/mtr/hurr/enso.rxml.
[6] Gale, Kaitie. “The multivariate ENSO Index.” ResearchGate. September 2018. Accessed September 6, 2019. https://www.researchgate.net/figure/1-The-multivariate-ENSO-Index-Data-source-NOAA-ESRL-Physical-Sciences_fig3_327559287.
[7] “El Niño and La Niña Years and Intensities.” Golden Gate Weather Services. July 2019. Accessed September 6, 2019. https://ggweather.com/enso/oni.htm.
Thanks for re-posting my article Charles!
“The press may not be the enemy of the people, but these days it’s not doing us many favors, either.”
Mark Hemingway
All the calamitous doom and gloom in the media cannot be helping the anxiety of those who fall victim to the false alarms. It might even be contributing to the mass hysteria and public violence that is be more frequently reported.
The picture of Dorian Gray
This one eyed monster came rolling in
with a roar of a calamitous wind
screeching and howling wreaking havoc
as the populace began to panic
dark gray clouds filled the sky
sheets of rain fall from up on high
as flying debris blows on by
trees stripped bare
homes blown away
people in despair
on their knees,deep in prayer
floods everywhere
nothing is spared
The ocean is in turmoil
as people recoil
hiding in shelters
from the treacherous waters
And after the storm
it will take years to recover
and get back to the norm
when all is calm
free from any more harm.
written by Dan Cody September 05,2019
Nice little eulogy for a hurricane. Though I don’t think very many shed any tears for it passing
Gaia’s choice… the lives of a few billion, a few million, no, a few people… persons, sacrificed for thermodynamic progress.
I had Gaia on my mind from another source. Thank you for presenting the science of hurricanes.
Chris, the biggest change I see since childhood in the ’60s is increased humidity and haze where I have always lived at the convergence of the Mississippi and Illinois rivers. [The next biggest difference to me is that air and water pollution levels are much lower than they were when I was an adolescent.] I think the oceanic cycles have caused increased atmospheric moisture, affecting the minimum temperatures, particularly during arctic winter. Am I wrong, or do SSTs largely control this?
Pop, it very well could be the increased amount of vegetation that contributes to atmospheric moisture you seem to be noticing. I was back in central IL recently in August and it was as hot and humid as I remember it.
Has WUWT done an article debunking the MSM’s accusations about trump and Alabama being affected. Quite apart from the ill-advised sharpie annotation on an old forecast, Trump was briefed by FEMA on Sun 1st, just before his Alabama tweet at 10:51EDT. The latest NOAA advisory was at 08:00 EDT and showed 5-10% chance of tropical storm winds (>39mph). He made a statement saying there was a “chance” of “very strong winds” in “a small part” of Alabama. Tropical storm winds are 39-73mph.
His tweet was on the back of the FEMA statement and when he started getting flack he said “read the full statement” which is pretty innocuous and just making sure all affected states on the map were mentioned. He obviously saw that “small part” of AL and in pursuit of completeness and caution he mentioned it.
That “small part” was about 2000sq miles on NHC advisory #33. The metropolis of Dothan, population 1/4 million, is firmly in that zone. Does the MSM think 1/4 million people shouldn’t be warned about a 5-10% “chance” of 39-73mph 1-minute sustained winds, gusting higher?
The MSM may whine that they’re not the enemy of the people but they’re certainly the enemy of Dothan, Alabama, population 1/4 million…
https://www.washingtonpost.com/weather/2019/09/06/noaa-backs-president-trump-alabama-hurricane-forecast-rebukes-weather-service-office-that-accurately-contradicted-him/
https://www.msnbc.com/rachel-maddow/watch/trump-cites-out-of-date-chart-to-justify-alarming-alabama-tweet-68215365620
All a tempest in a tea pot. No need to refute it because sane people can see how ridiculous hours upon hours upon hours of coverage of that was when there are so many real issues out there IMO. Besides, Trump seems to be doing a great job of turning it on the media using various tweets sent him. One nice side effect of sharpiegate is that it seemed to push the climate doomsayers into the back ground so they didn’t get nearly as much attention as they would usually get from a major hurricane strike. Some folks claim that was Trumps intent. Though I think Trump is a master at playing and tweeking the press I don’t believe he orchestrated that.
Judith Curry discussed (and re-posted here at WUWT) “SharpieGate” as a likely “Squirrel!!!” diversion by Trump for the ignorant Trump-hating mass media. That’s probably all the oxygen that topic deserves at this point.
https://twitter.com/realDonaldTrump/status/1170546650651271169
In 2017, the Dayton Daily News had this to say: The North Atlantic hurricane season began on June 1 and lasts through Nov. 30.
2017 has had one named tropical storm so far, Arlene, but it didn’t develop into a hurricane.It’s been 11 hurricane seasons since the last “major” storm in the U.S., classified as making landfall as a Category 3 or higher. The last one was Hurricane Wilma which struck southwest Florida in October 2005.It’s the longest stretch without a major hurricane since record keeping began.
I believe the number of years including 2017 with no major storm came to 12.
It’s a real shame that these things are ignored by people whose agenda is mostly aimed at panicking people and stirring up trouble, but it no longer surprises me.
After all, if you can’t deal with the facts, and they can’t, fabricating stuff is their only recourse, because they have nothing else.
I wonder what they’ll do with thundersnow, and lighting during heavy snowstorms with high winds.
Obviously…name the lightning strikes.
Followed by naming the rain drops.
As a child, while waiting in a parked car during a light drizzle for some adult business to be concluded, my mother tried to entertain us with a contest. Since it was only raining lightly she suggest we all be quiet and try to count the rain drops the hit the roof of the car. After about 10 seconds we al burst out laughing because even during an intermittent light drizzle there were easily thousands of drops hitting the roof of the car in a mere 10 seconds.
Based on my Ap-Hurricane RI hypothesis, the next **predicted** window for a significant outbreak/strengthening of Atlantic Basin TC’s is one Bartel rotation (27 days) of the Sun from 31 August of the previous geomagnetic disturbance from from CH 935. (It will have a new CH# then) That’s when the geomagnetic storm from the coronal hole that powered the Aug31-Sept1 Ap spike will swing around and hit Earth again (forecast at least).
But if the predicted Coronal Hole doesn’t produce a geomagnetic disturbance with Ap ≧ 20, then hurricane RI won’t happen either. So this is just a forecast — 20 days out at this point.
Forecast for next set of Atlantic hurricanes for the media to go nutso over: 26-27 September.
Once we get to October though, the prediction for the next rotation won’t hold as a La Nina state is building in the eq Pacific.
Joel: Can you post on the relationship of the MJO and your Hypothesis?
MJO has nothing to do with my hypothesis on Ap spike and Atlantic Basin hurricanes.
ENSO neutral conditions are part of the hypothesis though.
During ENSO neutral conditions (ENSO 3.4 index anomaly < |+/- 0.5| ), Geomagnetic spikes, measured as Ap spikes by both SWPC and Potsdam Center with Ap ≧20, correlates with a developed TC undergoing an Rapid Instenfication (RI) and establishment of favorable conditions acrss the Hurricane Devlopment basin for new TC to form.
the 30 day Ap forecast from NWRA/Space Weather Forecast.
https://spawx.nwra.com/spawx/27do.html
Ap spike commencing 26 Sept, peaking 28 September.
Some humorous stuff on Sharpie Gate
https://theconservativetreehouse.com/2019/09/08/president-trump-tweets-hilarious-media-video-meme/
This claim does not make sense. Winds converge because there is a low pressure area. The fundamental cause of wind is flow from high pressure to low pressure areas.
As the warmer air rises and expands, it’s forced to diverge once it reaches the tropopause and flow clockwise, thereby decreasing the air pressure at the surface.⁴
Looking at the table, all those “hyper active” years were WEAK La Niña conditions , that argues against the claim that La Nina produces more hurricanes.
This article gets worse the more I read. Don’t think we are going to be learning much about hurricanes.
I don’t think La Nina conditions “produces more hurricanes” but think it’s pretty clear that such conditions greatly reduce or eliminate the shear which creates a condition more favorable for formation and strengthening of TS,s. The SSTs had been warm in the MDR pretty much from the beginning of the season this year. Dorian formed in a neutral ENSO moving toward negative territory. That along with the MJO moving into sectors 2 and then 3 and probably most importantly the dissipation of the dry air and dust coming off Africa into the MDR all combined to help promote conditions that would allow storms to form in the MDR and then increase in strength.
By the 1st and 2nd week of August the real experts were noting all of these factors coming together that would allow the tropics to fire up
The number of hurricanes since the first week of August is amazing. The “experts” sure were right about the tropics firing up.
They were “forecasts” or IOW projections about what was coming and not what were the current conditions. That’s what experts do. Non experts like Mann, Hayhoe, etc only chase the ambulance after the fact when it comes to weather.
What I was talking about was that the table of years he chose to show went against what he was claiming. Whether La Nina has an effect or not would require more serious study than ringing three years with a sharpie. Especially when he cannot find a single strong Nina year to support the argument.
This is so lame it should not even had been reproduce here on WUWT.
The primary cause of up draft is that moist air is less dense than dry air. That simple fundamental fact does not even get mentioned. This whole article sounds like someone who spent the evening on google then tried to explain how hurricanes work.
In any case , anyone who starts out saying “I want to debunk the myth that ….” identifies himself as someone with an agenda more than someone simply out to inform.
Sure there’s a lot more to hurricanes than SST but I don’t think this guy is informed enough to explain this complex subject.
Well, he’s right about what happened in our neck of the woods [east coast of Australia south of the tropics] with the ’76 PDO. Up till then, houses were being washed out to sea from big cyclones and it had been going on for decades but since ’76 we have hardly had one and those houses are now changing hands for tens of millions. The seriously bad times have all been forgotten and they have to invent new ones.
That PDO shift was a huge step change in climate, for the better in most cases, but possibly increased drought on this side of the Pacific.
Greg September 8, 2019 at 9:12 pm
Updrafts are driven by density differences, which can be seen in the relationship between the dry and wet adiabatic lapse rates vs the atmospheric temperature profile.
You could have mentioned that the oceans are not supposed to heat the atmosphere but that the atmosphere is supposed to heat the oceans. Remember the Holy Greenhouse Effect?
Greg
There is currently no one that is capable of fully explaining hurricanes.
Examples of unanswered questions.
Intensification from depression to TS, Rapid intensification, duration. Also look at figure 1 in the head post, why at about 17th July does the number and intensity rapidly increase. Warmer SST, I don’t think so.
As Judith Curry clearly pointed out there has been no increase in knowledge on this subject for over a decade despite the spread and volume of data increases.
Perhaps you should have a go.
What with the libs calling for Dorian to hit Mar-a-Lago, I’m just disappointed that it didn’t make a proper swipe at Obama-Lago on its way past Cape Cod. The karma, gawd…
Stop lying already! No winds of even cat 3 strength were actually measured on the surface! Say it how it really is – Dorian was a cat 2 hurricane.
I can’t find surface station data for any station where Dorian’s eye wall passed over when she was at the peak of her strength. Please provide that info. I would be interested to see it. I reckoned Dorian to be a solid CAT IV based on the old, non remote generated measurements of the Saffir Simpson and the damage. Also based the estimate that in the past when I did have surface data to compare to what the National Hurricane Center was reporting, the surface data indicated that winds were in the range of 1/2 of a Saffir Simpson category less than being reported.
There’s no question in my mind that NOAA/NHC has been exaggerating hurricane strength lately. I would really like to see ground wind speed data on Dorian. They claimed Michael was a cat 5, but let’s compare their animation of what a cat 5 does with what Michael did to a house right on the beach at ground zero. If Michael was a cat 5 that house wouldn’t be there. Most of that damage is from water surge that was roof high.
NOAA animation
https://www.nhc.noaa.gov/aboutsshws.php
Damaged house on Mexico Beach
https://twitter.com/WeatherKait/status/1167404951468937217
Neighborhoods got leveled by Dorian in Abaco, but let’s keep in mind that those were probably the Haitian shantytowns that were makeshift homes. Abaco is the largest shantytown in the Bahamas. I saw videos of well-to-do people inside well-built homes with water up to the windows and even eaves during the hurricane, and their homes were obviously still standing.
http://www.haitianinternet.com/articles/bahamas-haitian-shanty-town-communities-to-be-demolished.html
I’m not so sure it’s exaggeration. I think the problems are in the technology and algorithm methodology in the use of their remote sensing. Stepped Frequency Microwave Radiometers (SFMR) from hurricane hunter aircraft is where they said they got their CAT V wind readings. The National Hurricane Center admits there are problems with both in SFMR and yet they don’t seem to be doing anything about it.
Well that’s what I meant. They’ve changed the criteria. Until recently they took the 10-minute average of wind speeds measured at a height of 10 m. Now with their microwave and GPS technologies they measure the fastest wind at higher altitudes (at least 500 m) for 1 minute. The effect is exaggerated wind speeds.
“If Michael was a cat 5 that house wouldn’t be there.”
The same applies to Hurricane Dorian. I saw plenty of houses with their roofs still on where Dorian was supposedly sitting on top of them as a Cat 5.
If it was a Cat 5, the ground should have been swept clean. All that would remain are concrete foundations of homes. The homes would be gone.
The rantings of Mann.
https://twitter.com/MichaelEMann/status/1170140378873376768
Mann demonstrated his lack of expertise and knowledge about hurricane formation and behavior when Harvey looped and loitered around Houston. Both Joe Bastardi and Roy Spencer took him to the wood shed on his declaration of why that hurricane tracked the way it did. Of course both Joe and Roy are actual Meteorologists that have studied hurricanes. Ryan Maue who Mann also trashes is a meteorologist that has studied hurricanes. Judith Curry another Mann target does not have a degree in meteorology but has done extensive study on hurricanes. Mann is neither a meteorologists nor to my knowledge has he concentrated at any time on hurricanes.
rah: “Mann is neither a meteorologists nor to my knowledge has he concentrated at any time on hurricanes.”
But he did stay in a Holiday Inn Express. No, wait…. I don’t think he’s even done that.
News reports say that hurricane Dorian, which devastated Bahamas in the beginning of September 2019 , has now approached Nova Scotia in Canada on 8 September 2019. In this context , readers may like to know this Vedic astrology writer’s much prior predictive alert in article – “ Vedic astrology predictive alerts for Canada in coming year 2019” – brought to public domain widely last year 2018 in October. One of the predictive alerts which seems to be relating to arrival of hurricane turned strong cyclone Dorian in Nova Scotia on 8 September , 2019 , reads like this in the article :-
“ 6. September –October in 2019 could bring hurricanes and storms causing massive floods and other problems in vulnerable regions-Provinces , could be one or more near Ontario , Quebec , British Columbia and Alberta. Counter or defense measures taken prior could be meaningful.”
Note :- This writers significant predictive work about the US most relevant to the ongoing times in 2019 and 2020 can be visited at wisdom-magazine.com/Article.aspx/4897/ and wisdom-magazine.com/Article.aspx/5060/.
Throughout all the coverage of Dorian the news media went on about the storm being the worst ever in the “Atlantic Basin.” I guess the Gulf of Mexico is separate from the Atlantic Basin. Yet “The Great Bahamas Hurricane of 1929” was a Cat 5 and while it didn’t stall as long as Dorian did it did take its time going through Nassau and that portion of the Bahamas. Then it made a beeline to Florida which had just suffered the year before the 1928 Okeechobee Hurricane which killed over 4,000 people.
Yes, in addition to the many variables that affect the formation and strengthening of tropical cyclones, there is also the matter of the specific location, strengths, and movements (or lack thereof) of large regional high pressure cells and low pressure cells in the atmosphere located to the north of the typical east-west pathways of Atlantic and Pacific tropical cyclones.
There was a massive amount of silly talk coming from “meteorologist” and “climate scientist” talking heads on TV the last two weeks claiming that global warming is causing hurricanes to move slower which is making them stronger.
First, there is no plausible connection between global warming and the formation and movement and relative strength of high and low pressure systems north of the tropics.
Secondly, Hurricane Dorian itself proved just the opposite of the argument that slower moving hurricanes become stronger hurricanes. Dorian completely stalled over Grand Bahama for 40 hours .. and during that time when the Alarmists claimed it was destined to grow stronger, it instead did the opposite, weakening from a strong Cat 5 to a Cat 2.
The reason, of course, is that when a hurricane slows down or stalls over the ocean, it churns up the seas underneath causing upwelling which of course brings cooler waters up vertically, thus depriving the storm of its warm water “fuel”. And that is precisely what happened with Dorian.
It is true that a stalled hurricane will tend to bring more rain onto a given area of the earth’s surface where it stalls (as happened in Houston a couple years ago) – as opposed to spreading that rainfall over a much larger area as happens with a faster moving storm … but that has zero to do with the strength of a hurricane.
A Russian nuclear powered icebreaker similarly got stymied on its annual trip to the North Pole due to thicker ice than it can break through … and had to turn around and head back home. It wasn’t “stuck” since it is an icebreaker. But that same ship had made that same trip every summer for the last decade, but could no longer do so this year.
So much for thinning ice in the Arctic.
in your ridiculous diagram the air is funneling into the “low pressure cell” at 150 mph … what keeps the low pressure cell from filling with air and stopping the hurricane ??? you cannot answer that with the “warm water did it” baloney model … the real solution is in the work of James McCanney which shows the hurricanes powered by electrical currents from the ionosphere and also this is the method used to augment and control hurricanes …
Chris Martz, thanks for the clear summary.
Not to forget:
As long as there are functioning, “living” processes / courses, there will be rules. As long as there are rules there will be exceptions, deviations. Which means:
“new records” are the RULE, not the exception.
There is significant science evidence that implies this is actually the other way round. The frequency of El Nina’s releases energy from the ocean into the atmosphere causing cooling in the Tropical oceans between about 50m and 200m depth. This energy is solar based and generally peaks when the Walker circulation is weak due to low solar activity. The ENSO clearly shows a solar link where La Nina’s dominate during solar peaks (higher activity) and El Niño’s dominate during solar troughs (lower activity).
Scientists have found strong, frequent El Niño’s during depths of Ice ages and strong, frequent La Nina’s dominating during Warm periods. This would support the evidence how ice ages form because of the doubt what provided the snowfall, but El Nino’s provide it in regions that otherwise would be very cold and dry.
The mechanism involves three stages. (dependant on timelines)
1) The short-term mechanism involves energy transferred from the ocean to the atmosphere actually increasing temperatures like observed at the surface.
2) The longer term mechanism occurs when the balance between solar energy input and energy loss to the surface and atmosphere via El Nino’s deviates from equilibrium. The constant phase of a weak Walker circulation eventually becomes a net energy loss. Reason being due to less upwelling and mixing with deeper ocean water.
3) Long term with continued low solar activity energy becomes a significant loss from the ocean to the atmosphere causing global temperatures to fall.
The planet is warmer then it should be because La Nina’s enable ocean mixing that warm more than just the near surface of the oceans. This prevents more energy loss from the surface and energy gains because it is moved elsewhere. When energy is concentrated near the surface during El Nina’s it’s more prone to being loss to the atmosphere.
The general warmth never determines an El Nino because the anomaly in ENSO will always be dependant on Tropical solar energy pooling or mixing with trade winds. This will always have significant anomaly whatever the general warmth of the planet. Therefore other then short-term there is little evidence that a warming planet causes El Nino’s. Firstly because the atmosphere only accounts for a fraction of the energy and observations are mainly based on this. Secondly, the planet has only warmed (step-up) after a strong El Nino had ended, indicating the ENSO initiated it, not the general warmth.
Sorry, didn’t notice until too late that a few El Nino’s for some reason had become El Nina’s.
Even NOAA doesn’t believe that Dorian was proof of Global Warming, but that has not stopped the alarmists from blurting it out.
See: https://www.gfdl.noaa.gov/global-warming-and-hurricanes/
Section F…
“F. Summary for Atlantic Hurricanes and Global Warming
In summary, neither our model projections for the 21st century nor our analyses of trends in Atlantic hurricane and tropical storm activity support the notion that greenhouse gas-induced warming leads to large increases in either tropical storm or overall hurricane numbers in the Atlantic. While one of our modeling studies projects a large (~100%) increase in Atlantic category 4-5 hurricanes over the 21st century, we estimate that such an increase would not be detectable until the latter half of the century, and we still have only low confidence that such an increase will occur in the Atlantic basin, based on an updated survey of subsequent modeling studies by our and other groups. A recent study finds that the observed increase in an Atlantic hurricane rapid intensification metric over 1982-2009 is highly unusual compared to one climate model’s simulation of internal multidecadal climate variability, and is consistent in sign with that model’s expected long-term response to anthropogenic forcing. These climate change detection results for rapid intensification metrics are suggestive but not definitive, and more research is needed for more confident conclusions.
Therefore, we conclude that it is premature to conclude with high confidence that human activity–and particularly greenhouse warming–has already caused a detectable change in Atlantic hurricane activity….”