Guest Essay by Kip Hansen
 I have been working on another sea level related essay and in the process stumbled upon a paper published in 1990 by the Permanent Service for Mean Sea Level (PSMSL). The title is: “On The Availability Of European Mean Sea Level Data by P.L. Woodworth, N.E. Spencer and G. Alcock (1990)”, The paper is listed on the PSMSL page of “Publications Relevant to the PSMSL and GLOSS” but is not available there. [ a .pdf is available here courtesy of the library at the University of New Brunswick, Canada ].
I am not going to comment on the data itself, other than to include the PSMSL caveat that accompanies other papers of the late 1980s. I will include a bit at the end as to what the time series might be showing.
Here are the graphs from the cited paper:

I would be remiss if I did not include the caveat that PSMSL adds to papers of this period (1980s — early 1990s):

What I see in the above is that Stockholm, an obvious outlier, has a strong downward trend — this is to be expected as Stockholm is in an area of positive (upward) Vertical Land Movement. Alicante, Spain, on the Mediterranean Sea, also had a downward trend. All the others fit nicely into the long-term global sea level rise estimate of 8-10 (some say 8-12) inches for the 20th century.
I post these graphs for the sole purpose of bringing them into the current century where they can be seen and taken into account. Note that these graphs (and underlying data, believed to be in this document) has the following features (not bugs…):
1, The data is [mostly] not in the PSMSL database . . . . therefore not generally readily or widely available.
2. The data is of Relative Sea Level (RSL) at each location.
Relative sea level is where the sea surface hits the land. Relative Sea Level is not the same as Absolute Sea Level or the Sea Surface Height (which can be thought of as the surface height from the center of the Earth — though that is not exactly so).
3. This very early data comes far before the time of recording tide gauges — so much of it is based on the eyeball method — someone looking at a tide board or an early floating tide gauge with an indicator needle on a tide staff or pole with hand-written records.
The later-half of many of the records may have been from early recording tide gauges. We don’t really know but there are documents regarding some of this data back to 1939:
Publication Scientifique No. 5 published in 1940, No.10 (1950), No.12 (1953), No.19 (1958), No.20 (1959), No.24 (1963) and No.26 (1968).
The International Association for the Physical Sciences of the Oceans (IAPSO) has pdf files of all of these at their web page “Publications Scientifiques (1931-1996)”.
4. Tide Gauges are specifically designed to measure local (at a single location) RSL at various times during the tidal cycle at that location, to discover how much water ships and boats can expect to have under their keels at any given time — to produce useful tide charts for local harbors and rivers to accompany the maritime charts which show water depth (which obviously changes with the tides) so that boats and ships do not hit anything underwater (rocks, sunken wrecks, sand and mud bottom sea and river beds, and the bars at river and harbor entrances) or go aground. Ships and boats are concerned with meters and feet of depth, not centimeters and millimeters. Tide gauges are very good at that and not so good at contributing to anything like a calculation of “global” sea mean level or its rise or fall.
5. Despite the vertical scale of the graphs being recorded and graphed in millimeters, we should acknowledge that the original measurement error must be considered quite large — 2-5 centimeters (inches) , even at the annual mean stage.
6. The individual graphs are self-consistent — though probably not fully corrected for site changes (certainly not at the mm range) — but they do give us a picture of what Relative Sea Level had been doing a the locations given over the specified time scales.
7. NOAA Tides and Currents reminds us, when comparing tide gauge based SL change graphs that “The graphs give an indication of the differing rates of vertical land motion, given that the absolute global sea level rise is believed to be 1.7 ± 0.3 millimeters/year during the 20th century.” (more recent studies use 1.9 ± 0.3 mm/yr).
# # # # #
Author’s Comment:
This essay is similar to the one posted in 2014, Historical Note: Greenwich, England Mean Temperature, 35-yr Daily Averages 1815-1849. Just an attempt to bring possibly forgotten or potentially lost data back into the light of day.
I thought it was interesting enough to share.
Start your comments with “Kip…” if speaking to me personally.
# # # # #
Kip,
Have you ever thought about cracking open the various data files developed and
supposedly archived from the 1958 International Geophysical Year reports?
Here, in the U.S. after some years passing , these files on temperatures, precipitation,
sea levels, etc., were reportedly taken over by NOAA.
The IGY reports were/are supposed to be available to the public (who paid for the
work) on request.
There might be some utility in these reports serving as a “base line” for the start
of the “global climate change” phenomenon.
An interesting side note is these various studies by world class scientists were
done during the peak of the then current solar cycle.
R.S. Brown ==> An interesting idea. If yu have any idea as to where they might be stored online, in some archive or other, drop a link here for me. Thank you!
http://www.nas.edu/history/igy/ would be a good start
Kurt ==> Thanks for the link — I’ll see what data they still have stored there.
Raw data is important. For temperature, we have seen very suspect adjustments to the official record.
Until a certain date the raw data is not digital. It is in the form of paper graphs directly created by the instruments or by hand written records. That makes it very hard to alter. The data can be digitized by scanning the original data and processing it. It’s not 100% accurate and so is a bit labor intensive. Even so, it’s way better than having no original data.
———-
https://wattsupwiththat.com/2019/09/06/historical-european-sea-level-records/
Kip, this is great work!
A footnote: that NOAA page is out of date. I’m talking about the page with the note which says, “The graphs give an indication of the differing rates of vertical land motion, given that the absolute global sea level rise is believed to be 1.7 ± 0.3 millimeters/year during the 20th century.”
At the bottom of the 30 March 2018 version of the page retrieved from archive.org, which also contains that statement, it says, “Revised: 10/15/2013”. So we know that the statement is at least that old. But since the publication of Hays et al 2015, something like a consensus has formed that that figure was too high. They’re now saying the globally averaged 20th century sea-level trend was only about +1.4 mm/year (until the satellite measurements began in 1993; the satellites give different numbers). E.g., you can see the 1/4 mm/year figure in the 2nd graph on the sea-level page of James Hansen and Makiko Sato. (My calculations put the globally averaged sea-level trend at about 1.5 mm/year.)
To further confuse things, many scientists add a 0.3 mm/yr “fudge factor,” to remove the hypothesized effect of ongoing post-glacial sinking of the ocean floor, which Prof. Richard Peltier estimates contributes 0.3 mm/yr sea-level decline. Although they call that sum “sea-level rise,” it isn’t truly a sea-level trend. Rather, it’s an estimate of what they think the sea-level trend would be were it not for the sinking ocean floor.
Of course, all those numbers are tiny. 1.5 mm/year is only about six inches per century. That’s practically insignificant, because it is often dwarfed by local factors like erosion, sedimentation, and vertical land motion.
Oops, typo correction:
“E.g., you can see the 1/4 mm/year figure in the 2nd graph”
should be:
“E.g., you can see the 1.4 mm/year figure in the 2nd graph”
(And I didn’t mean to put a link to the article at the top; that was a botched copy/paste.)
Dave, add dehydration to your “local factors like erosion, sedimentation, and vertical land motion.”. People tend to live where there is a flood plain at a river mouth where it enters the sea, and not, for instance, on the irregular cliffs and hills on either side. The sediments, as originally deposited, contain a lot of fresh water, and added sedimentation compacts the sediments and mobilizes some of this water. Then people start drilling wells and pumping out the water as potable water, and the compaction accelerates. Think of New Orleans as an example writ large, but many prominent towns, think Los Angeles here, are de-watering themselves downward. Dave, might I interpret that you are not personally concerned about a 1.5 mm/year sea level change? Think you can out-run it? I’m sure I can!
Dave ==> The long-term, tide guage GMSL rise for the 20th century had been pegged at “Several previous analyses of tide gauge records1,2,3,4,5,6—employing different methods to accommodate the spatial sparsity and temporal incompleteness of the data and to constrain the geometry of long-term sea-level change—have concluded that GMSL rose over the twentieth century at a mean rate of 1.6 to 1.9 millimetres per year. ” (That’s Hayes 2015). Most generally referred to as 1.8, but in more recent times, sometimes 1.9.
Hayes (2015) is not based on measurement but is a “Probabilistic reanalysis of twentieth-century sea-level rise” — in my opinion, it is an attempt to “lower the past” in order to make the present seem alarming.
There simply is not adequate reliable DATA to make any such claims — other than the more general statement from NOAA.
Of course, Nils-Morner would peg GMSL rise at a much lower figure.
” many scientists add a 0.3 mm/yr “fudge factor,””
…when the measured SLR is less…….2.42 mm/yr
https://tidesandcurrents.noaa.gov/sltrends/sltrends_station.shtml?id=8724580
Latitude ==> Yes, the so-called GIA adjustment is not, and never was, an increase in Sea Surface Height — it is an adjustment to sea volume-cum-would-have-been-sea-level-rise.
Kip, the elastic rebound of land upwards that was formerly under continental ice, of course involves net mass flow from below the sea bottom to land. But, the adjustment is invalid because it mixes two dimenional measure of sea level with a volumetric factor. Their resulting adjustment puts official sealevel ‘up in the air’ and therefore it has no physical basis.
I recall this was done several years ago when the graph of sealevel suddenly flattened and declined slightly. They discontinued the plot for months and finally revised it and ‘brought it up to date’ with this adjustment.
It’s the same thing that happened with Karlization of the “Pause”. It is clear that to the “Team” sea level rise and temperature rise are so important to maintain, that tampering is an agreed upon action.
Kip, has any recent study been done on Lempriere’s tidal benchmark in Tasmania?
StephenP ==> Not that I know of. That part of the world has a lot of geological motion as I understand it.
StephenP ==> For the Tasmanian issue — see this extremely long and detailed discussion — I haveno ide as to its veracity — hjust glanced at it:
https://www.john-daly.com/deadisle/
Veracity definitely is not a problem, in anything written by the late John Daly. Phil Jones glee at hearing the “cheering news” of John Daly’s untimely death in 2004 is sufficient proof that Daly was a powerful force for what is good and true.
Dave ==> Its just that I can not personally vouch for Daly’s opinions or data — don’t known enough of the locally-focused data.
The first Mean Sea Level taken at Fort Denison, Sydney Harbour by the Aust Bureau of Met in May 1914 was 1.111 meters and the last one taken in June 2019 is 1.058 meters showing a fall of 53 mm [2 inches] in 105 years:
http://www.bom.gov.au/ntc/IDO70000/IDO70000_60370_SLD.shtml
This is at a place that is adjacent to the broadest area of ocean in the world and from a site that has little vertical motion but if anything it is sinking, making that fall somewhat greater.
drongo ==> Look at their graph [ http://www.bom.gov.au/ntc/IDO70000/IDO70000_60370_SLI.pdf ]–which visually shows a slight rise over time.
The whole range, lowest to highest, is about 0.3 meter — which is the ubiquitous 10-12 inches over the century.
Kip, You are refering to the graph, while Drongo points to the data file. If one reads down the data file one gets the impression that sea level is lowering, while the graph has an obvious upward trend. You both seem correct from different points of view. My impression is that the upward trend in the graph results from a recent run of years slightly over 1.000 meters.
It’s like so much in this debate where we argue over small trends in the presence of large amounts of noise with potential biases and confounders in the data.
Kevin ==> The data table and the praph contain the same information. The PLUS side of graphics (graphs, charts, etc) is that that they make the information easier to see as a whole.
The long-term trend in the Sydney data is NOT small — it is on the scale of 0.3 meters (11-12 inches). But it is as expected and agrees with the general view of global Absolute SLR.
Kip, the actual SLR according to the graph is only 65 mm [2.6 inches] per century but the actual MSL readings don’t agree. The highest MSL was in July 1916 [1.32 meters] more than 10 inches higher than the last one in May 2019, 103 years later.
https://tidesandcurrents.noaa.gov/sltrends/sltrends_global_station.shtml?stnid=680-140
drongo ==> Yes, something funny — the BOM and the NOAA/PSMSl graphs don’t agree with one another.
Hey, Aussies: Would someone care to dig into this apparent difference? Look at the Oz BOM data and graph and the NOAA/PSMSL graphs (linked in thie thread) and see what’s up?
I eyeballed a 0.3m (10-12 inches) rise over the 120 years, NOAA says 3 inches.
This is off topic but important. Please forgive me.
On WUWT we often hear complaints about ‘pal review’ where a group of authors review each other’s papers for publication. John P. A. Ioannidis has previously pointed out that the majority of published research findings are wrong. He has a new paper in which he describes ‘citation farms’. Those are groups of authors who cite each other’s papers. The number of citations has a big effect on the career of a researcher. It leads to research funding and promotions.
A citation farm is a group of researchers who cite each other’s papers much more frequently than others outside the group cite those papers. Finding those citation farms is relatively easy because the data is available in electronic form. ie. We know who cited whose papers.
It is much harder to find out who reviewed a paper. On the other hand, the evidence of citation farms does lend huge credibility the idea that pal review is common. As far as I can tell, it’s the same phenomenon.
Yes, here’s an article:
https://www.sciencealert.com/some-of-the-world-s-most-cited-scientists-have-a-secret-that-s-just-been-exposed
There’s some discussion of it in a rather hostile forum, here:
https://science.slashdot.org/story/19/08/31/0337243/some-of-the-worlds-most-cited-scientists-have-a-secret-thats-just-been-exposed
I posted a few comments:
https://science.slashdot.org/comments.pl?sid=14686056&cid=59144492
https://science.slashdot.org/comments.pl?sid=14686056&cid=59145080
commie and DaveB ==> I have an essay in preparation on another of Ioannidis’ recent papers on Epidemiology.
There is nothing inherently wrong with self-citation, I do it here often as I find it easier to refer to my previous work through links rather than repeat everything over and over.
There is a great deal wrong with gaming the system for fame and fortune…..
However, in Scientific Controversies, one”team” will heavily cite work that supports their viewpoint — cite their own work and their pals, to make it look like their work is overwhelmingly supported.
Honest science includes citing opposing viewpoints and discussing it rationally.
The academic research field has a lot of problems…this one among them.
The CBC plays programs from international broadcasters in the middle of the night. Last night there was a program from ABC called, I think, Health Watch. It featured an interview with Ioannidis.
Ioannidis said self-citation was necessary so people could understand what was new about the paper they were reading. As you say, it’s not a problem per se.
I’m not sure whether people are gaming the system or just playing by the rules as they find them. Whatever. The system has perverse incentives. Everybody knows about them. Seemingly, nobody has a clue how to fix the problem. The result is the replication crisis where as many as 90% of published research findings are false. Lots of folks say that observation is anti-science. I don’t know any actual scientists who deny that it exists though.
commie ==> There are a lot of people working on the problems as they see them — the issues are not being totally neglected. Academic research and publishing is just a tough tough problem to get a handle on.
Research findings are not, however, false because of self- or pal-citation. The replication crisis is another whole can of worms…..seriously problematic.
I think the best comment over on slashdot was this one:
by ceoyoyo ( 59147 ) ● on Saturday August 31, 2019 @10:40PM (#59145166)
I do medical research. During my PhD I was told to include someone as a co-author because ‘we might want to collaborate with him in the future.’
A few of the journals are requiring that authors now provide a statement of their contribution to the paper. Generally they go something like this:
1st author: conceived and designed study, collected data, performed statistical analysis, wrote and revised paper.
2nd author: collected data, revised paper
subsequent half dozen plus authors: “contributed to study design and critical review of manuscript.”
The last being code for “probably got an e-mail about this, but didn’t reply.”
Dave ==> Co-authors is another issue. I have a lot of non-author mentions as “contributing to” research in another field – but even when the topic is a discovery that I myself made with a handful of others, I would never have considered asking for co-author status on a paper I did not really contribute to personally.
“It is much harder to find out who reviewed a paper.”
It is supposed to be impossible, but personally I can usually guess who the reviewers are (admittedliy in a rather narrow discipline).
tty ==> Here in this public forum — and others like it — reviewers — readers, commenters, etc — only count if they use their real-world names.
I never pay serious attention to anyone using a web handle or other type of pseudonym. Respect and accountability are closely related.
People may disagree with me — and I appreciate it — but I always use my own real name (the one I have used all my adult life) and often post my email address for those wishing to contact me personally. I wouldn’t have it any other way.
I agree in principle. I occasionally review papers, and I always indicate that my identity is not secret (when I have a choice, not all journals let you choose).
What a pity they haven’t had time to digitise the records yet.
Ve2 ==> My understanding is that it is not a matter of not digitizing the data — it is that only (for the most part) the ANNUAL means are recorded, with the monthly means missing, thus they have low confidence in the data itself — thus don’t include it in their overall data base.
I am just generally curious about WHY real-time, directly-observed, data such as this is dismissed and not used … while all manner of proxy data is invented and statistically manipulated hundreds and thousands of years after the fact of its occurrence by climate scientists? It doesn’t have anything to do with the data running contradictory to a preconceived conclusions, does it?
Kenji ==> See the link in a comment above to Hayes et al. (2015) in which measurement is abandoned (mostly) for “probabilistic” calculation…..
The BIG truth about sea level is that our measurements are 1. Local 2. Non-precise 3. Confounded by VLM and 4. Satellite sea level is accurate to a couple of cms but through computational hubris, reduced to tenths and hundredths of a millimeter.
This old data is interesting, gives us a wide perspective, but is not a basis for scientific conclusions.
Yet proxy historic data (educated guesses) is acceptable? Acceptable when contemplating the eradication of our entire culture, economic system, and energy infrastructure?
My point was … old proxy data is interesting, gives us a wide perspective, but is not a basis for exaggerating global warming and thus trashing fossil fuel use.
Kenji ==> Nothing justifies “exaggerating global warming and thus trashing fossil fuel use.”
Not quite sure what you are on about here — but this older data gives us one useful view of a very complex and controversial topic.
Tree ring (and other) proxy data for historic temperatures … which are always Shown to be lower than current temps … hence … “proof” of global warming. Which gives rise to calls for “The Green New Deal” and the elimination of fossil fuels (Candidate Biden just promised to eliminate FF by 2050).
Why is THAT proxy data sufficiently accurate to “verify” global warming … yet hand/eye measured sea level rise which contradicts the narrative is too inaccurate for reliability.
So … educated guesses about historic temperatures can be relied on as accurate, but sea level measurements are too dodgy
Kenji ==> I can’t figure out what you are on about in regards to Historical Sea Level of the EU.
Tree ring data was never a true or valid proxy for surface temperature.
This is not an essay about the overall AGW hypothesis nor the GND.
Has Kip or Dave got a comment for Spangled Drongo at 1.10 am above? That BOM Sydney data is very interesting to say the least.
Also what about Lempriere’s tidal beachmark at Tasmania’s Isle of the dead.
Kip, Dave Burton or anyone?
Neville ==> On Sydney, see the link to the data. clkick the link on that page in the upper right to the PDF of the graph. Visually, it is clearer that RSL has risen at Sydney over the century by about the expected 10-12 inches (0.3 meters). Nothing unusual there to be seen, really. This illustrates the values of long-term records. Monthly mean RSL values can vary wildly without being any indication of real sea surface height changes.
For Tasmania, see https://agupubs.onlinelibrary.wiley.com/doi/10.1029/2002GL016813
which is the best work on the issue to date.
Plenty of historical photos showing sea side landmarks. Statue of Liberty, Brooklyn Bridge, lighthouses, etc.
These photos can be compared to recent photos from the same location for the purpose of determination of sea level change.
All comparisons show zero change in sea level since the beginning of photography.
Plenty of geological surveys, geodetic measurements with maps from centuries before photography.
Comparisons to modern surveys with benchmarks, etc, also show zero sea level changes in centuries.
Certainly much less than the known tidal range for that region.
https://www.john-daly.com/ges/msl-rept.htm
bwegher ==> Sea level rise is a Modern Scientific Controversy. There are a lot of scientists trying to work out the variables.
The satellite people believe they can turn their measurements, with an acknowledged error range in inches, into precision data of tenths and hundredths of mms.
The Tide gauge people know that their RSL measurements are good to a cm or so, but that it does not translate to Global SLR.
The NOAA CORS people know that until there are LOTS of “GPS@Tide Gauge (same structure) ” sites up and running for 3-5 years, their data will not tell us about general, global sea surface height changes.
The danger is that the satellite people will prevail and panic coastal cities into acting rashly — or that the Nils-Morner crowd (no sea level rise) will forestall sensible, reasonable, necessary coastal precautions.
Summary: It isn’t that simple.
Kip Hansen
September 7, 2019 at 6:48 am
Kip, keep up the good work. The historic and ongoing minimal sea level rise is the Achilles heel in the AGW lot’s argument and where we must keep hammering at them. I look forward to all your articles as they provide so much interesting ammunition.
BTW, I think I agree about the Nils-Morner crowd…I heard him speak at the Porto Conference a couple of years ago and he does seem a bit over the top with some of his theories but sensible on others. Where do you think in particular he’s going wrong?
Alastair ==> I actually don’t think he is far off, in the final analysis. His official stance is “minimal global SLR”on the scale of 1 mm or a bit more per year. His data is good and very pragmatic — no computational hubris, no “probabilistic projections “, no dependence on satellite data accurate in inches, etc. All very “ground-truthy”.
I wouldn’t discount him at all.
His “+/- 1mm/yr” holds up well against actual GPS@TG(ss) records so far. See mine here: https://wattsupwiththat.com/2018/03/20/noaa-straight-talk-on-sea-level-rise/
Kip, I’m not sure many people really give a damned about “global sea surface height changes.” It has become just another of those trumped-up ‘catastrophes’ used by politicians seeking reelection, academics seeking additional funding and media trying to entice more customers.
Local tide gauge data is the only metric that actually counts for anyone living near the ocean or in the adjacent lowlands. It fully describes both the past and current conditions and is one heck of a lot more accurate predicting the future locally than any global metric could ever be. I’m not knocking the detailed study of global sea level in academia, just its nefarious use by those listed above.
Joe ==> Absolutely right: “Local tide gauge data is the only metric that actually counts for anyone living near the ocean or in the adjacent lowlands.”
The issues are whether or not local Relative Sea Level is ALREADY an threat with “more of the same” and what ought to be included in planning for “more than we have seen recently”.
These are not trivial questions for places like Miami Beach, Sea Level NC, Huntington Beach CA….etc.
Or for the Abacos Islands, much of which was underwater during Hurricane Dorian due to its low elevation.
I guess a lot of city folks have just gotten a bit too far from Nature. I was raised in the mountains of North Carolina. Back there we figured that anyone crazy enough to build/live in the creek bottom deserves what happens. Several years ago we had a realtor try to sell my wife, she was a city girl back then, 5 acres on a river in West Virginia. When I pointed out trash hanging 20 feet up in a couple of trees all he could do was point to a small area of about 500 sq.ft. saying: “You could put a trailer there. It’s above the flood line!” She caught on fast.
Joe ==> Thanks for the personal story. Great!
Given all the caveats with respect to site specific changes in land elevation and precision of the measurements, it is still quite apparent that current sea level rise is pretty much the same as it was back 150 years ago, long before anything remotely like current atmospheric CO2 concentrations. The industrial age may have begun by then, but more than anything, the end of the Little Ice Age in the middle of the 19th century is the primary factor in all atmospheric warming since then.
Meaning, the sensitivity of sea level to CO2 is minimal, if anything at all. Completely disproving all of the models that the Climate Alarmists have been peddling for the last 30 years.
If your model cannot “predict the past”, then it surely is worthless for predicting the future.
Duane ==> Sea Surface height, in general, is probably rising, slowly.
Coastal areas that are already at risk will remain at risk and risks will increase — but there is nothing NEW to panic about.
Miami Beach should be panicking NOW — there are at huge risk due to today’s sea level and normal tropical weather. Cocoa Beach/Cape Kennedy has just dodged the bullet again with Dorian, which, if it had continued westward would have caused unheard of destruction there. There are 10 story condos on the beachfront built on sand…..
I did not deny that sea levels are rising. I deny that sea level rise has anything to do with CO2 concentrations in the atmosphere, and I deny that sea level rise is accelerating.
As for Miami, I also deny that that city is in any sort of sea level rise crisis. At the ongoing rate of sea level rise there of 8 inches per century, it will be close to a millennium before much of the city would be inundated. Given that the city has only existed slightly more than one century, and that most of Miami was built within the last half century, there is plenty of time for dukes to be erected to protect it from any plausible sea level rise for as long as people want to live there.
After all, most of the Netherlands is below sea level and protected by dukes and pumps. Dito with New Orleans. The fact is that most ancient cities like Rome, London, Paris et al are today sitting anywhere from 10 to 30 feet higher than they sat 2,000 years ago. Over the centuries and millennia, human cities climb ever higher, building upon the bones and detritus of earlier settlements in the same spot, and more than keeping up with natural sea level rise.
No crisis for Miami due to SLR. Miami waterfront property is some of the most expensive dirt in the world. That is why it is almost 100% lined with high rise towers. If seawalls, dikes, revetments, and such are necessary to protect that dirt, its owners can easily afford to pay the tab. The buildings, roads, utilities etc themselves will grow old, outdated, and will be replaced many times over the centuries, so the costs of building ever higher, by no more than a foot or two per iteration, will simply be absorbed as normal depreciation.
People need to think in very long terms when it comes to adapting to sea level rise.
Duane ==> Miami Beach is already in crisis: https://wattsupwiththat.com/2016/12/07/miamis-vice/
Nope – there is no sea level crisis in Miami. That is simply preposterous.
Life in Miami goes on as it has for half a century. Flooding is not an issue, any more than it is anywhere else in the world. Property values are steadily increasing. New building and rebuilding is ongoing at a furious rate. People are not moving out. Nobody is dying from flood or tide events. To claim a sea level crisis in Miami is simply balderdash.
Duane==> It is generally considered improper to continue to contradict without any attempt to understand what the other person is saying.
https://wattsupwiththat.com/2016/12/07/miamis-vice/
I have written extensively on Sea Level and on Miami in particular.
Miami is one major hurricane from a real disaster and has done almost nothing to mitigate the risk.
Any coastal city in which large numbers of homes and businesses are less than 5 feet above MHW is in crisis NOW, even if they don’t know it. Miami and coastal Dade County do know it, and are struggling to come up with plans and approaches for the problems already faced.
Duane ==> ” I deny that sea level rise has anything to do with CO2 concentrations in the atmosphere” — this is not at issue in this essay.
This: “I deny that sea level rise is accelerating.” is something neither you nor I have enough data to evaluate — in my opinion., no one, at present, has enough data to evaluate the question — thus, I leave it open.
I doubt very much that global Sea surface Height is doing anything most people need to worry about — unless they live in low-lying areas already impacted by current tides and storm surges. (Or maybe if one is thinking of building a sea side nuclear power plant.,…)
Unfortunately, Miami Beach’s tide gauge has only 47 years data, ending in 1981, so the confidence interval on its trend is wide. But you can narrow it by comparison w/ Key West’s 105 year measurement record.
Key West’s sea-level trend is larger than typical, at about +2.5 mm/yr. It has seen no detectable acceleration in the last century:
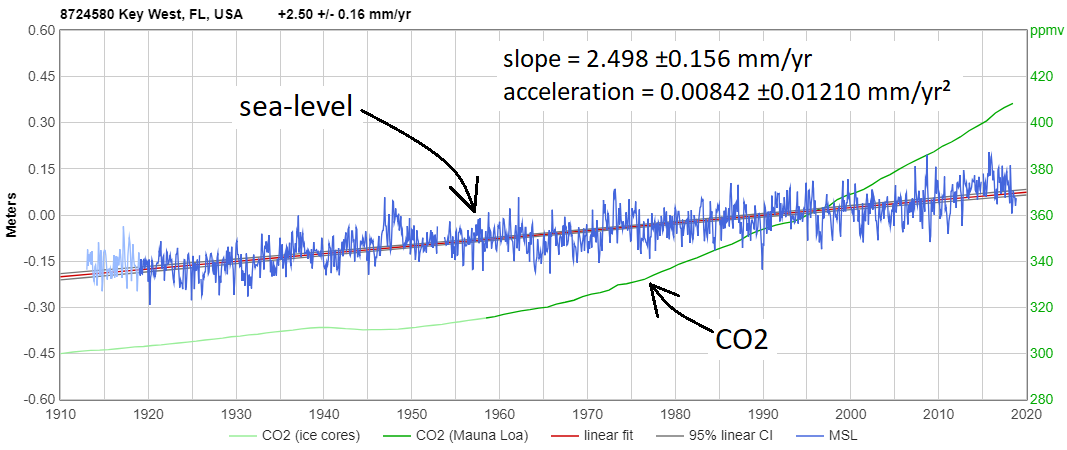
Comparing common intervals shows Miami Beach experiences 0.5 mm/year more subsidence than Key West, so the long term trend at Miami Beach is about +3 mm/yr. That means Miami Beach should expect about 11 inches of sea-level rise by year 2100.
Building to withstand that small amount of sea-level rise is not difficult. Miami’s problem is not sea-level rise, it’s that much of the city is already nearly awash.
Most structures don’t last more than a century, but, for even for those that do, sea-level rise is a nearly negligible consideration. Structures in Miami which are 6 feet above mean sea-level now will probably be only 5 feet above mean sea-level in 2100. Either of those numbers could be a problem in a 20 foot storm surge.
As for “acceleration,” if I’m being very careful, I say there’s been “no detectable, significant, sustained sea-level rise acceleration since the 1920s,” or just “no significant sea-level rise acceleration since the 1920s,” or similar. If I’m being terse I say, “sea-level rise hasn’t accelerated in nearly a century.”
However, there was a slight acceleration before then, evident in some (though not all) measurement records. As the Earth came out of the Little Ice Age, some locations measured a very slight change in sea-level trend, variously in the late 1800s or the first three decades of the 20th century.
The most dramatic example I know of is Brest, France. The sea-level trend there during the 19th century was zero, but the sea-level trend since 1900 has been +1.5 mm/year. Here’s a pair of graphs which show the difference:
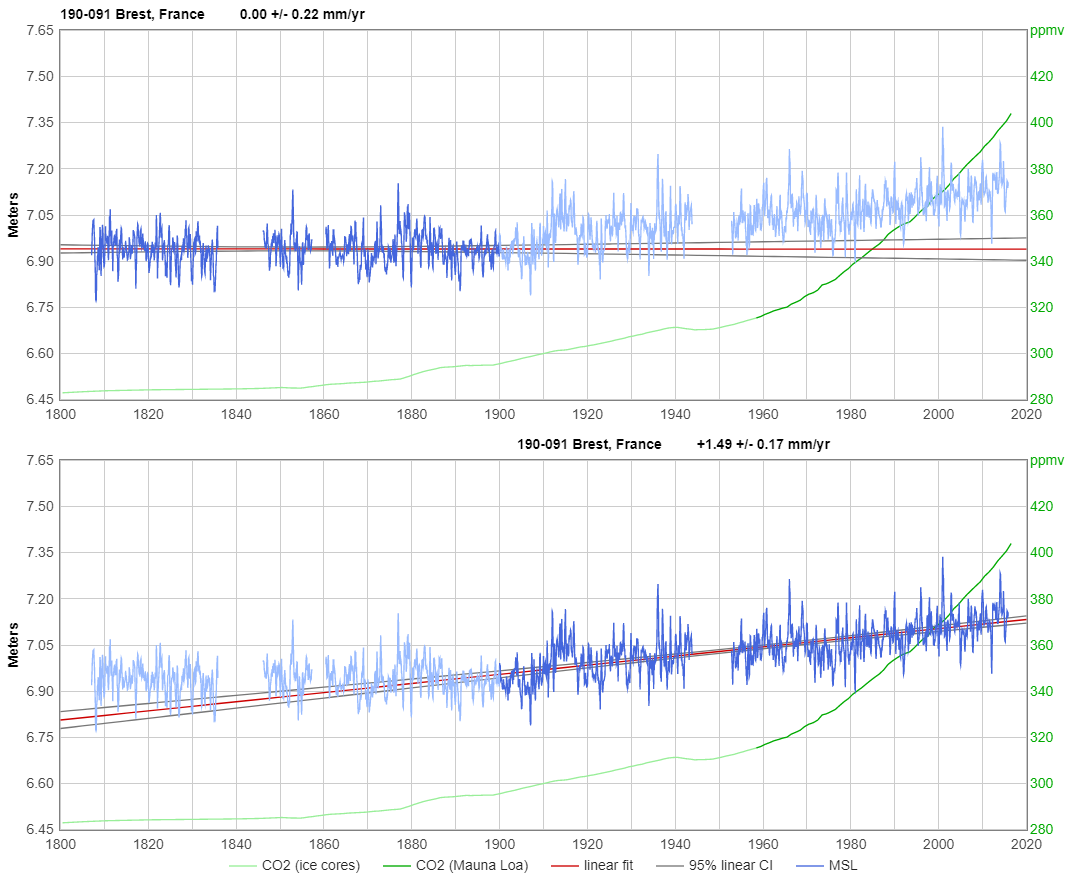
Yet, even at Brest, which saw the largest acceleration of any long, high-quality, measurement record, the acceleration was nearly negligible from a practical standpoint, amounting to a difference of just six inches per century.
Thus far, there’s no evidence of significantly accelerating sea-level rise as a result of rising CO2 levels, but it would not shock me if we did eventually see a very slight acceleration. The transition from LIA to the current climate optimum, which is generally estimated to have seen an average of about 1°C of warming, saw sea-level trends increase by at most +1.5 mm/yr (less, in most places). It is plausible that another 1°C of warming could have a similar effect, but that’s so slight that it would still have little practical significance, even if it achieved statistical significance.
Dave ==> Miami already has sea level problems . . . some parts of Miami Beach (MB) are below MHHW already (were built that way, idiotically). Most of MB ‘s infrastructure (water, sewer, phone, electric) is below sea level NOW. King Tides already flood streets and if the power is out, underground infra-structure and basements flood because the pumps stop pumping.
A land-falling hurricane from the “wrong direction” would push water north into Biscayne Bay with disastrous effect.
Miami’s problems have nothing whatever to do with “global warming” — and everything to do with local relative sea level and its steady rise, however slow.
Re-read my Miami’s Vice piece @ https://wattsupwiththat.com/2016/12/07/miamis-vice/
100% agreed, Kip.
If sea level rise is an issue, why do the nautical charts not include a datum correction? They have one for GPS.
BA charts are drawn to the nearest foot so please don’t try and claim it is a fathoms issue.
ferd ==> You are right, nautical charts, which I have used extensively and bet my life on, are in either feet or meters (depends). Ships and boats want to know how many feet/meters of water are under their keels.
Critical harbors and sea routes are re-surveyed and corrections issued on a very regular basis.
This chart — http://www.charts.noaa.gov/PDFs/12348.pdf — has updates posted at https://ocsdata.ncd.noaa.gov/ntm/resultList.aspx?Chart=12348
Because Mean RSL changes so slowly (1-3 mm per year), changes are usually reflect shifting bottom conditions, wrecks, and others hazards to navigation.
Most of the oceans of the world have not been reserveyed in 200+ years. Yet the charts remain accurate in spite of so called sea level rise.
I personally have sailed the north coast of Fiji and. Sarawak which have large areas that have never been surveyed. Ever. Scary stuff see the word “unsurveyed” on you chart.
ferd ==> Quite right (well, maybe not the 200 years part…) but oceans charts don’t need charts accurate to a meter or two (or a few feet). Harbours, channels, inlets, etc etc need accurate charts to within fractions of a meter (0.50) or feet.
I need 6 feet of water to pass safely, 8 feet to feel safe, and 3 meters if my crew is at the helm. any chart or tide table that is off by 0.5 meters can mean disaster (or at least serious damage).
I have crossed the Bahama Bank at night in both directions relying on charted depths — with a safety margin of 3 feet or so.
There are portions of the Bahamas that are not accurately charted — if you dare risk crossing over with a foot to spare — which I tried once….gads…it is your own sorry outlook!
I have sailed out an inlet (ICW to the Atlantic) over a bar passable with only an incoming three-foot swell — had to catch the swell just right or bump the sand bar. We have surfed our 40 foot cat over a bar into a tiny harbour in the DR running from a storm.
The reason there is no datum correction for sea level rise on nautical charts is obvious.
If someone says there is an extra foot of water when there isn’t, ships will be lost, Lloyd’s will become very interested, and it will expose the rotten core of modern climate science.
It is one thing to dupe the public. It is quite another to threaten the rich and powerful.
ferd ==> see my reply to your other comment.
“7. NOAA Tides and Currents reminds us, when comparing tide gauge based SL change graphs that “The graphs give an indication of the differing rates of vertical land motion, given that the absolute global sea level rise is believed to be 1.7 ± 0.3 millimeters/year during the 20th century.” (more recent studies use 1.9 ± 0.3 mm/yr).”
Well the CSIRO in Oz reckon 1.6mm-
https://www.cmar.csiro.au/sealevel/sl_hist_few_hundred.html
‘We have used a combination of historical tide-gauge data and satellite-altimeter data to estimate global averaged sea level change from 1880 to 2014. During this period, global-averaged sea level rose about 23 cm, with an average rate of rise of about 1.6 mm/yr over the 20th Century.’
Clearly we’re all doomed and everyone’s doing their shirt with coastal RE prices.
observa ==> Bouin (2010) confirmed the 1.8mm/yr: “We, in turn, confirm the value of 1.8 ± 0.5 mm yr-1 for the 20th century
average global sea level rise, and conclude that GPS is now a robust tool for vertical land motion monitoring which is accurate at least at 1 mm yr-1.”
I have maintained that these millimetric averages are fine, as long as one attaches “+/- 2 cm” or so….. Otherwise, the basic 8-12 inches per century as a maximum is acceptable to me.
“This very early data comes far before the time of recording tide gauges — so much of it is based on the eyeball method ”
All swedish data is from recording gauges from 1886/89 onwards. The Stockholm series starts in 1774. Details here (unfortunately in swedish):
https://www.smhi.se/kunskapsbanken/oceanografi/stockholms-havsvattenstandsserie-1.13499
https://www.smhi.se/kunskapsbanken/oceanografi/vattenstandsstationer-1.132796
tty ==> Interesting — from the Swedish — how many Swedish stations do they think had pen recording ?
Ten were installed 1886-89:
Ratan, Furuögrund, Draghällan, Björn, Stockholm-Skeppsholmen, Landsort, Kungsholmsfort, Ystad, Varberg and Smögen.
Kungsholmsfort is my favorite. By pure coincidence it was installed exactly on the line where absolute sea-level rise and absolute isostatic rise cancelled out in 1886. And they still cancel out.
Incidentally they were installed on the initiative of king Oscar II who had seen a similar gauge during an official visit to Germany. He was an enthusiastic sailor and very interested in everything maritime. Here is a photograph of one of the original gauges (used until 1966):
It cost 545 SEK to build in 1886 which with contemporary exchange rates would be a bit over $100.
Also interesting. The swedish recording gauges were copied from one in Pola, now a town in Croatia, but at that time the main base of the Austro-Hungarian navy. However PSMSL has no data from Pola. I wonder if they still exist in some archive in Vienna or Zagreb or Pola?
tty ==>Dig in and see if you can find out….
I am not at all interested in any polemic about how high sea level rises, let alone about what is the cause of it.
Some little details nevertheless call for clarification.
In a comment above, written by Dave Burton, I see for example:
1. “They’re now saying the globally averaged 20th century sea-level trend was only about +1.4 mm/year (until the satellite measurements began in 1993; the satellites give different numbers).”
Wether SLR is, for 1900-1999, at 1.3 or 1.4 or 1.6 mm/year is not the important point for me.
Upon downloading of the raw PMSL data, and generating – without any corrections – anomalies out of all stations having sufficient data in the reference period 1993-2013 (that one used by Church and White), I obtain for the entire century 1.3 mm/year.
Usually, tide gauge trend computations start in 1880 and end at the most recent period available at publication time. For 1880-2018, I obtain 1.4 mm/year.
Many publications will give you slightly higher trends, up to 1.6 mm/year: this mostly is due to the fact that their anomaly computations for early time observations are more complex than my simple layman’s work.
For an evaluation of what people to in order to correct raw PMSL data (what I of course did not), I recommend a patient reading of the introduction and of the methods in Church and White’s 2011 paper:
Sea-Level Rise from the Late 19th to the Early 21st Century
https://link.springer.com/article/10.1007%2Fs10712-011-9119-1
*
But the major point is on the bold emphasis of Dave Burton’s comment:
“… the satellites give different numbers.”
This is incorrect. No, they don’t.
Dave Burton’s mistake is here imho to confound a trend over the last century with the trend over the satellite reading period, i.e. 1993-now. Let us compare PMSL data with that provided by satellite readings (no GIA correction):
https://drive.google.com/file/d/1rzU5uoo-JFQoFOvKFQfDQliS5P0-VeCC/view
I suspect him a bit to be convinced that there was no acceleration in the sea level rise.
{ Some people even think that tide gauge anomalies were ‘adjusted’ in order to fit to altimetry data! }
This is incorrect. For 1993-2018, the tide gauge SLR was at 3.1 mm/year, compared with NASA’s altimetry at 3.0 mm/year, and NOAA’s at 2.9 mm/year.
Here are the sea level trends calculated out of the PMSL data for all consecutive 5 year distant periods, from 1883-2018 till 2013-2018, in mm/year:
1883-2018: 1.40 ± 0.02
1888-2018: 1.45 ± 0.02
1893-2018: 1.49 ± 0.02
1898-2018: 1.54 ± 0.02
1903-2018: 1.59 ± 0.02
1908-2018: 1.60 ± 0.02
1913-2018: 1.68 ± 0.02
1918-2018: 1.75 ± 0.02
1923-2018: 1.78 ± 0.02
1928-2018: 1.79 ± 0.02
1933-2018: 1.78 ± 0.02
1938-2018: 1.74 ± 0.02
1943-2018: 1.69 ± 0.03
1948-2018: 1.67 ± 0.03
1953-2018: 1.76 ± 0.03
1958-2018: 1.88 ± 0.03
1963-2018: 2.05 ± 0.04
1968-2018: 2.15 ± 0.04
1973-2018: 2.33 ± 0.05
1978-2018: 2.55 ± 0.05
1983-2018: 2.78 ± 0.06
1988-2018: 3.03 ± 0.07
1993-2018: 3.07 ± 0.09
1998-2018: 2.96 ± 0.12
2003-2018: 3.63 ± 0.15
2008-2018: 2.83 ± 0.27
2013-2018: 3.33 ± 0.62
Here is an averaging of all available PMSL tide gauge data using multiple reference periods to access as much of the historical data as possible:
https://drive.google.com/file/d/188SYA1fiQyAri1ZPfWZYyBd546MBvkJg/view
And here is a trend distribution among all 679 (of actually 1535) PMSL stations having shown sufficient data for the reference period 1993-2013 (one plot shows a sort of the trends calculated out of the stations’ entire lifetime, the other one shows the sort for the stations’ trends calculated within the reference period, having thus a more exact comparison):
https://drive.google.com/file/d/1-glWA_1JEuqmPDyzE2cjmeeWk-bA8ayA/view
*
Yes: all these numbers are very small. But, of course: as I wrote already, SLR of 0.5 meter matters for people living one or two meters above sea…
*
Sources:
PMSL tide gauges: https://www.psmsl.org/data/obtaining/rlr.monthly.data/rlr_monthly.zip
NASA altimetry: ftp://podaac.jpl.nasa.gov/allData/merged_alt/L2/TP_J1_OSTM/global_mean_sea_level/GMSL_TPJAOS_4.2_199209_201812.txt
NOAA altimetry: http://www.star.nesdis.noaa.gov/sod/lsa/SeaLevelRise/slr/slr_sla_gbl_free_txj1j2_90.csv
Bindidon ==> A nice synopsis — PSMSL knows perfectly well that their data is uncorrected for VLM and thus not scientifically sound for determining absolute global sea level rise. They are working on that problem.
Short-term trends are not appropriate for Global SLR calculations — as variability is on multi-decadal scales.
Kip Hansen
1. “PSMSL knows perfectly well that their data is uncorrected for VLM and thus not scientifically sound for determining absolute global sea level rise.”
Thanks for the reply, this is known to me, even if I’m no more than a simple layman.
I recently read:
Introducing a vertical land motion model for improving estimates of sea level rates derived from tide gauge records affected by earthquakes
https://link.springer.com/article/10.1007/s10291-019-0896-1
But I repeat, this time adding NOAA’s data:
https://drive.google.com/file/d/1NUueHTTWSteZoZdolMUrZTTe5ohByhO6/view
OMG! I’m probably the victim of a spurious, arbitrary pseudocorrelation, isn’t it?
*
2. “Short-term trends are not appropriate for Global SLR calculations — as variability is on multi-decadal scales..
Same reply as for (1): if two so thoroughly different measurement contexts produce so similar results, then…
*
And above all: according to your statement, we should then discard ALL climate measurements for exactly the same reason , the very first measurements being satellite based evaluations of various atmospheric layers where multi-decadal effects like AMO, NAO, PDO etc etc, play a central role.
I try to imagine Roy Spencer reading this here 🙂
Rgds
J.-P. D.
Bindidon ==> If you wish to make some point not in the literature, or from reliable sources, you’ll have to include links to the original data on the original agency web sites. Hand-crafted graphs don’t cut it.
PSMSL does know the problems with its data and has a special team assigned to the project.
Modelling VLM is a silly idea — as much as I hate to say it. Tide Gauge data MUST be corrected by “CGPS@TG attached to the same structure” to have any scientific applicability to regional or global SLR — otherwise one is simply measuring and recording Vertical movement of the tide gauge itself — subsidence, uplift, tectonic movements, etc.
One can not compute away measurement error — tide gauges measure the relationship between the sea surface and the structure to which the gauge is attached — nothing more and nothing less. One can not make the TG data represent anything else. Even to find LOCAL changes in sea surface height, one needs to correct for movement of the tide gauge itself — up or down.
I have met and talking with Spencer and would be pleased to have him read this
exchange.
If you want to discuss this further, you’ll have to supply links to original sources and post under your own real given name.
If you are an undercover international spy or something and cannot use your real name, you can email me your excuse ( my first name at i4 dot net ) and I’ll consider it.
KipHansen
I read Church and White years ago, and recall with pleasure how accurate they treated so many different problems when creating their SLR time series.
What remains amazing to me is this:
https://drive.google.com/file/d/188SYA1fiQyAri1ZPfWZYyBd546MBvkJg/view
Why does the monthly time series
– resulting from a brute force, layman-made averaging of several hundreds of PMSL tide gauges all around the world,
– lacking all corrections so carefully applied by Church and White,
nevertheless keeps so near to theirs?
Again, a spurious, arbitrary, random pseudocorrelation?
Maybe I should search for a global VLM data set…
Bindidon ==> Maybe you should post comments under your own name and supply links to original data sources?
If you think there is such a thing as a “global VLM data set” you have missed the boat entirely. it is the Tide Gauge vertical movement that has to be accounted for.
Bindidon wrote, “But the major point is on the bold emphasis of Dave Burton’s comment:
“… the satellites give different numbers.”
This is incorrect. No, they don’t. …
Here is an averaging of all available PMSL tide gauge data using multiple reference periods to access as much of the historical data as possible”
That’s a mistake, Bindidon. If you want to know whether sea-level rise has accelerated, you need to be consistent in the locations at which you measure it.
Sea level trends vary greatly from one location to another. So if you measure sea-level at two different sets of of locations you’ll usually get two different average trends.
If you compare averaged sea-level trends for two different time periods, but use different sets of tide gauges for the two periods, you would usually find two different trends even if every location had a perfectly linear trend. The two different averaged trends are not a result of acceleration, but of the fact that you’re measuring in different locations.
Different factors have biased the selection of tide gauge locations over the decades. The early measurements were mostly taken at harbors and channels, because their purpose was to help ensure that ships didn’t run aground. More recently, tide guages tend to be placed at “interesting” locations — where rates of sea-level rise are particularly high. I hope it’s obvious how that affects averages of “all available PMSL tide gauges.”
Additionally, many of the recently added PSMSL tide gauges have very short mesurement records. It is well-established in the literature that you need close to sixty years of measurements to determine a robust trend from them.
You know, it seems like we’ve had this conversation before. Hmmmm… yes, here it is:
https://wattsupwiththat.com/2019/08/09/apocalyptic-sea-level-rise-just-a-thing-of-the-past/#comment-2768951
Dave ==> Until he uses his real name, I would suggest that he/she is simply trolling…..
I now see that the Stockholm record above only comprises the period from 1889, and is therefore all from a recording tide gauge.
The earlier part from 1774 is actually the most interesting part since it clearly records the shift from sinking to rising absolute sea-levels c. 1860, there is a clear inflection in the rate of relative sea-level decrease:
One more thing about Swedish tidal gauges (and tidal gauges from the Baltic area in general).
They are not tidal gauges strictly speaking since there are virtually no tides in the Baltic. They were installed mostly for scientific reasons. The isostatic rise of the area around the Baltic has been known to locals since time immemorial and has been a subject of research (and controversy) since the days of Linnaeus in the mid-eighteenth century.
tty ==> Yes, NOAA acknowledges that tide gauges measure tides and, when compared, mostly show differences in VLM.
And I would venture to suggest that in the Baltic area it is possible to correct for VLM. In this area VLM is almost completely due to isostatic rebound from the last glaciation (the area is exceptionally tectonically stable). It has been researched for 200+ years, and is known with good precision and to be virtually linear. Also in recent decades previous estimates have been verified to be correct by GPS in a number of sites.
tty ==> VLM in general is geological — but in the case of Tide Gauges most of the vertical movement is due to subsidence either of the structure (especially piers) and docks which have often been built on fill of various types and are always (by design) at the edge of the water which washes in and out with the tides.
I don’t think “most” is accurate. The primary non-isostacy component is probably groundwater withdrawal.
Dave ==> Totally depends on the specific location. I might have more properly said “in most locations, the primary VLM is ost commonly from subsidence of the structure itself”.
The BIGGEST VLM is either earthquake readjusting the land mass (Japan, NZ?) and in some places (Jakarata) ground water withdrawl.
But, of course: as I wrote already, SLR of 0.5 meter matters for people living one or two meters above sea…
=======
If that was actually happening, ships could save billions of dollars each year by using routes that are currently too shallow.
But nowaere on the charts is there a datum correction for sea level rise, and most of the charts of the oceans are based on surveys more than 200 years old.
ferd ==> Did I already mention that all important NOAA charts are updated in “Notice to Mariners Chart Updates” from this site by chart number — inspected vessels are required to have these updates on board for areas they sail in. https://ocsdata.ncd.noaa.gov/ntm/Default.aspx
???
Thus, it is not true that most charts are based on surveys 200 years old. This chart, used my in area, has been updated s recently as LAST MONTH.
This chart, Florida to Bimini, was last corrected in July 2019.
Deep sea charts don’t have datum corrections for SLR because they don’t need them and it would not be useful to anyone. Coastal charts in important areas are updated very regularly (at least those produced by the US Government).
I do not allow my crew to use any outdated chart — always check prior to voyaging for the latest editions.
Swedish charts are updated, or at least reprinted with a warning text – which is very necessary since the relative sea level is sinking, and waters therefore getting more shallow.
And it is exaggeration to claim that most surveys are more than 200 years old, though I have seen charts where some of the soundings were made by captain Cook (whose surveys, by the way are considered extremely reliable).
In the absence of a really useful technical and scientific contradiction, I keep on my line saying that a straightforward layman evaluation of all available PMSL tide gauge data shows, since 1993, a very good match between satellite and tide gauge data.
A useful technical and scientific contradiction would be, instead of vague statements reflecting not much more than a personal meaning like “You cannot do this, you cannot do that!”, to evaluate the data according to scientifically proven principles enumerated by the contradicting person, and to show how and where the layman’s evaluation went wrong because some or all of the principles were discarded.
*
Nothing of that did happen until now. Please feel free to do so.
*
Here is again a chart comparing, for the period 1993-2013 common to all sources
– NOAA satellite altimetrry data (sorry: NASA’s link no longer works)
with
– PMSL tide gauge data from
— Church and White
— an own layman evaluation:
https://drive.google.com/file/d/1jVfcYNZCJeKu5JjEv0w3jByfhV1D7Q34/view
The layman’s evaluation shows a linear estimate just between C&W and altimetry data.
I repeat: I’m not at all interested in showing any kind of sea level rise.
My interest is only in contradicting the claim that tide gauges and satellite altimetry show clearly different trends since 1993. This is from my point of view absolutely wrong.
Estimates for 1993-2013, in mm/year:
– NOAA altimetry: 2.6 (2.9 for 1993-2018)
– layman’s PMSL evaluation: 3.0 (3.1 for 1993-2018)
– C&W: 3.6
*
I repeat: it is amazing to see that s simple evaluation of tide gauge data, taking into account neither vertical land movement, groundwater withdrawal, let alone things like ‘subsidence of the structure’, shows so similar results with C&W’s evaluation based on much deeper investigations.
You know it better? Do the job! We are all lay(wo)men here, after all, aren’t we?
*
Should any body be interested: here is a file containing an ascending sort of the linear estimates, for the period 1993-2013, of all 679 of 1535 PMSL stations having shown sufficient data for anomaly construction during that period:
https://drive.google.com/file/d/1kLZZQH-zQjkWMvwT72JxAM34cLPOUjMr/view
No wonder that Japanese tide gauges had the highest trend increases for 1993-2013 compared with the trends of their full lifetime. Some show the inverse, like the stations in the Bothnian Gulf, or… Gibraltar.
*
With the exception of Church and White’s data,
https://research.csiro.au/slrwavescoast/?ddownload=327
which I didn’t think necessary to refer to within such a thoroughly experienced forum, all sources were very well mentioned within comments above:
PMSL
https://www.psmsl.org/data/obtaining/rlr.monthly.data/rlr_monthly.zip
NOAA
http://www.star.nesdis.noaa.gov/sod/lsa/SeaLevelRise/slr/slr_sla_gbl_free_txj1j2_90.csv
An ever again recommended paper – it seems that some may prefer to tell
‘They had it all wrong”
instead of carefully reading it:
https://link.springer.com/content/pdf/10.1007%2Fs10712-011-9119-1.pdf
*
By the way, I’m surprised that the same people who never would ever have the courage to ask for the real name of Javier, have no problem in expecting the same from a completely unknown person!
How brave, really!
Like Javier but for very different reasons, I prefer to hide my name.
Anthony Watts and Roy Spencer know my real name. That’s enough.
“Some show the inverse, like the stations in the Bothnian Gulf…”
Apos, this a mistake. Two trend examples:
– Stockolm
1889-2018: -3.7 mm/yr; 1993-2013: -0.8
– Furuögrund
1916-2017: -7.9 mm/yr; 1993-2013: -4.7
Same behavior for other stations, e.g. Foglo, Helsinki, Kaskinen, Rauma, Mantyluoto,Turku, Vaasa…
No idea to what this is due in that region. Maybe commenter tty knows more.
Bindidon ==> When you are prepared to post under your own name — check back in.
Church and White 2011 is not in question — it is their scientific opinion and fairly well accepted. They expressly show about 10 inches of SLR since 1860 — no acceleration in the satellite era — their Figure 7.
J.J. Johnson
Kip
I’ve been carrying around an old book for years that
I found in my attic when living in Fla.
It’s titled; Tide Tables Atlantic Ocean,for the year 1943.
It was published by the U.S. Dept. of Commerce
coast and geodetic survey.
Would love to give it to anyone who would be interested!
J.J. ==> If it can be scanned easily (10 pages or less) you can email it to me at my first name at i4 dot net.
If you want to loan it to me, you can email be as above for a mailing address.