From Dr. Judith Curry’s Climate Etc.
Posted on September 1, 2019 by curryja
by Javier
By knowing or estimating where in the solar cycle we are we can get an estimate of the chances of a particular outcome even years ahead.
El Niño Southern Oscillation (ENSO) is the main source of interannual tropical climate variability with an important effect on global temperature and precipitation. Paleoclimatic evidence supports a relationship between ENSO and solar forcing. Moy et al. (2002) attribute the long-term increasing trend in ENSO frequency to orbitally induced changes in insolation (figure 1). The ENSO proxy record described by Moy et al. (2002) displays a millennial-scale oscillation that in the middle Holocene shifts its variance from a 1000-1500-yr period to a 2000-2500-yr period (Moy et al. 2002, their figure 1c). Both frequencies correspond to known solar periodicities, the Eddy and Bray solar cycles. As it has been shown previously (see “Centennial to millennial solar cycles“) the 1000-yr Eddy solar cycle became weaker at the Mid-Holocene Transition regaining strength in the last 2000 years. This 14C-deduced solar behavior corresponds to the ENSO behavior described by Moy et al. (2002).
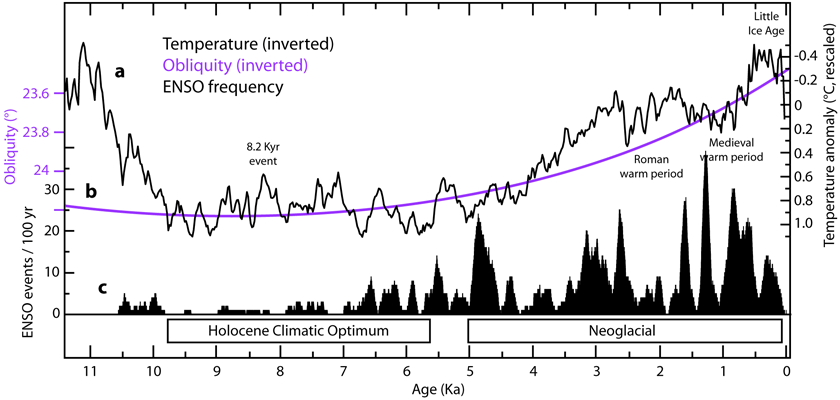
Figure 1. a) Inverted global average temperature anomaly reconstruction (black line, right scale) from the 73 proxies used by Marcott et al. 2013. The temperature scale has been rescaled to produce a difference of 1.2 °C between the Holocene Climatic Optimum (HCO) and the Little Ice Age, supported on a consilience of glaciological, biological and marine sedimentary evidence that supports a 1-1.5 °C difference. b) Inverted obliquity (purple line, left scale). c) ENSO frequency (black, left scale) measure as the number of strong El Niño events in a 100-yr sliding window, from Moy et al. 2002. ENSO activity was very low during the HCO and has been increasing as the planet cooled during the Neoglacial, following changes in insolation caused by orbital changes in precession and obliquity.
In 2000 Theodore Landscheidt published an article in the proceedings from a meeting presenting his hypothesis of a solar forcing of El Niño and La Niña. He was not the first to defend such hypothesis, as 10 years earlier Roger Anderson (1990) had published some evidence for a solar cycle modulation of ENSO as a possible source of climatic change. Landscheidt’s (2000) article contains two observations and two predictions. The first observation is that most extreme ENSO events correlate with the ascending or descending phase of the solar cycle. He predicted the following El Niño based on the sun’s orbital angular momentum for 2002.9 (± 0.4). It was a 2-year ahead accurate prediction, as the next El Niño started in 2002.67. The second observation was the alternating preponderance of El Niño and La Niña following the 22-year Hale magnetic solar cycle. The 1954-76 Hale cycle showed Niña preponderance, and was followed by the 1976-96 that presented Niño dominance. While this is based only on two complete Hale cycles for which there is instrumental ENSO data it is interesting to read Landscheidt other prediction:
“If the pattern holds a preponderance of La Niña is to be expected during the Hale cycle that began in 1996.”
The Hale cycle-ENSO association is unclear to me due to insufficient data but it is undeniable that both of Landscheidt predictions were correct. Anderson’s and Landscheidt’s articles were completely ignored by the scientific community and they are rarely cited even by authors studying the same subject.
In 2008 van Loon & Meehl showed that the Pacific Ocean displayed a response to peak solar activity years similar to La Niña event years in the Southern Oscillation, but with a different stratospheric response. Haam & Tung (2012), however, failed to find an association between solar peak and La Niña years and warned that two autocorrelated time series might present a spurious correlation by chance. As I will show the problem is in the assumption that ENSO must display a linear response to solar activity with ENSO extremes at maximal and minimal solar activity. This assumption turns out to be false and the analysis of Haam & Tung (2012) using peak-solar years is misleading.
ENSO is usually described as a 2-7-year oscillation, while the Schwabe solar cycle is an 11 ± 2-year oscillation, so no linear relationship is obvious. White & Liu (2008) defend that most El Niño and La Niña episodes from 1900–2005 are grouped into non-commuting pairs that repeat every ~ 11 years, aligned with rising and falling transition phases of the solar cycle as Landscheidt (2000) described (they don’t cite him). These alignments arise from non-linear phase locking between an 11-year solar forced first harmonic and the 3rd and 5th 3.6 and 2.2-year harmonics in ENSO. These solar-forced 3rd and 5th harmonics explain ~ 52% of inter-annual variance in the Nino-3 temperature index. White & Liu (2008) propose “a new paradigm for ENSO, with El Niño and La Niña driven by the solar-forced quasi-decadal oscillation via non-linear processes in the tropical Pacific delayed action/recharge oscillator.”
Despite the evidence for a solar forcing of ENSO the accepted paradigm from model studies is that ENSO is self-excited or driven by internal variability random noise.
More recently two solar physicists, Leamon & McIntosh (2017), reported on the coincidence of the termination of the solar magnetic activity bands at the solar equator every ~ 11 years since the 1960s with a shift from El Niño to La Niña conditions in the Pacific. Their report prompted me to examine the issue, observing a pattern repetition since 1956 (figure 2). The solar minimum is preceded by Niña conditions, followed by Niño conditions, and afterwards Niña conditions accompany the rapid increase in solar activity.

Figure 2. Top: Six-month smoothed monthly sunspot number from SILSO. Bottom: Oceanic El Niño Index from NOAA. Red and blue boxes mark the El Niño and La Niña periods in the repeating pattern. This figure was published in July 2018 in an article at WUWT. Since then the Niño prediction has been confirmed.
If we assign 50% probability for seasonal positive or negative ONI (Oceanic Niño Index) values, the probability that the solar minimum will be preceded by Niña conditions, and followed by Niño conditions for six consecutive solar minima by chance is of only 0.024% (1 in 4000). The probability of the entire pattern (Niña-Niño-Niña) repeating six times at a specific time is even lower, indicating that the association between solar activity and ENSO is not due to chance. Solar control of ENSO has led to the prediction of El Niño conditions in 2018-19 by me, and to La Niña conditions in 2020-21 by Leamon & McIntosh (2017). The 2018-19 Niño prediction has been correct.
To perform a no-assumptions analysis of solar activity-ENSO correlation it is necessary to correct for the irregularities in the solar cycle, that can last from less than 9 years to more than 13. Since the sunspot dataset is very noisy I have chosen the 13-month smoothed monthly total sunspot number from SILSO.
The smoothed monthly number results from an averaging of monthly mean values over 13 months, from 6 months before to 6 months after a base month. All months are weighted equal except for the extreme ones, which are weighted by 1/2. This smoothing has been used since the early 20th century to define the times of maximum and minimum for each cycle.
Since solar minima have different levels of activity and different length, the starting and ending months for each solar cycle are defined for the purpose of this study not from the solar minimum, but from the first month that presents >30 smoothed monthly sunspots. This point in the cycle, at the beginning of the rapid ascending phase is more unambiguously defined to a single month that the solar minimum allowing for more confidence in a proper alignment of the solar cycles.
Defined in this way the last six complete solar cycles (SC18-23) have durations between 121 and 159 months. To correct for this variable length each solar cycle is divided into 22 bins that for a regular 11-year solar cycle would contain 6 months, but depending on the cycle length they can have from 5 to 8 months. After the procedure the variable solar cycle length has been normalized into a solar cycle unit (Figure 3).

Figure 3. Thin lines, solar cycles 18-24 with their respective durations normalized in terms of a full cycle and divided in 22 bins. The average monthly smoothed sunspot number for each bin is represented as a point. Thick line, average solar activity for the normalized solar cycles. Grey area standard deviation.
The analysis is restricted to the period 1950-2018, when ONI data and the smoothed monthly sunspot number were available.
ONI values are also grouped into bins corresponding to the solar activity bins. For each 1/22 fraction of the solar cycle we have six 5-8 month sunspot bins from the six solar cycles considered, and the corresponding six 5-8 month ONI bins for the same dates. The values in each bin are averaged and the mean and standard deviation for the six bins corresponding to the same solar cycle fraction obtained. The ONI dataset has a near-normal distribution with a mean very close to zero (figure 4).

Figure 4. Distribution of the 816 twelve-month periods in the 1950-2018 ONI database according to their average ONI value. The distribution follows a near-normal distribution with a mean of 0.025.
The numerical treatment of ONI values is not expected to produce values significantly different from zero if solar activity has no significant effect on ENSO. Also ONI values are expected to deviate randomly from zero at each solar cycle fraction without presenting an 11-year pattern if solar activity has no effect on ENSO. By contrast what we find is clear departures from zero, whose statistical significance will be analyzed later, and an 11-year pattern. The 22 ONI averaged values organize in two periods of more probable El Niño and two periods of more probable La Niña (figure 5). This is likely a reflection of the non-commuting El Niño and La Niña pairs that repeat every ~ 11 years found by White & Liu (2008).

Figure 5. a) Average (black line) and standard deviation (grey area) solar activity in monthly smoothed sunspot number (left scale) for the solar cycles between 1950-2018 divided in 22 fractions of a solar cycle. b) Average (dark red and blue areas) and standard deviation (pink and light blue areas) ONI values (right scale) for the same periods. The plot has been divided in five phases (dashed vertical lines) labeled in roman numbers (see text).
Attending to ONI zero-line crossing and variability I have divided the solar cycle into five ENSO phases. Phase I starts when the peak in solar activity is reached (c. 2.5 years into the cycle as defined on average), and lasts around two and a half years during which El Niño conditions are more probable, following the peak in solar activity. Phase II, of another two and a half years length, coincides with declining solar activity. This is a highly variable period when strong La Niña conditions might take place, but during most cycles it has presented strong El Niño conditions. This might be related to the string of very active solar cycles that between 1935 and 2004 have constituted the Modern Solar Maximum, and might represent a delayed response to above average insolation. This phase corresponds to Landscheidt’s observation of strong events during the declining phase of the solar cycle that would correspond preferentially to Niña or Niño depending on the Hale cycle. Phase III, of around three years, coincides with the final decline in solar activity towards the solar minimum, and usually presents La Niña conditions. Particularly frequent is a La Niña right before the solar minimum (figure 2). Phases I to III correlate in general terms with solar activity and might represent a response to solar irradiance. The last two phases display anti-correlation to solar activity. Phase IV, a short period of about 1.5 years, starts around the time of minimal solar activity, but it results in El Niño conditions that can be considerably strong at times, like in 1998. Afterwards, phase V coincides with the period of rapidly rising solar activity, that very reproducibly presents La Niña conditions. Phase IV and V do not appear to follow changes in TSI, so the suggestion by Leamon & McIntosh (2017) that they could depend on other solar parameters or galactic cosmic rays appears reasonable. Certain solar wind properties change trend at the solar minimum, like its electric field strength, or the Alfvén Mach number that reflects plasma wave speed, that peaks at the minimum. Solar wind effects on the magnetosphere have been known for long, and solar-wind-induced changes in the global electric circuit affect weather parameters at the troposphere (Lam & Tinsley 2016).
Now we can see why Haam & Tung (2012) could not find a correlation between solar peak years and La Niña, as this condition takes place preferentially during the 1.5-2 years prior to the solar peak.
To analyze how statistically significant is the solar effect on ENSO I chose Phase V that presents the biggest ONI departure from zero and even its standard deviation range does not include the zero value. A specific procedure was followed for the statistical test. The smoothed monthly sunspot number was set to zero at the solar minimum and 100 at the solar maximum for each cycle. The months when the sunspot number increased from 35% to 80% of the maximum for each cycle were selected as they define the rapid ascent in solar activity that on average lasts one year. The 76 ONI values corresponding to those months from six solar cycles (SC19-24) have an average ONI value of -0.65. Consider this: six periods of ~ 1 year selected on a solar activity criterion display an average full fledged Niña condition. What are the chances of that? To find out I made a dataset with all the 12 consecutive months averages in the ONI database (816 instances, figure 4) and then randomly picked six of them and averaged them. I did that 100,000 times in a Monte Carlo analysis and only in 0.7% of the tests I obtained an equal or lower ONI average. The La Niña -0.65 ONI value at 35 to 80% solar activity has a 99.3% probability of not being due to chance. ENSO is under solar control.
Of course ENSO is not exclusively under solar control as it is a very complex phenomenon, and thus we shouldn’t expect that the patterns are always reproduced. However it is clear from paleoclimatic data (Moy et al., 2002), solar physics (Leamon & McIntosh 2017), Modeling and reanalysis (van Loon & Meehl 2008), frequency analysis (White & Liu 2008), and the present analysis, that solar activity has a clear strong effect on ENSO, probably being its main forcing. The reported 2-7-year ENSO periodicity appears to be an 11-year periodicity with several occurrences. The present (mid-2019) position in the solar cycle is at the transition between phases III-IV, close to the solar minimum. With some uncertainty due to the irregularity of the 11-yr solar cycle, a La Niña can be projected for phase V, by mid-2020 (Leamon & McIntosh 2017). The failed El Niño projection from February 2017 by ENSO models (figure 6) took place at the transition between phases II and III in figure 5, a time when the solar cycle favors La Niña conditions that finally developed a few months later. This is an instance when ENSO prediction from solar activity would have been superior to models.

Figure 6. ECMWF ENSO forecast for February 2017 indicating Niño conditions for late summer at a time solar activity favored Niña conditions due to the transition from phase II to III. Finally Niña conditions developed.
The solar effect on ENSO could be responsible for the detected global temperature variation of 0.1-0.2 °C between solar cycle maximum and minimum (Tung and Camp, 2008), attributed to tropical evaporative feedback (Zhou and Tung, 2013). ENSO is the leading mode of interannual variability in the tropical climate system, with a global impact on surface temperature and precipitation. Its frequency has been implicated in interdecadal shifts in the tropical Pacific climate (Kumar and Hu 2013). The latest shift in 2000 has been related to the subsequent reduced rate of warming observed during the pause, a period characterized by a higher frequency of La Niña, until the 2015 El Niño put an apparent end to it. Given the clear association between solar activity and ENSO, an interesting question is if long-term changes in solar activity could be responsible for long-term changes in ENSO frequency. To compare them, 10.7 cm solar flux data, and ONI data were smoothed with a Gaussian filter equivalent to an 11-year moving average (figure 7).

Figure 7. Gaussian smoothed 1950-2018 Oceanic Niño Index (black line delimiting red and blue areas, right scale), and Gaussian smoothed 1950-2018 10.7 cm solar flux, a proxy for solar activity (thick dashed line, left scale). A 4-year lagged 10.7 cm solar flux (thick continuous line) shows that periods of high solar activity tend to coincide with periods of predominant Niño conditions, and periods of low solar activity tend to coincide with periods of predominant Niña conditions.
Long-term changes in ENSO frequency are compatible with long-term changes in solar activity. Peaks and troughs in ENSO frequency follow with a ~ 4-year lag peaks and troughs in long-term solar activity. Since ENSO activity is clearly directed by solar activity (figure 2), it is likely that the long-term correlation between both has a physical basis. If the effect of long-term changes in solar activity has to account for this lagged long-term effect on ENSO, its effect on global temperature must be much higher that the effect detected over a single solar cycle. By altering ENSO frequencies, solar activity might alter the decadal rates of warming, leading to periods of increased warming and periods of reduced warming (pauses). The 2015 El Niño has put an apparent end to the La Niña-predominant period since 2000, and to the period of reduced warming. However, if the relation between solar activity and ENSO frequency is maintained, we can project that both should continue until long-term solar activity increases again in the future.
How can we use solar activity to improve our ENSO predictions?
Figure 5 shows a probabilistic plot of ENSO in terms of solar activity. By knowing or estimating where in the solar cycle we are we can get an estimate of the chances of a particular outcome even years ahead. This can then be compared to models output when they become available. If they disagree like it happened in February 2017 we should reduce our confidence on the model prediction, and increase it when there is agreement. Landscheidt method also deserves closer attention to examine how well it has performed since 2000. Leamon & McIntosh (2017) have predicted a Niña for 2020, and over a year ago I predicted the 2018-19 Niño based on solar activity at an article at WUWT.
It is clear that even in a crude form solar activity is useful for ENSO prediction and no doubt the method can be improved enormously as Landscheidt suggested: “these problems can only be solved by a joint interdisciplinary effort of open-minded scientists.”
Data sources and bibliography [ link]
No objection, I completely agree, but isn’t this old news?
Are you kidding? Most scientists, including some that regularly contribute to WUWT, do not accept any solar variability effect on climate beyond a small effect of ~ 0.1°C from the solar cycle.
Climate is a very complex interaction of atmospheric and oceanic fluid flow which we are just beginning to decipher the interdependencies, however since the primary (if not only) energy source is the sun, one would be foolish to assume it had little affect on the atmosphere or oceans and hence climate.
The Science is settled. The sun has absolutely nothing to do with the climate. Anybody who says otherwise is a science hater and a denialist.
Precisely, Javier
There is no truth to the video’s opening premise. The statements made by Ben Davidson regarding “TSI failures” were wrong on so many levels, and as he is not a scientist he doesn’t know how to interpret data properly, so he promotes alternative fantasy theories.
The TSI story is one of the best in modern science.
So what if some scientists say there is a ~ 0.1°C effect. The average net change from a solar cycle measured over four full cycles in the TSI record might be construed that way by someone but ignores that the strongest cycles had the largest net temperature gain, more than 0.1°C. The ocean responds to the TSI impulse at the start of a solar cycle, and thereafter the climb up to the maximum and down again following year-year TSI changes at a nominal rate of 0.5°C/Wm-2.
If there’s anything I’ve noticed over the years is Ben is never challenged by his following, and I remember him only showing up here twice, once where he only said “I am the Suspicious Observer’, and some time years later commenting to Leif, calling Willis, ‘Willy’.
Today, unless the facts change there is only a slim chance there will be a grand solar minimum. It’s just another solar minimum right now, and as long as Leif S. is right that the next cycle will be as strong as SC24, the GSM can be safely ignored past 2030, as the top of the next cycle will be warm again, with more El Nino(s), just like we’ve been talking about here on this blog.
That means our future is certainly not all cold bad news like many youtube alarmists say.
Extended low solar activity, low TSI, is going to be responsible for another very hard winter in much of the NH, not low solar wind or high cosmic rays or low clouds, no – extended low incoming energy – electromagnetic energy.
It’s a joke that Ben Davidson talks such a big game for years about electromagnetic climate forcing when he can’t even see the biggest such effect to save his life. What is going on is he is forcing his wrong ideas on people through people like you who will post the link, yet I seriously doubt he would show up here himself to argue his case, or care if you got chided like this.
Just because he says some things that are true doesn’t mean everything he says is true, and I find his audience is not very discerning and you all do not challenge him, mainly because you’re lacking data, so really, he’s just another cult-of personality figure self-promoter. He carefully controls the environment he works in so no one can challenge him in his arena.
Tiburon, I can’t stop you from promoting his pseudo-science, but if you keep posting this link here whenever I see it expect more of the same. Please consider it is junk science mixed with just enough truth for most to swallow.
What a delight it is to read this fascinating posting by Judith Curry? This is what science is all about: observing the wonders of Nature and trying to understand her better. It is most helpful to have this indication that the underlying cause of the El Nino Southern Oscillation is solar.
Hello Lord Monckton,
As you requested, on August 30, 2019 I sent you two emails on Civil RICO matters.
If you did not receive these, please contact me through my website.
Thank you.
This is what the Enlightenment is about. Bringing ideas to the table and have a discussion about them. When they attack the people behind the idea instead of the idea your are most probably facing an absolute and totalitarian human made idea(religious or ideology) ?
Based on my background in the earth sciences, I knew by 1985 that the catastrophic global warming hypothesis was false – the global cooling period from ~1940 to 1977 was sufficient evidence, since fossil fuel combustion strongly accelerated circa 1940 at the onset of WW2.
When the Mann hokey stick paper was published in 1998 (MBH98) and enthusiastically promoted by the IPCC, I knew it was fraud, because MBH98 eliminated from the historic record both the Medieval Warm Period and the Little Ice Age.
Many trillions of dollars and millions of lives have been squandered since then on global warming alarmism – the most costly and destructive fraud in the history of humanity.
I agree and the logical scientific response to that conclusion is something else caused the warming, CO2 is not a driver of climate, and so on.
As opposed to calling everyone a denier that points out the basic observational facts and there logical consequences. The Paleo record shows both hemispheres are changing cyclically at the same time which rules out solar insolation at 65N being the driver as the two hemispheres are out of phase in terms of summer solar insolation.
There are a dozen independent observations that disprove the summer solar insolation at 65N theory which is all we have plus super amplification of any forcing which is also a dead theory to explain the glacial/interglacial cycle.
What is missing, scientifically is a list and understanding of the solar mechanisms that change climate directly and indirectly, particularly for the large cyclic climate changes such as the Younger Dryas (YD is an abrupt cooling event; interglacial warm back to glacial cold for 1200 years with 70% of the cooling occurring in less than 10 years and the cooling occurred when solar summer insolation at 65N was at a maximum).
We discussed this paper at Wattsup as the editor was fired for considering publishing a paper that provide ice core data that shows there is cyclic warming in the southern hemisphere, same periodicity as the northern hemisphere, which of course has a cause and the cause is not CO2 change.
http://wattsupwiththat.files.wordpress.com/2012/09/davis-and-taylor-wuwt-submission.pdf
Davis and Taylor: “Does the current global warming signal reflect a natural cycle”
…We found 342 natural warming events (NWEs) corresponding to this definition, distributed over the past 250,000 years ….
…. The 342 NWEs contained in the Vostok ice core record are divided into low-rate warming events (LRWEs; < 0.74oC/century) and high rate warming events (HRWEs; ≥ 0.74oC /century) (Figure). …
…. "Recent Antarctic Peninsula warming relative to Holocene climate and ice – shelf history" and authored by Robert Mulvaney and colleagues of the British Antarctic Survey ( Nature , 2012, doi:10.1038/nature11391),reports two recent natural warming cycles, one around 1500 AD and another around 400 AD, measured from isotope (deuterium) concentrations in ice cores bored adjacent to recent breaks in the ice shelf in northeast Antarctica. ….
Greenland ice temperature, last 11,000 years determined from ice core analysis, Richard Alley’s paper. William: As this graph indicates the Greenland Ice data shows that have been 9 warming and cooling periods in the last 11,000 years.
http://www.climate4you.com/images/GISP2%20TemperatureSince10700%20BP%20with%20CO2%20from%20EPICA%20DomeC.gif
It is not a post by Judith Curry. It is a post by the person whose uses the nom du blog of Javier. He first posted this material at Judith Curry’s website JudithCurry.com.
Best article I’ve read here on WUWT in a long time. I’m happy that T. L finally gets an honorable mention after so many years of being ridiculed for his views.
Not completely, the coming minimum is called by a lot of concerned Landscheidt Minimum.
How are we doing on his barycentric view? It was thoroughly ridiculed by “the other side” before we realized ther was another side and how much opposition there was to really understanding what’s going on?
Long version Francisco Javier García Capitán.
Not to confound with https://www.google.com/search?q=baryonic+matter&oq=baryonic&aqs=chrome.
“these problems can only be solved by a joint interdisciplinary effort of open-minded scientists.”
It should be obvious to everyone, most of all scientists, that Dr. Theodore Landscheidt really got royally screwed over by the scientific community for his work on predictive analysis of how the Sun contributes to changing variability of weather on Earth by the change of the rotary force driving the sun’s oscillatory motion about the centre of mass of the solar system. Of course, he was dismissed as an astrologer, just as today skeptics are dismissed as deniers. I predict he will be exonerated by time.
The day I got my first 486 computer in Dec/93, the first scientific type interest papers that I downloaded was that of an obscure meteorologist who had just made an observation about the change of latex paint to oil based paint on the standard white weather box slightly changing the recorded temperatures. The other was some work by a Dr. Theodore Landscheidt (below) with his work leading up to his papers predicting a serious cooling by 2030. That was the day I became a true skeptic, since it was a lightbulb moment for me.
http://www.landscheidt.info/?q=node/302
http://bourabai.kz/landscheidt/new-e.htm
If I remeber well, T. Landscheidt predicted not only one El Niño but at least four.
http://www.john-daly.com/theodor/new-enso.htm
http://www.john-daly.com/solar/solar.htm
http://sharpgary.org/landscheidt.html
Sourde
Source (German, google translation
When I tried to find out more about Dr. T. Landscheidt on Wikipedia, there was no mention of his qualifications, only a disparaging description that he was “an author, an astrologer and an amateur climatologist”. To which was added the warning:
This article is being considered for deletion in accordance with Wikipedia’s deletion policy.
Please share your thoughts on the matter at this article’s entry on the Articles for deletion page.
Feel free to improve the article, but the article must not be blanked, and this notice must not be removed, until the discussion is closed. For more information, particularly on merging or moving the article during the discussion, read the guide to deletion.
Find sources: “Theodor Landscheidt” – news · newspapers · books · scholar · JSTOR
This article relies too much on references to primary sources. Please improve this by adding secondary or tertiary sources. (August 2019) (Learn how and when to remove this template message)”
Looks as if Dr. Landscheidt’s observations and predictions were too close to being correct for the “true believers”.
Perhaps someone knows more about him will take up Wikipedia’s challenge.
I liked your calculation of odds. So much of this is familiar but you found a unique way to describe it.
A few years ago I independently confirmed Landscheidt’s observations by identifying a ‘solar cycle onset’ El Nino (ascending) and El Nino(s) after monthly F10.7 surpasses 120sfu for a sufficient time towards/after the cycle maximum (TL’s descending), and used my finding in 2014 to predict that the pending El Nino was contingent upon the return of higher solar activity, described in my 2018 AGU poster, with a clear TSI solar cycle influence on equatorial heat content and ENSO indices. [Correlations aren’t very high because TSI is very aperiodic over 12 years.]
Since ENSO activity is clearly directed by solar activity (figure 2), it is likely that the long-term correlation between both has a physical basis. If the effect of long-term changes in solar activity has to account for this lagged long-term effect on ENSO, its effect on global temperature must be much higher that the effect detected over a single solar cycle. By altering ENSO frequencies, solar activity might alter the decadal rates of warming, leading to periods of increased warming and periods of reduced warming (pauses).
This is precisely true. Long-term sunspot activity controls Nino1234 to a very high correlation, and 30-year integrated MEI drives a very strong linear correlation to 30-year HadSST3. It’s absolutely deterministic via solar activity.
These relationships together with the others I independently developed are the core of a reliable sun-climate prediction system that is ENSO-centered. I also predicted since last year the impending Nino34 drop we are finally seeing now from very low solar activity, then onto the next cycle, where solar cycle strength models based on my F10.7cm 120sfu solar-ocean warming threshold show the expected possible top of cycle and descending phase cycle warm pulse outcomes.
The goal 5-6 years ago was to make it into a practical solar-based data-driven climate science. We’re there!
The new cycle climate response should cement all these learnings of everyone’s here for everyone else. I hope SC25 is at least as strong if not stronger than SC24, as Leif forecasts, so we can see it more clearly. SC24 has provided so many examples of solar forcing; the next one will have similar analogs to compare.
Speaking of the solar minimum and the next cycle if we haven’t reached the minimum, this cycle is now 129 months long, one month shy of the SC23 length. It’s evident SC24 slowed down very early, a record early low level.
Solar wind effects on the magnetosphere have been known for long, and solar-wind-induced changes in the global electric circuit affect weather parameters at the troposphere (Lam & Tinsley 2016).
I think these effects (and cosmic rays) have comparatively negligible climate impacts.
There are limits of course to solar-based ENSO predictions.
Who could have foreseen the last big sunspot from earlier this year, whose TSI influence on equatorial OHC is still being felt after six rotations? The spot’s TSI pattern came after a long period of very low activity that allowed TSI to dwindle down to a very small variation until the new active region exploded, which has since followed the same sunspot-TSI impulse response exhibited in over 6000 days of daily data.
This TSI activity has kept the Nino4 region going until now, and with it SST and LT and the Pac NW warm pool/arctic. Without quick new sunspot growth and TSI development, with Nino4 falling, the warmth in the northern ocean should fall by early winter, dragging everything down with it.
What made Judith Curry to post this dubious work on her site?
so science of questioning dogma and an open-mind to new data interpretations ruffles your feathers “unka?”
You’re really not a scientist. You’re likely just a hack who thinks he/she knows something about science because you have a “liberal” education background. That would be my first guess about you unka.
Joel, Unka is a passing troll who feels strong emotions upon reading some research that goes against his/her… ze beliefs. 😀
Beliefs
Emotions
Nuff said
Why is it dubious?
Dubious work only out of the sight of biased people and real science ignorants 😀
Griff
Comment:
CO2, GLOBAL WARMING, CLIMATE AND ENERGY
by Allan M.R. MacRae, B.A.Sc., M.Eng., June 15, 2019
https://wattsupwiththat.com/2019/06/15/co2-global-warming-climate-and-energy-2/
{excerpts}
6. The sequence is Nino34 Area SST warms, seawater evaporates, Tropical atmospheric humidity increases, Tropical atmospheric temperature warms, Global atmospheric temperature warms, atmospheric CO2 increases (Figs.6a and 6b).
7b. Statistical analyses support the existence of an average ~3.1 year period in the data for Nino34 SST, UAH LT temperature and atmospheric CO2, averaging ~3.6 years before year 2003.5 and ~2.5 years after 2003.5, as depicted in Figs. 7e to 7j (Excel spreadsheet) and Table 7b.
https://wattsupwiththat.com/2019/09/04/enso-predictions-based-on-solar-activity/
Javier cited the “3.6 AND 2.2-year harmonics in ENSO” here:
ENSO is usually described as a 2-7-year oscillation, while the Schwabe solar cycle is an 11 ± 2-year oscillation, so no linear relationship is obvious. White & Liu (2008) defend that most El Niño and La Niña episodes from 1900–2005 are grouped into non-commuting pairs that repeat every ~ 11 years, aligned with rising and falling transition phases of the solar cycle as Landscheidt (2000) described (they don’t cite him). These alignments arise from non-linear phase locking between an 11-year solar forced first harmonic and the 3rd and 5th 3.6 AND 2.2-YEAR HARMONICS IN ENSO.
Repeating from my June 15, 2019 paper.
The entire climate system is inter-related as stated in point 6 above – from ENSO all the way to atmospheric CO2. Changes in ENSO (among other factors) clearly drive changes in atmospheric CO2.
Have to depart now – will read the rest of the paper tomorrow.
For somebody who doesn’t fully understand this paper, can I guess and say that it is the suns solar cycle that causes weather change on earth? From cloudy days to rainy days?
Sunny, this is a very controversial issue. Most scientists believe the small changes in solar activity recorded, about 0.1% of total irradiation coming from the sun, have an almost undetectable effect on climate. However the paleoclimatic record is very clear that periods of very low (relatively speaking) solar activity associate with the coldest periods on record, like the Little Ice Age. There is also plenty of evidence that solar activity affects climatic phenomena like ENSO, precipitations, the monsoon, and so on. This evidence is disputed. The central issue is that solar activity has been high for an unusually long period between 1935 and 2000, that some call the Modern Solar Maximum. If solar activity strongly affects climate global warming could have a strong natural contribution. This is unacceptable to the proponents that we reduce our CO2 emissions to control climate.
I wouldn’t go as far as saying that the solar cycle controls weather change on Earth. It might affect the frequency and intensity of some weather phenomena, but that remains to be determined.
Javier… after reading some more comments, it seems that solar activity doesn’t really effect the weather… If not, then what causes the weather cycle to be different? I am in the uk at the moment, and a lot of people have said its been windy here, even in june/july there was a cold breeze…. I thought that the north/south flip could be effecting the weather or maybe the weak earthe magnetic field?
Well put @Javier.
can I guess and say that it is the suns solar cycle that causes weather change on earth?
The answer is yes it does. Each time TSI surges it warms at least the very top ocean layer. From those impulses that can last weeks, the now warmed from higher solar energy water is more bouyant than cooler waters which sink allowing for the upwelling of the warmer water, which also carries CO2 that will outgas at the surface as long as the temperature is high enough.
The warmer water at the surface evaporates and creates clouds, more rain, more wet extremes.
The opposite is true. Lower solar activity means fewer clouds, less rain, more drought.
I can show the solar effect on weather & climate in numerous ways, long-term or short.
The sun’s effects are related to duration of TSI extremes at short time-scales and multi-decadal periods, such as what we experienced last winter and will again this winter and until TSI rises above a certain level over time during SC25, or like the slow solar and climate decline into the early 20th century, or like the Dalton and Maunder minima.
I started out this career observing and documenting solar impacts on the weather so for me it’s second nature. I’ve been saving this subject for later after the big picture is better understood.
this is a very controversial issue.
A chain is only as strong as its weakest link. The overwhelmingly powerful TSI link to climate change is still the weakest link in the chain of human climate knowledge. I cannot push a string, I can only hammer and forge the weak links into strong unbreakable links.
after reading some more comments, it seems that solar activity doesn’t really effect the weather…
Sunny, don’t listen to the unknowing naysayers about solar influences. If people keep saying this it’s because they don’t know any better. Don’t let the weak links break the chain.
The oceans have always controlled the climate while they have been there because they possess the most energy by far on the planet and a huge source of the most important greenhouse gas water vapour that continually prevents positive feedback. How warm or cool the oceans are always naturally control the levels of atmospheric CO2.
This energy is greatly solar sourced and there direct relationships between solar and global temperatures are hidden when the ocean indirectly affects where this energy is stored and released differently around the world’s surface at different timescales.
I had many graphs and one that I had shown years ago brought to the attention that El Niño’s occurs 80%+ of time during around the minimum of the solar cycle or during relative low solar activity. The period of persistent La Nina’s especially between the 1950’s and 1970’s were during high solar activity speeding up the Walker circulation.
I disputed the NOAA prediction of El Nino for late 2019-2020 (albeit predicted as a moderate one) based purely on the lack of any volume of warm water in the system to sustain it. I noted a confounding new phenomenon over the period after the last El Nino (which itself was of unusually slow onset and with a rapid drop off after the peak) of cold water slanting equatorward from large cold water “blobs” in the temperate zones of both NH and SH adding to the cooling of the Nino SSTs rather than simply from upwelling cold water in the eastern Pacific.
I think much can be refined in predictions by assessing warm and cold water volumes involved in the process. As an old geologist, Ive noted over a couple of generations the tendency of scientists to gather data remotely à la space science, largely to the exclusion of fieldwork that has “smoothed” the appearance of regional geological maps. I objected to a geological compilation done a few decades ago in northern Manitoba where they smeared the geological contacts of formations determined in the field to accommodate the remotely sensed geology pinned with a few chopper hopped visits in large areas (one area I had mapped had been flooded by a very large hydro project). I pointed out the remote sensing was the tail wagging the dog in this work.
I think climate science, maybe all of science, could benefit from a bit more ground truthing despite the admittedly marvellous remote tech. Clearly an old Fuddy Duddy point of view.
Absolutely. In fact the best ENSO predictor is warm water volume in the East Pacific
https://www.pmel.noaa.gov/elnino/upper-ocean-heat-content-and-enso
It is now decreasing fast.
Many thanks, Javier. Nice to have my instincts verified re measured warm/ cold water volumes. I do, still, think the cold water entrained from the cold water blobs in the the northerly and southerly areas of the Pacific went unnoticed in NOAAs El Nino predictions because it was not part of the usual narrow “closed” ENSO system in this unusual development. We can’t be complacent in following our protocols.
From this development, I too predicted a drop into La Nina conditions during the period of the NOAA prediction of a moderate El Nino.
WWV
Equatorial Pacific and Ocean Indices.
This will appear in “An even more inconvenient truth” by Al Gore as, “it’s even worse than we could ever imagine, Carbon Dioxide drives the Earth’s temperature causing El Niño/ El Niña which affects the solar output, the science proves it. Here are the graphs”
Seriously, there appears to be a massive feedback loop, solar activity appears to be driving weather events, with the relative positions of Venus, Earth and Jupiter triggering the solar activity due to their individual orbital mechanics.
More so the outer planets, Jupiter and Saturn, and to a lesser extent, Uranus and Neptune. The giant planets, which regulate the sun’s motion about the centre of mass, carry more than 99 percent of the angular momentum in the solar system.
The problem is that in any complex non-linear system everything affects everything. Until we understand the role of everything and can model everything, forecasts are simply impossible and picking out the influence one factor pretty much impossible. And as I have said many times before about models, unless you know pretty accurately starting conditions, models will rapidly move away from reality – and we can’t know starting conditions at all accurately.
As with much of economics, we are applying wholly inappropriate tools to make forecasts that simply cannot be right by anything other than dumb luck.
Reductionist models will not work on the climate.
Correct. The first step is to identify the factors that have a noticeable effect.
Despite being the result of simple first principles, tides were notoriously difficult to predict due to the complexity of the system. The solution was to decompose the tide record at each location in its harmonic constituents and use brass machines with multiple gears to produce in a few hours a one year tide prediction for that particular location.
A similar process goes into predicting ENSO. Models incorporate everything known to affect ENSO, but the solar effect is one of several forcings that has not been properly incorporated. I have little doubt that ENSO prediction can be improved greatly if we have an open mind about what affects ENSO.
The relationship between the solar cycle phase and the ENSO events as they are shown in Figure 2 are quite clear. In only one case of nine cases, this relationship does not work.
I made a quick summary of ONI being in categories very strong or strong and totally since 1950 there are nine cases. Only four cases can be classified to be related to this solar activity relationship and five cases are not related. Therefore I ask, what is the general meaning of this finding if more than 50 % of strong and very strong ENSO events are not related to the solar activity trend? For me, it means that there are other unknown forces that have even greater impact on ENSO events than the Sun.
It is clear that the strength of an ENSO event cannot be predicted on the basis of solar activity. It is reasonably to think that the strength of Niño events must necessarily depend on the amount of warm water accumulated at the subsurface of the tropical Pacific. Then it should be obvious that it is important if the previous seasons have resulted in an accumulation or a reduction of warm waters. I defended over the past years that the 2016 strong El Niño had reduced warm subsurface water volume so much that another strong Niño was not possible. The two subsequent Niños have been very weak, the first one barely qualifying as an El Niño. On the basis of solar activity and Pacific Ocean warm water situation I am predicting a strong 2-year Niña next. It should be fun if I am correct.
Great report, Dr. Judith. It will be interesting to follow the ability to predict ENSO conditions as the Niño-Niña phase has major consequences here in South America, and for sure in Mendoza, Argentina where I live most of the year. For sure when there is a Neutral or weak ENSO we lose the latitudinal winds and therefore lose the protection against South Polar cold winds. A week ago I commented about ice on palm trees here, and we just had a killing freeze of minus 3C. The wine specialists I talk to say they watch ENSO closely as their harvest, both quantity and quality, is closely associated with ENSO conditions, so the importance of predicting ENSO conditions is a matter of life or death.
Im watching the enso meter got to neutral and feeling happy
will be ecstatic if she moves into the minus side
Australia NEEDS rain badly.
Sorry but China already bought up the water rights to ship it out as bottled water.
Interesting, but I don’t see any clear correlation. This suggests that if solar is having an affect, its affect is co-determined by some other factor which is introducing variation that cannot be explained by solar.
If the correlation was strong it would have been detected decades ago. It is obvious that ENSO has multiple factors affecting it. This article is about solar activity being one of those factors and it is important because solar activity is denied any significant effect on climate by most climate scientists and one prominent solar physicist.
Since we don’t know how solar activity affects ENSO and with a few exceptions climate scientists didn’t even think it was possible, it means that we are missing how solar variability affects not only ENSO but the entire climate system. That’s why most climate scientists will refuse to accept the evidence that solar activity exerts a control on ENSO. Doing so means opening a can of worms and destroying the settled science argument.
How about also looking at solar magnetic effects and not just TSI? There maybe some , as yet unidentified, magnetohydrodynamics effects that could help in explaning how the ocean responds to the sun. Salt water in a moving conductor so there could be something electromagnetic going on.
Total TSI may only vary by .1% or so, but when the Sun is very active, there is an increase of up to 16% UV, which also penetrates the ocean water deeper with additional warming. The increased energetic UV causes more warming in the Pacific waters which is what drives an El Nino. When the Sun goes quiet, much less UV and perhaps .1% less TSI and the Pacific doesn’t warm as much, which drives a La Nina event since the ocean surface is cooler because of less heating and more mixing with deeper upwelling water. I assume the same effect in all the worlds oceans, but the Pacific is by far the largest ocean so the Nino/Nina oscillation is greatest.
The increased energetic UV causes more warming in the Pacific waters which is what drives an El Nino.
The sun’s spectrum absorbed by the ocean shows blue-green wavelengths carrying vastly more energy and penetrating deeper than the energy content in the 15% UV variation.
The equatorial heat content that defined the 2014-16 El Nino period was directly controlled by TSI, dropping below the zero anomaly concurrent with the crossing of daily dropping below my prior empirically derived TSI ocean warming threshold of 1361.25W/m2 SORCE TSI, as shown.
You talk about an effect like that ?
Weak influences of the Earth’s magnetic field on ocean circulation
I can accept there may be some connection via induction to move the water but think of the power necessary to do that. We could do an experiment to test this. Put a 55gal drum of saltwater under a heat lamp controlled to mimic a daily insolation cycle, and see if the temperature changes with any of your favorite space weather indices. Let’s use the Kp index. When Kp is in the red, from 5-9, that saltwater in 55gal drum should warm up or circulate if the thoery holds.
In reply to:
“If the correlation was strong it would have been detected decades ago.”
It is a constrained problem. There is a physical solution. There is sufficient observational evidence to solve this problem which requires physical mechanisms.
If there is no solution to a physical problem, there are often paradoxes concerning other items that are physically related.
There is a hard observational paradox that correlates exactly in time as the recent warming period (post 1997) and correlates with the ENSO changes in this period which is almost impossible to be a coincident.
There should be a physical explanation for everything.
I too appreciate the wisdom and careful thought behind this analysis. The validation, in part, of the work of Theodor (I think he spelled it with no “e”) Landscheidt and Fairbridge and others. [Fairbridge, like Lindzen, was a famous climate scientist who the MSM were trained to ignore for failing to follow what Monckton calls, “the Party line”.]
This analysis is a careful consideration of coincidence and not cause. Both Landscheidt and Fairbridge were constantly speculating about the cause of the change in solar activity which subjected them to the slings and arrows of the solar modelers. Oh well. They rest in peace.
The inner workings of a model are not as important (though just as interesting) as being able to make reliable predictions of something as arcane as the temperature anomaly of a certain region of the tropical Pacific Ocean. At last a model that works.
Didn’t Landscheidt predict the April 2003 Niño more than three years advance? I recall him chuckling at the time because the Australian ENSO people couldn’t see it five months out. They were watching temperatures while he was basing his predictions on his heretical solar “cause”.
Lovely read. Kept me up late.
So Crispin is actually at home for once…?
R
Why does everyone leave out the angle of the axial tilt in this?
It does make a difference. Moves one degree every 72 years. Now the northern end of the Earth’s axis is out of Sagittarius and in Ophiuchus (the snake wrestler) and the one degree change in the axial tilt may have a slow but long-term effect on the weather, especially with a dormant sun. It does matter. It matters on a seasonal change basis and it matters on a long-term basis.
So why is no one looking at this at all?
Aren’t these what the Milankovitch cycles are all about?
The axial tilt doesn’t change one degree every 72 years. More like one degree every 10,000 years. Look at figure one purple curve.
It is Axial Precession that changes one degree every 72 years, regressing annually 1/72 degree against the ecliptic in an average 23,000 Great Year cycle. This must also affect how much solar insolation is available for any point on Earth as part of that Milankovitch cycle, since in 10,500 years is exactly opposite to what it is today and is the quickest changing orbital cycle that affects long term climate change due to the constantly changing perspective of how Earth receives it’s solar insolation.
https://en.wikipedia.org/wiki/Axial_precession
In the hard sciences, it is not uncommon for aspiring authors to tabulate beforehand the known main variables that might influence outcomes. If there is one that has too little data or knowledge, the experiment does not proceed.
A day or two ago there was a WUWT item about several hundred metres of sediment from Lake Ohrid, Albania. The authors made a reasonable job of understanding fundamentals before proceeding, but it might have been nice, for example, to discuss these. Like, what the effect of agriculture might be on changing incoming sediment; on why they could presume some constancy, or absence of drift, in input and output water flows, of how the area of sediment deposition changed as the lake aged and whether this was significant. It would have been good to drill 3 holes and examine reproducibility instead of analysing one hole to death, but sometimes money limits.
I seem to be expressing this badly, but I miss justification for ignoring some basic potential variables, or at least assuming constancy, when it would be prudent to assume that slow drift over the 3 million years is to be expected rather than ignored.
In my first post graduate job, in CSIRO Plant Nutrition, I saw a senior researcher lambasted by the Chief for assuming that some minor nutrients would act constantly in a factorial experiment, as opposed to including them as variables – and increasing the experiment size by a factor of 8. He was accused of taking short cuts, of making unjustified assumptions that could have invalidated the whole experiment.
These days, in reading about climate research, several papers a day, I see this defect in experimental design time after time and conclude, sadly, that it has become commonplace.
It is this change in rigour that I hold partly responsible for the poor quality of climate research. Another is poor use of error analysis. Another is a common lack of education in the classics, like logic. But unwise assumptions in experimental design, the good enough for government work syndrome, is a major problem.
Geoff S
(Edited for spacing) SUNMOD
Geoff: A comment of mine on the drilling (mostly a nostalgic excursion) referred to my arriving at Lake Ohrid in summer 1964 in an absolutely blinding downpour that lasted for hours. I thought this might have deposited a millimeter or more!
You are absolutely correct that an assumption of uniform varves of sediments across the bottom of this large lake is a risky one. A second and third hole would have been not as costly as you may think. They would already have paid the considerable sunk costs of planning, shipping, assembling and testing such a rig, all the mob and demob of personnel, etc. Core drilling in hard rock in the mining industry is about $100/m. Perhaps in unconsolidated sediments it might be more, say 200. They drilled ~250m of sediments in 300m of water. At $200/m it would be $50,000 per hole after sunk costs.
I hope they weren’t thinking that having potential variation in the sediments would make for an inconclusive study, or one with blurred “conclusions”. Actually I think it was academe’s lack of familiarity with the business end of such work.
Yes! The next important step is to take it to a grouped, multi-cycle level such as cycles 12-16. The only problem with that is the much lower number of data points to work with in grouped form.
Note that Leif’s argument of a stronger cycle coming next (25) still fits in the range of variation seen in the cycle 12-16 group.
slide 18
https://leif.org/research/Prediction-of-SC25.pdf
Thus the problems for global climate correlation are 1) limited data points from grouped cycles and 2) lags involved in ocean cycles and global response.
Javier,
Why would ENSO decrease with increasing obliquity?
Center of warming influences moving too far north?
ENSO requiring differential sea temperatures, rather than more uniform temperatures?
Any ideas?
Ralph
To my knowledge there are two main hypotheses about lack of ENSO activity during the HCO, Changes in SST latitudinal gradients and changes in insolation. Of course both can be related.
While most people would think that latitudinal insolation is mainly determined by precession, the truth is that changes in the summer latitudinal insolation gradient are absolutely dependent on obliquity.
ENSO is a heat exporting mechanism from the tropical Pacific. An increased heat production and/or a steeper latitudinal gradient would cause an increase in ENSO activity. As the planet has been cooling since the HCO the gradient has become steeper and ENSO activity has increased.
But, at the same obliquity, isn’t insolation greater when summer solstice is at perihelion than when it is at aphelion, especially when the orbit is more eccentric? Those differences are due to precession aren’t they?
Tom in FLorida
Yes, but it is easiest and most clear when you simply speak in terms of dates.
The Total Solar Irradiation TSI is how much is emitted by the sun at the average distance of the earth’s orbit. 1362 Watt/m^2. This value doesn’t change much, though it does go down measurably by 1-2 watt/m^2 when the sun’s surface is covered by sunspots. Be careful! There’s lots of debate about whether this TSI value has increased or decreased recently, whether it increased or decreased during previous sunspot maximums and sunspot minimums.
As you point out, the actual day-to-day Top of Atmosphere radiation levels vary because of the earth’s elliptical orbit. Maximum about January 5 each year of 1408 watts/m^2, minimum at 5 July at 1316 watts/m^2.
If you stick with dates (or days of year values) you will find it easier than using “mid-summer” and “mid-winter” as well; because the southern hemisphere mid-summer is at peak TOA radiation when the north is in mid-winter; and its mid-winter minimum solar insolation is at July – just when the northern summer hottest period has begun.
Thanks for the input but I was addressing Javier who said :
“While most people would think that latitudinal insolation is mainly determined by precession, the truth is that changes in the summer latitudinal insolation gradient are absolutely dependent on obliquity.”
Shouldn’t the MJO be studied for any research on predicting ENSO?
Robert,
It is being studied: Please read:
http://astroclimateconnection.blogspot.com/2019/02/the-lunar-tidal-model-part-4.html
Thanks Dr Curry, for your excellent analysis. The relationship has already become obvious to me, qualitatively, as a farmer on the North Coast of NSW, Australia, looking back on the occurrence of Clarence River floods (La Nina) versus the solar cycle. Eastern Australia is currently in the grip of a devastating, long-running drought (El Nino) – only a month or so back all models confidently predicted El Nino persisting until the southern autumn, but have now begun to change their tune as the Pacific Ocean has dropped to ENSO neutral. Many cattlemen, including me, have taken a gamble supplementary feeding grazing cattle (a very costly business during El Nino conditions) instead of dumping them on an already over-supplied market…in the hope that our observed ENSO /solar relationship holds true and 2019 into 2020 is La Nina, ie, wet for us, which means water into dams and strong, rapid growth of sub-tropical pasture. The sudden stratospheric warming (SSW) event currently underway in the southern hemisphere (SH) is also, according to my farmer’s eye, a powerful driver for an early onset of La Nina. Even without an SSW, it seems to me that the SH polar vortex breaks down earlier in years leading into and away from the solar minimum. Thanks again, love your work!
The SSW has been an impressive display over the last 10 days. Wind speeds rose to 330 mph at the peak at 10 hPa. Was wondering how that would affect lower levels of the atmosphere, and down to the surface. Still looks cold down there for this late in the cold season. … https://earth.nullschool.net/#current/wind/isobaric/500hPa/overlay=temp/orthographic=-313.87,-89.47,481/loc=135.435,-85.350
I’m not an expert in this area, but I like and understand the statistical treatment. I was taught that any order preserving transformation that increased relationships was the way to go. I have reviewed many papers where transformations changed the picture completely. Occasionally the authors even thank ‘an unknown reviewer’ for the suggestions. Transformations should be the first thing you think about when variances are hairy.
Javier,
A very interesting contribution. I may not have fully grasped your odds calculations, but it seems you are over estimating the significance by not taking into account correlations year to year. Am I misreading you here?
The odds for figure two are a supposition, not a calculation, as I start by assigning 50% chance to Niño and Niña. It is unnecessary to perform a better calculation because the way I do it for phase V of figure 5 is a much better way, defined in terms of solar activity, and the result is very clear. Done in that way the calculated odds are independent of the seasonal cycle, as the solar activity cycle is not linked to the seasonal cycle. It is obvious that if the Niña that accompanies the increase in solar activity from 35% to 80% of the cycle is not due to random, then the pattern of figure 2 cannot be due to random either.
Javier,
Excellent post, and analysis. To me this analysis provides the critical link between solar activity and climate change.
From your Figure 5, Phases 1 and 2 appear to be a straight forward response of ENSO to solar activity, with a lag that is due to the ‘thermal mass’ of the oceans. Likewise for Phases 3 and 5. Phase 4 is the most intriguing, as it appears to be counter-intuitive. However, your explanation that it might be caused by solar wind effects at the change-over between solar cycles seems reasonable.
The other element of the link between solar activity and climate change is the link between ENSO and Global Atmospheric Temperatures. Many climate scientists seem not to be able to find this link when they try to correlate ENSO and temperature.
This, I believe, is because these scientists make a fundamental error in their analysis. Most scientists appear to try to correlate temperature with ENSO using concurrent data. Doing so implicitly sets the ‘thermal mass’ of the atmospheric system and transport times, for the transfer of energy from ENSO throughout the atmosphere, to zero., which is a physical impossibility.
To properly correlate temperature with a forcing such as ENSO, when there are significant time lags caused by thermal mass and the time required for heat transport, it is necessary to use a filter on the ENSO data, such as an exponentially weighted moving average. The EWMA is defined as follows:
EWMA(i) = EWMA(i -1) x (1- λ) + λ*Data(i)
As Allan MacRae recently described (wattsupwiththat.com/2019/06/15/co2-global-warming-climate-and-energy-2) most short term variations in global temperatures can be correlated to ENSO, with a lag of about 4 months. This correlation is readily shown when correlating temperature with ENSO, using an EWMA filter on monthly ENSO data with a value of λ of 1/8.
However, Willis Eschenbach explains (wattsupwiththat.com/2019/06/14/a-second-look-at-radiation-versus-temperature), that this short term effect is related to the transport of energy from ENSO to the global climate system by the process of convection. A second, and more important, process for transferring energy from ENSO to the global atmosphere is the process of advection, the process ‘periodically pump billions of cubic meters of the warmest Pacific equatorial water towards the poles’. The ‘advection’ process is much slower than the ‘convection’ process, and correlates with gradual, long term, changes to global temperatures, what Bob Tisdale and others have described as the ‘permanent effect’ of ENSO. To capture this correlation one must use an EWMA filter on the monthy ENSO data with a value of λ of approximately 1/160.
Ideally the processes of the transfer of thermal energy from ENSO to the global atmosphere by ‘convection’ (short term) and by ‘advection’ (long term) should be separated and treated as separate elements in multiple regression analyses with global atmospheric temperatures. When this is done it is readily seen that ENSO is the forcing function behind the vast majority of global temperature changes over the last half century.
To resume, according this paper by Javier, variations in solar activity drive ENSO, and ENSO can readily be shown to be the mechanism to transfer these variations in solar activity to global atmospheric temperatures, i.e. : Solar activity drives climate change through ENSO.
Yes ENSO defined as 3.4 Region SST shows a clear correlation to global surface average temperature changes, and in fact can be used to predict GSAT a few months in advance as Allan MacRae among others has shown.
I have little doubt that solar variability has a disproportionate effect on climate and one of the ways it does that is through ENSO, but it is not the only way. Atmospheric effects are very important too. The Polar Vortex is under solar activity control as I showed in another article:
And Stephen Wilde has been showing for a long time the importance of solar mechanisms mediated by ozone:
http://joannenova.com.au/2015/01/is-the-sun-driving-ozone-and-changing-the-climate/
Javier,
I agree that atmospheric effects are important, in addition to ENSO, for the transmission of climate forcings to Global Atmospheric Temperatures, but atmospheric effects tend to be short term and transitory.
The ‘advection ‘ mechanism described by Willis Eschenbach, i.e. the transmission of ENSO throughout the ocean system by ocean currents, appears however to be the principle mechanism for longer term climate change. As I said above, this has been qualitatively described by Tisdale and others. However to quantitatively describe the effect, it is necessary to account for the important lags in the system. This can be done by using a filter such as an EWMA, with a λ value of the order of 1/160 for monthly data. When the ENSO data is thus filtered, the correlations with Global Atmospheric Temperatures is highly significant and is shown to account for the vast majority of the variance in global temperatures associated with long term climate change.
isn’t this, literally, ancient history?
reminds me of when people write “what about … stratospheric/sea/etc. trends!!?”
well, i live on land in 2019. why should i attend to trends that are irrelevant to me (or, more important to me, my grandchildren’s survival)?
chris, your grandchildren’s quality of life will depend entirely on the direction solar cycles take from here. If they live near the ocean they’ll be affected as those areas are now regularly.
As long as solar activity maintains a high enough average, El Ninos predominate, which drives up integrated MEI, which is linearly related to sea surface temperature, sea surface temperatures will rise, as will sea level, precipitation extremes, and associated extreme weather events. If solar activity falls deeply quite fast and for the next many decades, we are in for trouble as the ocean will cool, the rains will diminish, the lands will dry out, allowing for the hot high UVI days in the SW US summer that also drive record temps, and the ocean emits less CO2 as the equatorial ocean temperature drops below the outgas temperature range.
I believe humanity will really be tested under those conditions, whereas a progressive warming trend will imply more of the same kind of weather we’ve had over the last 30 years, with more outgassed CO2, all net beneficial for greening the earth and feeding us, as it has already. I think ancient cultures have repeatedly risen then fallen on the feast or famine conditions brought on by climate extremes driven by long-duration solar changes.
The question is open whether humanity will successfully ride out a long cooling wave without population(s) collapsing as always appears to happen. Many grand ancient cultures grew and thrived during long-duration higher solar activity periods, only to face an impossible task of feeding such a large population into a subsequent deep cooler drier downturn, and cultures crashed.
Things won’t change so much if NASA is wrong about low solar activity in SC25. Stay tuned on that.
Arguing against human emissions is futile and wasteful, counter-productive to real societal needs. Emissions can’t cause the wind to blow let alone change the climate.
Integrate all the information presented here to know our future depends on the sun.
I believe your grandchildren’s children will be taught the sun controls the climate, top to bottom.
When data are viewed through the prism of as many unorthodox, ad hoc assumptions as are invoked here, the likelihood of getting a misleading conclusion becomes high.
ENSO is very far from being quasi-periodic and shows very little power density near the ~11 yr Schwabe cycle of sunspots. Its power spectrum displays no distinctive harmonics and bispectrum analysis shows no significant phase-locking. Despite the unwarranted restriction to post-1956 data, there simply is no real consistency in what happens in the ENSO record near the nadir of that cycle. Positive and negative anomalies in the ENSO record occur quite irregularly and strong El Nino episodes are by no means restricted to any phase of the Schwabe cycle. Nor is there any demonstrated success in rigorously predicting such episodes.
All in all, the entire line of reasoning here smacks of mere visual impressions being mistaken for solid scientific evidence–an all too common fault in the “soft” sciences when dealing with hard problems.
I can’t disagree all that much except to say when you base ENSO activity predictions as I do on changes and levels of TSI, things work out, as opposed to the more common probabilistic mechanism-free method.
It is very hard to express all this concisely and definitively as a proof, so I do like the use of odds that do help for that reason, but doing that won’t tell when to expect the next top-of-cycle El Ninos or why one might falter, unless solar indices are used.
ENSO is very far from being quasi-periodic and shows very little power density near the ~11 yr Schwabe cycle of sunspots.
1sky1, what kind of crap are you spouting. What you say is the equivalent of saying that a violin string does not resonate at the frequency with which the violinist plays. No! Its frequency depends on the length, diameter and tension of the string. Only the amplitude is dependent on the violinist.
Similarly, the frequency of a ENSO is governed by the internal dynamics of the ocean flows. The amplitude of the system response however is a result forcing. In this case, Javier has shown very convincingly that the solar cycle has a strong effect on the amplitude of ENSO.
sky isn’t off base so much. The fact is the sunspot record is not synchronized at 11 years, it’s an average, and furthermore even if the average for each cycle could somehow be the same, the development through each cycle to attain the same average is always going to be different for every cycle as sunspot emergence is random.
The great correlations and statistical properties between SN, F10.7, and TSI have to be weighed against the knowledge that each cycle’s development is unique and as of this date unpredictable, other than the general cycle size per Leif S, and the fact that for a given sunspot number at any given time, the TSI up to that same number can develop as differently as there are combinations of sunspot number leading to that same average just due to the basic aperiodic nature of sunspot activity.
The fact that sunspot cycle peak timing(s) vary so much is important. SC24 peaked in late 2014, and now the ocean heat generated by that TSI spike is just about fully offset by the solar decline since then. Imagine if the peak was earlier, like just about everyone thought prior to 2012, the ocean would’ve had more time to cool by now. Timing is as important as level and duration, as solar effects are layered and time-dependent.
For those reasons the power density at 11 years is low and the R values of my TSI-ENSO indice cross-correlations are low. The signal is there regardless. I find the ocean warms and cools at nearly mirror-image rates, so the real variability of interest here is the sun’s.
I also agree that the ENSO has an internal dynamic, based on circulation and upwell time. There is a lag between sunspot activity and maximum TSI from that activity. Then there is some lag at the ocean after peak TSI at the top of the cycle from circulation and upwell time. The lags probably have some sun strength-dependent variability too.
But in almost all cases there is a ‘solar cycle onset’ El Nino, an initialization point, and post-cycle maximum El Nino(s) after monthly solar exceeds SN>94, F10.7>120, SORCE TSI>1361.25.
This is why my data-driven system is better at predictions than the probabilistic method, because it’s based on available incoming solar energy, which is tracked daily.
If you had any comprehension of the dependence of the power density upon the nature of the dynamics involved, you would not spout any nonsensical analogies with a violin string. There is not the slightest indication of any resonant response in the featureless, broad-band power spectrum of ENSO.
Obviously or this article would be unnecessary.
That is not correct. See White & Liu (2008) in the linked file.
Consistency is not a requirement for a real significant effect. We are dealing with a complex non-linear phenomenon.
You are welcome to your opinion, but for what you say in your comment I doubt it is based on reading the article rather than just looking at the pictures.
Not only have I read your posted article, but I’ve done, more than a decade ago, all the rigorous analyses of the relationship between ENSO and sunspot signals that you seem to have never performed.
It requires far more than just peaks in the raw periodogram to establish the presence of any significant harmonics in a broad-band process. What White and Liu find through an unconventional partial variance analysis is harmonics not of the ENSO signal , but of a spatial decomposition of Pacific SSTs between 40S and 40N in latitude. Their supposed applicability to ENSO rests entirely upon a visual phasing comparison of subsequent simulations in the time domain.
I correctly assumed there was no need to do them since multiple researchers must have done them many times, and the lack of reports indicates a lack of positive result. I found a more original approach to the problem than beat the beaten path and then give up.
Their figure 4 shows that the sum of the 3.6- and 2.2-yr harmonics thus obtained is very similar to the Niño 3 SST index. That’s one of the main conclusions from a paper cited 66 times according to Google Scholar and that to my knowledge has not been refuted.
The “more original approach to the problem” here is simplistic and lacks grounding in signal analysis fundamentals.
All that White & Liu really managed to demonstrate is a wholly unsurprising, weakly correlated phase relationship between ENSO3 and the harmonics of a much-wider-area Pacific SST index, encompassing the equator. They present no evidence of cross-spectral coherence with solar activity itself. Their attribution of those harmonics to solar activity is based entirely upon finding a ~11yr spectral peak in their quaint “partial variance” analysis. There is no such peak, nor such harmonics evident in rigorously estimated Nino 3.4 power spectra, although raw periodograms may haphazardly show some. That this solar attribution hasn’t been refuted in a field rife with unchallenged speculation and analytic ineptitude provides more a sociological than a scientific indication.
Javier,
The lag in Figure 5 appears quite clear to me. Have you looked at the cross-correlation between the solar and temperature indeixes?
Also, the first period of La Nina is deeper, where the slope of the solar cycle graph is steeper, the weaker second phase at the end of the cycle the slope is lower. And the El Nino’s are (lagged) after there is very little change of slope during the peak of the solar cycle. So does the gradient of the solar cycle curve relate to the intensity? Once a lag is taken out?
What about integration? A cumulative effect?
Just thoughts. They would be things I would look at.
Nice bit of work, very interesting.
Thank you.
Several scientists have looked at that. Particularly K.K. Tung has several articles. For example:
Zhou, J. and Tung, K.K., 2010. Solar cycles in 150 years of global sea surface temperature data. Journal of Climate, 23(12), pp.3234-3248.
https://journals.ametsoc.org/doi/pdf/10.1175/2010JCLI3232.1
It doesn’t appear so. The intensity of ENSO appears to depend mainly on factors other than solar activity.
What about looking at the cumulative totals of energy in vs energy out over time? It would seem to me that a phenomenon like ENSO intensity, especially the really big Nino would reflect the residual energy stored in the system over time. Looking at the graph, the particularly large Ninos of 98 and 16 follow periods of relatively small Ninos and deeper La Nina’s. Makes me wonder if the energy driving larger warming events is the result of the ocean belching out accumulated energy stored over a period of 10-15 years. So while the cycle effects dictate the when, the energy stored determines the size.
a phenomenon like ENSO intensity, especially the really big Nino would reflect the residual energy stored in the system over time.
I started out thinking this also, that the ’98 ENSO derived from the previous cycle, but it absolutely conforms to the solar TSI impulse at the start of the cycle, after the low solar minimum energy has reduced tropical evaporation thus clearing the skies, re CP OLR:
The ’98 El Nino was a solar impulse response that could not be sustained by the sun and died out, as the ocean didn’t hold the new heat long, kicking it out as fast as it was deposited, ending in a La Nina.
The ’16 El Nino resulted from the year-to-year build-up after the SC24 cycle onset ENSO of ’09/10 of sea surface temperature from year-to-year TSI growth to the top of the cycle, and ended when TSI was no longer sufficient to maintain further warming as defined in my work.
Sorry Javier, I meant cross-correlation of the two curves in your Figure 5 above ie the sunspot curve and the ENSO index.
I did digitise your data and try it, the peak correlation is R=0.52 with a lag of 0.18 of your normalised solar cycle.
If you plot the indices looped round again though, the end point of the ENSO curve gets very high amplitude when the cycle goes to zero. So its like the El Nino ramps on (lagged) after the sunspot rate of change gets small.
That’s an interesting observation. Corresponds to a variable lag of ~ 2 years. Another observation is that variability appears to go up during the declining phase of the solar cycle, with ENSO being more consistent during the low, increasing and high activity phases.
If you are interested your questions were addressed in my several posts above.
My empirically-based data-driven analytical work covers everything necessary to know how the sun controls the climate.
Javier,
Figure 2 only shows a significant correlation between La Nina activity and the solar cycle. I believe that it does not show a convincing long-term correlation between El Nino activity and the solar cycle. Hence,
I am in agreement with you about the likelihood of a La Nina event in late 2020 to early 2021. However, the El Nino event you are claiming for 2018/19 was only a borderline strength event. The Australian BMO listed the 2018/19 event as a marginal El Nino, at best. Most of the other climate groups had to invoke the Modoki definition to get it over the line. I am sticking with my prediction that we will have a moderate to strong El Nino event sometime between July 2019 and January 2020. Obviously, since it now early September 2019, the first half of this period has been ruled out. But I am still standing by my prediction.
As you know, I have proposed that La Nina and El Nino events are produced by different mechanisms. I agree with you that the likelihood of a La Nina event is controlled by the level of solar activity as they both exhibit the same historical trends. However, I believe that El Nino events are initiated by lunar tidal events.
The increase in galactic radiation has a huge impact on pressure changes abover the polar circles. Ionization by GCR causes a local strong temperature rise in the stratosphere.
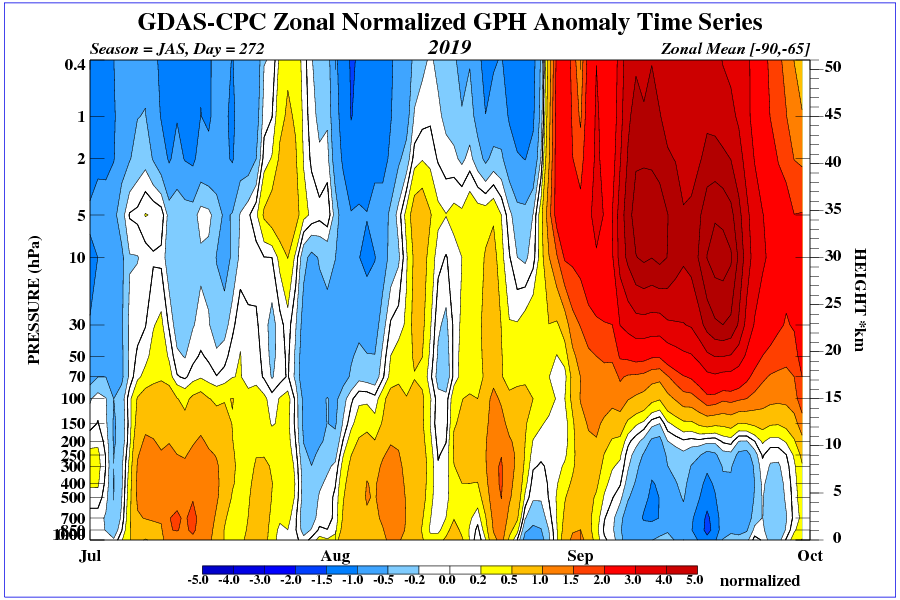
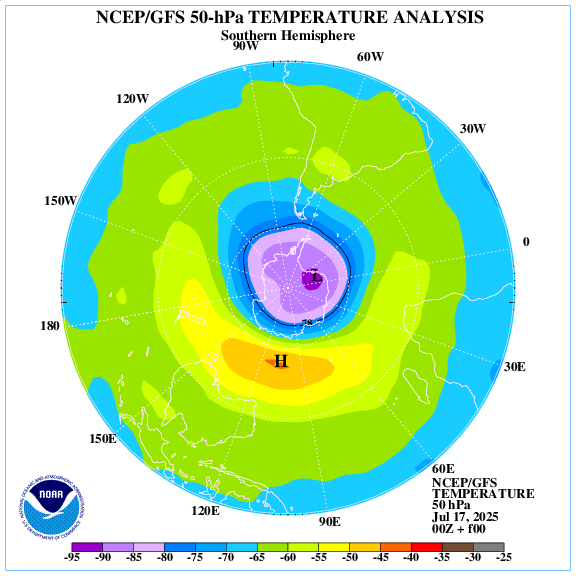
So Javier thinks he has predicted the El Nino episode that normally peaks just after sunspot minimum, and has more recently peaked a year or more after sunspot minimum, but sunspot minimum hasn’t even happened yet. I’d call that fairly fatal confirmation bias.
Interesting article which is connected to my own ENSO prediction using Artificial Neural Networks. I’m still working on my ENSO predictions improving my calculations by improving my program, in-data and by including additional mathematical methods. I recently got new results where I estimate correlations. I found that the in-data with best correlations to ENSO were the aa-index, followed by tidal influence and QBO. The aa-index gave the best correlation which is consistent with that solar activity has large influence over ENSO. QBO variation is driven largely driven by lunar gravitation where the base QBO frequency is equal to the 18.6 year lunar cycle divided by 8. Right now I’m halfway in my work, which has as its aim to create accurate ENSO prediction and to explain the underlining forces which drives ENSO variations.