From Pierre Gosselin:
During last week’s record-setting European heat wave, Germany’s previous record of 40.3C was impressively shattered by the measurement station located at the northwest city of Lingen, near the Dutch border, some 50 kilometers from where I live. The German DWD weather service and media loved it!
Controversial siting
Yet, controversy now swirls about the new record setting measurement since it has come to light that the measurement is fraught with some considerable siting issues.

As the photo published by T-online here shows, the station is located right near a DWD office building, is shielded from the wind by grown trees and is located not far from a public swimming pool.


Meteorologist Michael Theusner told t-online.de:
“The monthly average of the daily highs in Lingen has been deviating more and more upwards from the average of the highs in Lower Saxony since 2010.” The station has become increasingly shielded and thus tends to heat up more.
Swiss veteran meteorologist Jörg Kachelmann wrote the extra heat possibly could be heating the station by up to another 3 degrees!
DWD accepts overheated reading
Germany’s DWD national weather service has even confirmed that the station’s siting is no longer adequate and that a move to a new site had been already long planned. But despite the acknowledged poor siting, the DWD went ahead and confirmed the reading as valid. The 42.6°C reading now stands as Germany’s new all-time recorded high temperature, no matter how questionable the reading may be.
Valid? How does Lingen compare to other temperature stations located nearby? I did a check.
Fifty kilometers to the east of Lingen where I live (Quakenbrück), my home thermometer showed a high of 38.2°C. That’s unofficial, of course, but it made the Lingen reading look suspicious. So I decided to compare Lingen to the other official stations nearby to see if their readings were as hot as Lingen’s.
The surrounding readings do indeed confirm meteorologist Kachelmann’s gut suspicion. Lingen readings are suspiciously 2 – 3C hotter than those of its neighboring stations.
What follows is a chart depicting the readings recorded by the Lingen station over the past past week. The DWD itself stated that the mercury in fact reached 42.6°C on Thursday (Do. 25.07)!

Chart: wetter24.de
Now looking at the Nordhorn station, located some 20 kilometers away, here the mercury climbed to 40.9°C, which is 1.7°C below the Lingen reading:

Chart: wetter24.de
At the Meppen station, also located some 20 km away to the north of Lingen, the mercury reached 39.2°C, a far cry (3.4°C) from Lingen’s maximum reading:

Chart: wetter24.de
At the military base in Diepholz, some 65 km to the east, the high on Thursday reached 38.7 degrees, i.e. almost 4°C below the Lingen reading!
…
More than 2°C hotter than surrounding stations!
A summary of all the temperature readings recorded at Lingen compared to those of six nearby stations for the past five days, July 23 – July 27:

On every single day, Lingen handily beat its neighbors by at times large margins.
Lingen 2.6°C hotter than adjacent stations
On the record-setting date of Thursday, July 25, 2019, the mean of the six neighboring stations listed in the table was an eyebrow-raising 2.6°C below the Lingen reading.
All the stations cited around the Lingen station all share very similar topographical characteristics, and all are located on the north German flatlands, and thus comparable.
No doubt the reading at Lingen is accurate. But it looks like the siting of the Lingen station is causing overheated conditions.
Full report at No Tricks Zone
Does it also share diesel enhancement software?
DWD / German DWD weather service / = Deutsche Wetter Dienst
and “diesel enhancement software” in german = Diesel Skandal
and DD = Dumme Deutsche
You shouldn’t get all wrapped up in details since it’s only feelings that count. I feel like those white guys in SUV’s and private jets are trying to cook us. Wait a minute, that’s me. Never mind.
Wait a minute, I just read that Perez, the Chairman of the DNC, says that climate change is a threat to the UNIVERSE. It’s worse that we thought and I take back my prior sarcasm. I promise to walk everywhere and never fart again.
You laugh, but hey:
https://www.space.com/33001-mars-ice-age-ending-now.html
O/T, but what’s up with the current melt shown at DMI’s website occurring in Greenland? Typically this kind of abrupt change reflects equipment malfunctions, but I’ve heard no word of that. On earth.nullschool.net it appears that there may be a dome of high pressure over southeastern Greenland (based on wind patterns). Thoughts?
http://polarportal.dk/en/greenland/surface-conditions/
My understanding is that it’s the air system that caused Europe to get so hot which has moved up over Greenland.
https://www.livescience.com/66041-heatwave-europe-greenland.html
NH weather systems don’t move backwards. Greenland is WEST of Europe.
Different issue.
You’ll like this. Apparently, a CNBC reporter interviewed Holthaus about the Greenland melt, and he said this:
“The measurable amount of sea level rise just from this one event in Greenland translates into lower property value on every coastal city in the world” says @EricHolthaus
https://twitter.com/emma_newburger/status/1156997758819164160
https://twitter.com/EricHolthaus/status/1156607677155434496
Here’s the CNBC reporter’s article. This shows the chain where this ridiculous stuff comes from. A clueless reporter interviews someone clueless like Holthaus.
https://www.cnbc.com/2019/08/01/extreme-ice-melt-in-greenland-threatens-coastal-communities-scientists-warn.html
My investment partners and I are still waiting for Scripps Institution to sell off its lower campus at a steep discount from established La Jolla values.
Hi Anthony,
Why bother with the fact as you know everything (better):
https://earth.nullschool.net/#2019/07/28/1800Z/wind/isobaric/850hPa/overlay=temp/orthographic=-339.08,54.63,436
Nothing in that nice animation, shows a weather system moving east to west in the NH…..it shows winds within the systems blowing to the west, not sytems moving west…..perhaps you should learn what Anthony was actually talking about, before trying to educate people…..
Hi Brandon,
Phil was talking about the “air System” and you can see in Grennlland wind from the East and Temparture rising. And the High pressure system SW ofSvalbrad is moving to the West.
Those differences are in line with BBC Weather forecast which gives 2 or 3 degrees as the difference between town and country temperatures in these conditions.
wetter-online.de
**wetteronline.de/wetternews/messung-in-lingen-inakzeptabel-42-6-grad-rekord-unbrauchbar-2019-07-30-hi**
reports that the problem is known by the DWD since 2014. They say that they won’t retract the record because not to give fuel to clime change deniers and not to raise questions about the quality of the stations locations.
wetter-online, by the way will not accept the measurement as the new record.
Exactly the same thing as last month’s famous high in Gallargues-Monstrueux . A class 3 station similarly situated near water ( which would tend to reduce temps in case of a south wind ) and near a massive road haulage depot with acres of nice black bitumen and 1000 m^2 of steel sheet roofed warehouses …. up wind of the prevailing wind on the day in question.
Similarly, the national weather service dispacted someone to check the station and concluded that since the wind was not from the south , the water ( the only feature offically recorded as a potential problem ) was not a factor on this day and similarly “validated” the reading.
A professional met officer sent specifically to check the site could not have been unaware of the lorry park but conveniently chose to ignore it on the pretext that it was not recorded as a potential cause of bias.
who would want to miss the opertunity to get in the Guiness book of record temperatures ?!
So like Germany , France has a new FAKE “hottest ever” temperature on record. Duly “validated” for media to freely use and misrepresent the “climate crisis”.
Thanks to Pierre Gosselin for checking out the German record site.
Actually, the record stands at 46° at Vérargues (Hérault).
http://www.meteofrance.fr/actualites/74345599-c-est-officiel-on-a-atteint-les-46-c-en-france-en-juin
Hi, do we have a link to “DWD accepts overheated reading”?
Should have said a link to where this is said”Germany’s DWD national weather service has even confirmed that the station’s siting is no longer adequate.
Thanks, Mark.
Yes:
https://www.dwd.de/DE/leistungen/besondereereignisse/temperatur/20190801_hitzerekord_juli2019.pdf?__blob=publicationFile&v=3
Google translator might help:
Since there was turbulent flow in the afternoon DWD states that a “heat jam” due to the vegetation can be neglected.
Can’t really call this a “Fake Record”, since it was entered following established rules. At best it’s a inaccurate record which does not reflect natural weather, but only a single site in an unnatural setting.
But you have actually made it somewhat useful, in that you have established that there is at least a 3C UHI effect in that area. If one were to create individual corrections for urban sites by using nearby rural sites, one could then correct the raw data to be more accurate. It would be interesting to see what the result is, but it’s simpler to just use well situated rural stations to determine natural temperatures. I seem to remember that has been done for limited areas and resulted in a warming trend of about…1/2 (?) of the current reported trend.
So assuming my memory is accurate, up to 50% of the current warming is explained by UHI.
Solar Activity update: July SSN number ‘nullus est’
http://www.vukcevic.co.uk/SSN.htm
There is a general problem with these supposedly record temperatures throughout the UK, and all for the same reason UHI!
Ironically, the BBC regularly confirms this in its daily weather forecasts. The weather man or woman quotes the UK temperatures for the UK as indicated on the chart behind them, and then very often says,” but in more rural areas the temperature will be a degree or two lower!
Yet these temperatures are as recorded on the same weather stations which which are the recorded temperatures used to “substantiate” ongoing CAGW/Climate change and their continuous demands for CO2 emission reductions.
Rural areas cover far more area of the UK than urbanised areas. Urban areas are also increasing due to urban sprawl and new housing developments in rural areas That means that weather stations set up years ago in what were more rural areas are now often in urbanised areas and suffer the same UHI effects. There is therefore a varying but significant effect on supposedly recorded average temperatures.
The temperature differences quoted by the BBC in rural areas confirm that average temperatures are actually significantly lower than those reported, massively more than the target 1.5 degrees C temperature rise in 80 years that we have and are still paying for on man-made CO2 emission reduction programmes.
I seem to recall, but can’t find the source, that the temperature at Victoria’s Diamond Jubilee Naval Regatta at Spithead in 1897 as 100 degrees , i.e. over 38 degrees centigrade – the same temperature just recorded by the Met Office and reported as the highest ever!
Climatology as a science is so bad it is comparable to the old time alchemists trying to turn gold into lead. (1) Poor quality unreliable data. As near as I can tell most of the temperature data is so unreliable it needs to be tossed out. It’s like if Issac Newton had realized that gravity pulled the apple down and then decided that for every force there must be an equal and opposite counter-force so if apples fall down then pears and bananas must fall up. And then made up the data to prove it. (2) A simplistic one variable hypothesis trying to explain what we already know to be a poorly understood multi-variable chaotic system. (3) The influence of the single biggest variable – the sun – is poorly understood.
Just imagine if all the sciences were of the same high quality of this climatology stuff – “Hey Joe, I’m going to go make a a new batch of them thar nuclear bombs this morning.” “OK Boobsie, I’ll go put my ear plugs in.”
…and then to boot, there are confirmation bias, plain old fraud, and the endless, insistent, desperate need for novelty no matter how utterly pointless and useless – the unavoidable result of turning out thousands upon thousands of mediocre science grads every year. My stepfather of blessed memory (psychologist and psycholinguist who helped design the ergonomics for the lunar excursion module) used to joke about it all the time, citing his favorite,
“The Left-turning Tendency of the Dancing Ground Squirrel.”
Now of course it would have to be “Dancing Ground Squirrel under threat of extinction due to climate change” and immediately distributed to all social media and news networks.
Climatology as a science is so bad it is comparable to the old time alchemists trying to turn gold into lead. (1) Poor quality unreliable data. As near as I can tell most of the temperature data is so unreliable it needs to be tossed out. It’s like if Issac Newton had realized that gravity pulled the apple down and then decided that for every force there must be an equal and opposite counter-force so if apples fall down then pears and bananas must fall up. And then made up the data to prove it. (2) A simplistic one variable hypothesis trying to explain what we already know to be a poorly understood multi-variable chaotic system. (3) The influence of the single biggest variable – the sun – is poorly understood.
Just imagine if all the sciences were of the same high quality of this climatology stuff – “Hey Joe, I’m going to go make a a new batch of them thar nuclear bombs this morning.” “OK Boobsie, I’ll go put my ear plugs in.” Geez.
Were they not worried that if they admitted the facts, it would tend to add credence to the so called Deniers ?
Germany is like that, once the plot is written, new evidence or discoveries will either be ignored of made illegal to promote 🙂
Why don’t they get VW to install some temperature control software into their system? Then just pay them according to how well their software says the temperature is controlled.
…the old record in Germany was 40,3°C and was beaten 25th July by 0,2 °C. The reading of the station on the NATO-Airport Geilenkirchen was also confirmed as ‘new heat record’ by the DWD, ignoring the fact, that this station sits a few meters next to the runway and is not even a part of the official weather network in Germany.
Always remember: question high temperatures must always stand; questionable low temperatures must be discarded immediately. The hypocrisy is disgusting.
This year in the UK a TV weather presenter was forced to admit that, “This is the Coldest May Day Bank Holiday on record.” She immediately followed up with, “But of course the records don’t go back very far.” Oddly she never says this when the temperatures are (allegedly) the other way.
May Day has been a public holiday in the UK since 1978. BBC, eh? Oh dear oh dear, they try everything to fool the public.
Wonderful post…many thanks Pierre. Keep it up!
And, of course, the bitumen car pork along the building would have no effect in the midday sun /sarc
thats a feature not a bug…….call it the windows 10 effect….
UHI effects in rapidly growing cities and towns and poorly sited meteorological stations which overheat are the bread and butter of everyday Global Warming/Climate Change Alarmism. There is no urgency shown to investigate these areas as the results could be very antithetical to the Cause of Gaia.
I did some checks for weather stations on the Dutch side of the border.
I checked 5 stations West of Lingen. The results for the 25th of July 2019:
Emmen, 40 km to the NW: 38.7 at 17.02
Sleen, 44 km to the NW: 40.1 at 18.02
Wierden, 53 km to the WSW: 38.9 at 12.17
Hengelo, 48 km to the SW: 40.9 at 17.02
Losser 38 km to the SSW: 41.5 at 15.02
Average of the 5 stations: 40.0 degrees, again 2.6 degrees below the Lingen reading.
Source: https://euweather.eu/stations.php?lang=nl&lat=52.7439&lon=6.8985
You see in the Sat-Image the hot spot of Lingen (in case you know where to look).
https://www.esa.int/spaceinimages/Images/2019/07/Extreme_heatwave
So UHI has an influnece here – and still the french records Frncoise mentioned are not in Urban influnce.
And some of the German station surpassing the old record on the same day are as well closer to rural than to urban character.
And furthermore: just look at the distribution for high temps over time in Germany: these increse in frequency and in number of stations (on the ame day) .
All in all: the lingen value can be disputed, the heat records hardly can.
F.Ketterer: “You see in the Sat-Image the hot spot of Lingen (in case you know where to look).”
WR: The link you give is for the day after (!) the record breaking event: for the 26th of July. The scale is not appropriate to find back Lingen. Besides the fact that the time mentioned (10.44 AM) is not very well suited to find a record temperature, there are locations visible in Germany that are warmer than near the German/Dutch border.
Hi Wim,
You can download the hires version.
Next to that:
You are referencing the relase date/time: look at the image: it was taken July 25th.
The hot spots you mentionen are the Cities of Cloogne and Duesseldorf, Nor official weahter stations there in the inner cites.
Hi F.Ketterer, OK, thanks. But in the hires version I still don’t see Lingen as being hotter than the whole German-Dutch region where I also found my Dutch stations in. So I still think the measurement in Lingen is a very local measurement not reflecting the temperature of the region. Perhaps the soccer field played a big role, mentioned by Gerard: https://wattsupwiththat.com/2019/08/01/poorly-sited-weather-station-leads-to-a-fake-record-high-in-germany/#comment-2759207 .
Wim Röst
“Average of the 5 stations: 40.0 degrees, again 2.6 degrees below the Lingen reading.”
I much appreciate the accuracy of your comments, but sorry: this here is absolute nonsense.
Either
– you compare the Lingen result with the highest one you found in your Nederlandse corner
or
– you compare your average with that of Lingen together with 4 nearby stations.
Bindidon, I understand your way of reasoning. I wanted to check whether Lingen was an outlier and that still seems to be the case. And the more Lingen diverges from the average, the more suspect the Lingen result is.
somebody with access to all of the raw data should do a study of the average temperature departures of the properly-sited long term rural stations against the average temperature departures of the no longer properly sited long term urban stations. I’m willing to bet that the urban heat island effect becomes glaringly obvious.
There’s a good paper here: http://oprj.net/articles/climate-science/34
To summarise: there are only nine stations globally that are both rural and have over 100 years of data and all of these have problems (stations moves and one was inside a building).
In conclusion: it is pointless using ground station data which is so overwhelmingly contaminated by urban heating that it is utterly meaningless for long term temperature trends.
Took me only 3 min to find the first Gap:
Very Rural: Sonnblick observatory: data since 1886. mkaes it more than 130 yrs.
Our famous KNMI had an overenthusiastic and wrong Twitter message: The former record of 38.6 degrees Celsius would have been broken by a 41.7 degrees in Deelen. https://twitter.com/KNMI/status/1154362572138852354 . The KNMI had to be corrected by weather amateurs. They saw what the KNMI did not check: a rise in temperature from 38.3 to 41.6 in less than 10 minutes – impossible.
The KNMI had to correct the former message: https://twitter.com/KNMI/status/1154372338806398976 (in Dutch). The measurement in Deelen was not valid.
Both KNMI and DWD are member of the World Meteorological Organisation (WMO). The DWD president even stands for WMO presidency: https://www.dwd.de/EN/Home/_functions/aktuelles/2019/20190517_candidate.html
It has been the WMO together with the United Nations Environmental Program (UNEP) who created the IPCC in 1988:
“The IPCC provides regular assessments of the scientific basis of climate change, its impacts and future risks, and options for adaptation and mitigation
Created in 1988 by the World Meteorological Organization (WMO) and the United Nations Environment Programme (UNEP), the objective of the IPCC is to provide governments at all levels with scientific information that they can use to develop climate policies. IPCC reports are also a key input into international climate change negotiations.”
Source: https://www.ipcc.ch/about/
It has been the IPCC (again: founded by the UNEP and the WMO) that created the predictions about climate. WMO’s members KNMI and DWD are very eager to accept and present new high temperature records, while their previous role was the presentation of perfect measurements that could be fully relied on. Their role seems changed.
In order to resolve this controversy, no doubt the other stations will be adjusted upwards in order to match the station that agrees with the models.
In 2016 our famous KNMI ‘lost’ 16 of the 23 heat waves from the period 1901 – 1951 after an homogenisation made by the KNMI itself. After the homogenisation it seemed that the Netherlands in the first half of the twentieth century cooled down considerably: most heat waves were gone. Warm and very warm days in our main station De Bilt were down ward corrected by up to 1.9 degrees Celsius. https://clintel.nl/hittegolven-geschrapt/ (sorry, the articles mentioned in the links are in Dutch).
A recent extensive report criticized the homogenisation: https://klimaatgek.nl/document/De%20homogenisatie%20van%20De%20Bilt%20def.pdf
Both KNMI and the Dutch Government (responsible for the KNMI) did not react on the report.
In a further correct article the Dutch ‘Financieele Dagblad’ used the now officially presented homogenised heat wave data in the following graphic: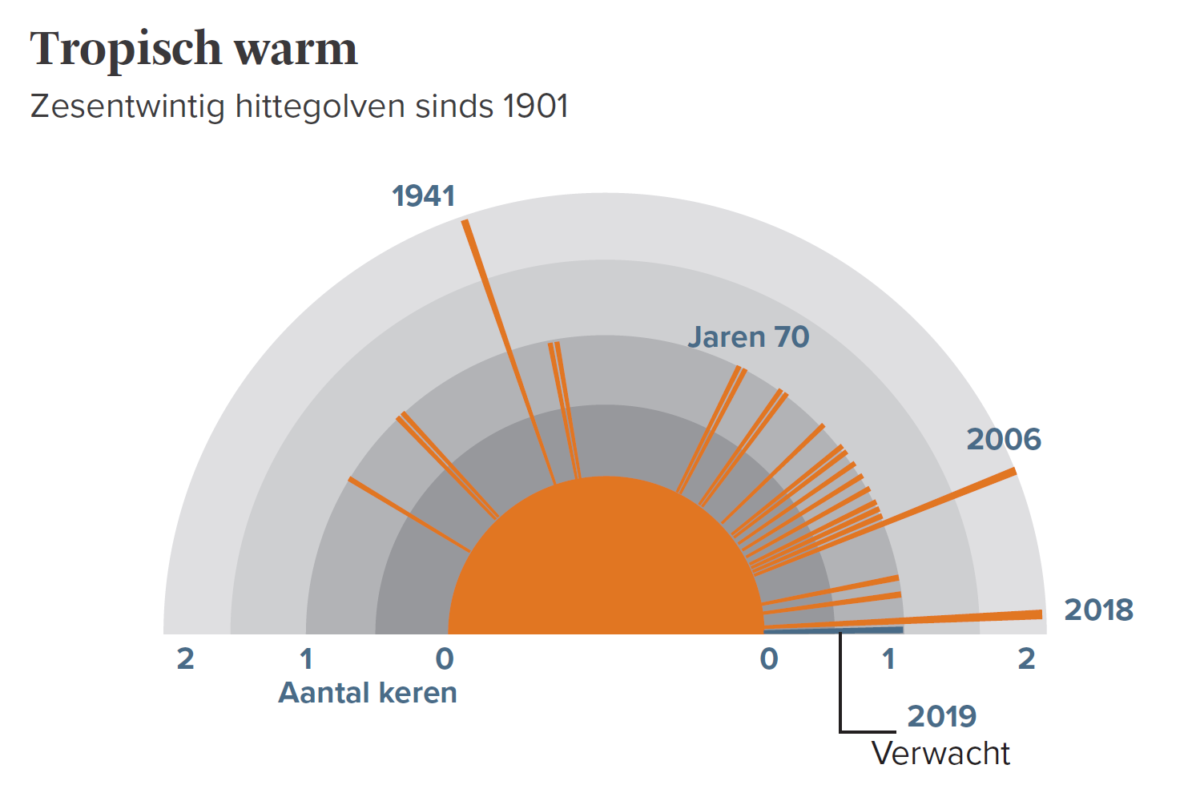
But the Groene Rekenkamer produced the same graphic with added the measured (!) but disappeared heat waves since 1901: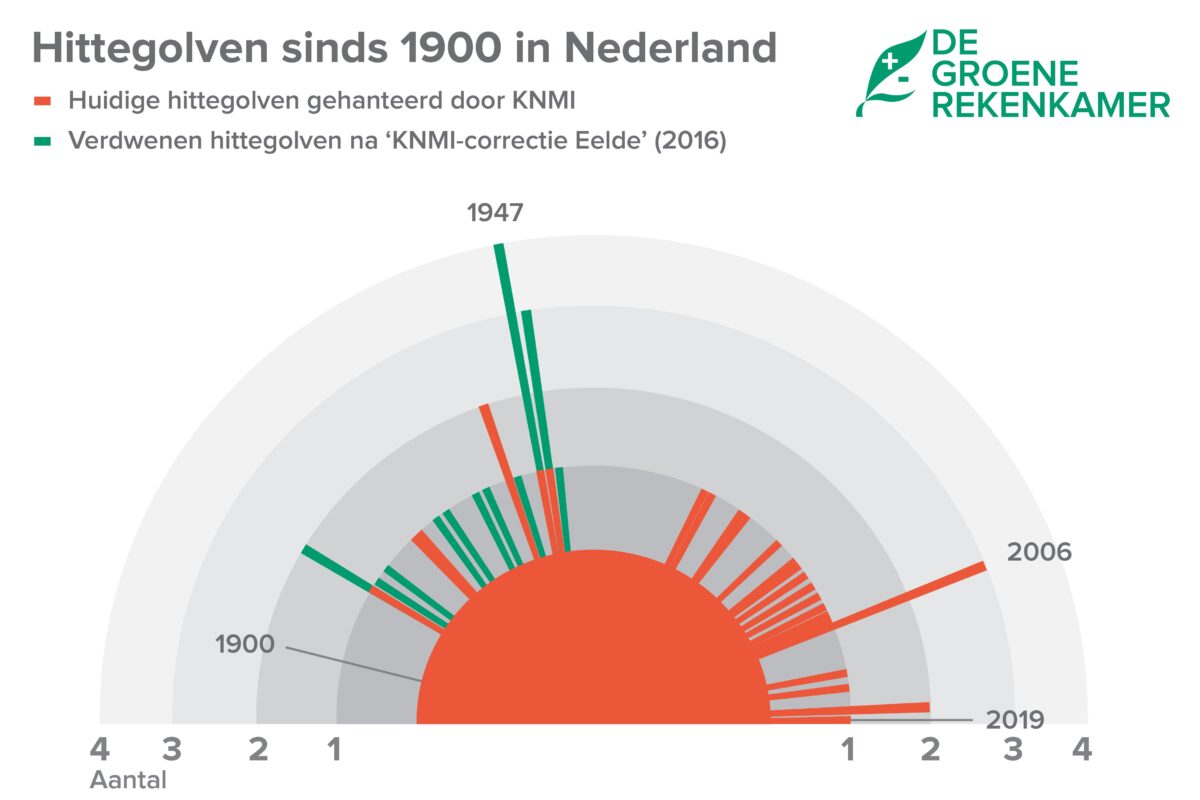 In green the measured heat waves that ‘disappeared’ from the present (since 2016) official numbers.
The second image is completely different from the first homogenised one: in the homogenised version it seems that heat waves are far more present in recent times. The original data however show that there were many heat waves in the Netherlands before 1950 – conform the stories told by our parents.
The KNMI homogenised the centrally located De Bilt with the temperatures of only one station (Eelde) that is situated 150 kilometre to the northeast. Joking I sometimes say: situated just below Norway.
KNMI is asked to restore the old situation from before the homogenisation until a correct and acceptable homogenisation has taken place. Lately asked again here: https://www.climategate.nl/2019/07/knmi-blijft-oost-indisch-doof-voor-het-raadsel-van-de-verdwenen-hittegolven/
The article in the Financieele Dagblad shows that ‘a new reality’ is going to be created. A reality that is not conform what has been measured. The reality of the first half of the twentieth century showed very warm periods that after the ‘correction’ by the KNMI are no more visible in the number of heat waves as officially presented since 2016.
Reminds of two days of 123F and 124F on a weekend in my old home town in Australia in 1906. The second day was 1F higher than Australia’s highest recorded maximum. Using data from a town 300 km away (200 miles) they figured that the Saturday was actually 8F cooler. The Sunday was ignored because they refused to believe someone actual came into work to record it.
Same in The Netherland, the old record of 1944 in Warnsveld was set in a garden in a river valley. The new record was on the military airfield Gilze-Rijen next to the runway on dried out sandy soil.
Average monthly maximum temperature for Warnsveld in July: 23.1C
https://www.buienradar.nl/weer/warnsveld/nl/2745003/klimaat
Average monthly maximum temperature for Gilze-Rijen in July: 24.2C
https://www.buienradar.nl/weer/gilze-rijen/nl/6296686/klimaat
On the average Gilze-Rijen is 1.1 degree warmer in July than Warnsveld in July. But different ‘record data’ make a difference too.
The old record of Warnsveld was set on the 23rd of August in 1944. As the average maximum temperature in Warnsveld goes down from mid August to mid September from 23.3 to 19.8C, a raw estimation would be that the average temperature for the 23rd of August should be in the range of 22.5C.
The new record (40.7 degrees Celsius) has been set in Gilze Rijen on a normally warmer date (25th of July) than the 23rd of August (Warnsveld). The normal average mid July average maximum temperature for Gilze Rijen does not differ much from the mid August temperatures for that place: 24.2 to 24.1. The difference between ‘normal 23rd August Warnsveld temperatures’ and ‘ normal 25 July Gilze Rijen temperatures is around 24.2 minus 22.5 = 1.7 degrees. As the new record in Gilze-Rijen is 2.1 degrees higher than the old one in Warnsveld, the difference from ‘normal’ has gone up 2.1 -1.7 = 0.4 degrees over a period of 75 years if corrected for temperature differences for the places of measurement and for the dates of measurement.
A rise by 0.4 degrees is not as spectacular as a simple comparison (a rise from 38.6 to 40.7 degrees for different places and different locations) suggested. So far I did not see this apple to apple comparison in the Dutch media nor by the Dutch KNMI. Like in Germany in Holland by the media and by the official (national) meteorological institutes a preference for ‘super high records’ prevails. Making people crazy about ‘climate change’ while ‘the facts’ show moderate changes in temperatures.
The official institutes should be corrected by their governments. Correct measuring is their task – not supporting emotions that are based on non-comparable and/or on non-validated data.
Obviously all the surrounding station readings need to be homogenized up to match Lingen. Talk to NASA about how to do that!
These poorly sited weather stations are becoming laughable. XD
Fact is that we had several utterly nice days. And last time I checked, summer is supposed to be hotter than chilling icy winters.
Reality is that we have all lost track of what summertime is all about. That many endless winters on the clock drift the perception of nice sunny weather, joyful “Biergartens”, romantic evenings.
Guys in electric cars hate summer as air conditioning lowers significantly their range and cruising with open windows is not something they have discovered yet.
As far as I know not a single sched flight has been cancelled nor incident reported due to “extreme heat”.
Summer rocks !
So it’s all a set-up….surprise, surprise…
M Herrera extreme temperatures: “Lingen 42,6 questioned, likely set under not proper conditions”
What we need is an international temperature doping observation group….
I don’t yet see mentioned here that the big soccer field next to the station has artificial grass. It is not as bad as bitumen but will still heat up above 50 degrees C in these circumstances that in sharp contrast to natural grass. If in recent years they have changed the grass surface that alone would easily account for the changes in the stations readings (not only the higher trees)
Some googling came up with figures of 75 degrees C above the artificial grass in these circumstances. Natural grass can heat up to 40.
So it wasn’t some private device situated on the roof of a house this time?
Wasn’t it the last time (France) either, although many here belived that.
Look for comments from Francois here.
Or there:
https://wattsupwiththat.com/2019/06/29/frances-new-hottest-recorded-temperature-ever-is-in-question-guess-where-it-was-measured/#comment-2735165
Sorry, but I don’t get it : you are refering to some comments which have been debunked : the station is not situated on the roof of a building, it is out in the middle of nowhere and, by the way, a station situated ten km away recorded a temperature slightly higher on that very day (46°, at Vérargues, Hérault, population 776, so it would be difficult to argue about an urban island heat effect) then again, a record high was registered in Paris a month later (42.6°), a bit higher than the previous one in 1947 (40.4°).
You could easily argue UHI effects for Vérargues when you see how close it is to surrounding villages/hamlets. The weather station cannot be far from at least a road and it looks like you can see one through the trees in the background when looking at the link you provided for the “record”
http://www.meteofrance.fr/actualites/74345599-c-est-officiel-on-a-atteint-les-46-c-en-france-en-juin
https://www.google.com/maps/place/34400+V%C3%A9rargues,+France/@43.7261195,4.101123,4520m/data=!3m1!1e3!4m5!3m4!1s0x12b69fd99025ac7f:0x6b7d139ec2f6fc0!8m2!3d43.716449!4d4.100409
Next structure (single Building 50m, next larger structure 120m (cementary) Hamlet 250m with lots of open water (cooling). Orchards with cooling effects around the station.
Road?!? Did you look at the raod you were rerferring to?
You must be joking or dreaming of weather stations where ther is nonting around for hundreds of meters. The station reflect the ordinary landscape in southern France as it is existing for several decades.
If the weather station in Lingen was located near a building, it would be interesting to know what face of the building (north, east, south, or west) it was located. Since the hottest part of a sunny summer day is usually early to mid-afternoon, if the weather station was located to the south or west of the building, in addition to direct sunlight, the building would have reflected sunlight toward the weather station and increased the temperature above the “correct” ambient temperature, which should be measured in the shade. A weather station to the north of the building (in the shade most of the day) would not have as much artificial warming from the building.
The weather station is to the east lof the building.
Next to that, weather stations provide shade to the thermometer and shall be well ventilated. But they shall not be placed in the shade.
Has anyone ever commented about the general location of the small local weather stations in Switzerland?
The vast majority that I have seen are all located right alongside tarred roads or concrete pavements, so that the data can be collected by Bluetooth (or another means of transmission) without the need for the people collecting the data to get out of their vehicles. The temperatures measured there in summer must surely be significantly higher now than when they were located in their original positions well away from paved roads and paths.
Concerning the 46.0 °C registered in France during July, beating by a little bit the highly questioned, but now official measurement of 45.9 °C in Gallargues-le-Montueux (Herault).
This 46.0 °C measurement was performed at the Meteo France weather station in Verargues (Herault).
The official description found in
https://donneespubliques.meteofrance.fr/?fond=contenu&id_contenu=37
is here:
https://drive.google.com/file/d/1oCRiDRevfWtMQk1gb3YAgMBp_JzUTXFL/view
Exact lat/long position of the station: 43.72124 N 4.09666 E
Maps:
https://www.google.de/maps/place/43%C2%B043'16.5%22N+4%C2%B005'48.0%22E/@43.721271,4.0920882,931m/data=!3m1!1e3!4m5!3m4!1s0x0:0x0!8m2!3d43.72124!4d4.09666?hl=en
As Francois accurately explained, the station is ‘in the middle of nowhere’.
Please stop your endless storytelling nonsense about roofs, concrete or asphalt.
It gets a bit boring inbetween.
Rgds
J.-P. D.
Full Acknowledge.