Reposted from the Cliff Mass Weather and Climate Blog
Thursday, July 18, 2019
The Strongest Summer Jet Stream to Hit the Pacific Northwest EVER!
An extraordinary weather event has been occurring above our heads during the past 24-hour. A record that was not only broken, but shattered to little pieces.
The strongest summer jet stream ever observed over the Pacific Northwest.
The jet stream is a narrow current of strong winds in the upper troposphere (roughly 25,000 ft to 35,000 ft above sea level). It is often the conduit for storms and is associated with a large temperature gradient (change in temperature with horizontal distance) in the middle and lower troposphere. Winds in the jet stream are westerly (from the west) and aircraft like to fly in the jet stream going east, while avoiding it going west. You are now Jet Steam certified!
The ECMWF 12-h forecast for 5 AM this morning for the wind speed at the 250 hPa pressure level (about 35,000 ft) clearly shows the jet stream, with the orange/red colors being the strongest winds.

This is a HUGE and very zonal (east-west oriented) jet stream…as shown by the next map at the same time. This looks like January, not July.

But now I will really impress you.
The wind this morning at the radiosonde site at Quillayute (UIL) was 140 knots (161 mph) at the 250 hPa level (again around 35,000 ft). This is amazingly fast for this time of the year.
The plot below shows the climatology of the winds at this level throughout the year at this location, with the red lines being the all-time record for each date (the black lines are average winds for the date, blue lines, the record low winds). Vertical soundings at Quillayute go back to the late 1960s…so we are talking about a half-century of observations. The previous record was around 110 knots…so the 140 knots observed today absolutely shattered the record. In fact, the wind over us right now is greater then the records for any date from April 1 to mid-October.

Record, but lesser winds, are being observed at the next upper air station to the south: Salem, Oregon (see below)

A truly unusual event. And one that should not be pinned on global warming. In fact, several of the global warming jet stream papers (e.g., by Jennifer Francis and others) suggest that global warming will bring a weak and wavy jet stream. This is just the opposite.
Speculation? Low solar sunspot cycle increasing galactic cosmic rays in turn increasing cloud cover effecting ocean currents sounds ridiculous. I’m totally clueless simply parroting some of what I’ve read but excited about the enlightenment soon to appear on these pages!
Though galactic cosmic rays impacting Earth’s solar system are relatively constant, solar magnetic fields (SMFs) extending through the Asteroid Belt (2.2 – 3.2 AU from Sol) fluctuate with solar activity manifest as sunspot counts. Because SMFs deflect ambient cosmic rays, shielding Earth from radiation that seeds global cloud-cover, high sunspot counts warm planetary temperatures by increasing total solar irradiance (TSI), while decades-long “dead sun” Grand Solar Minima (long-term zero sunspots) such as those of AD 1380 – 1420, 1645 – 1715, induce heavy overcast driving Little Ice Age chill.
This scenario dates, first, from Danish physicist Henrik Svensmark’s 2005 correlation of solar magnetic flux with cosmic rays; and second, from Russian researcher Valentina Zharkov’s
2016 – ’18 showing that “active” sunspot counts govern the strength of inner-system Solar Magnetic Fields.
Meantime, for the record, in December 2017 Australian researcher Robert Holmes’ peer-reviewed Molar Mass version of the Ideal Gas Law definitively refuted any possible CO2 connection to climate fluctuations: Where GAST Temperature T = PM/Rp, any planet’s near-surface global Temperature derives from its Atmospheric Pressure P times Mean Molar Mass M over its Gas Constant R times Atmospheric Density p. Absent any carbon-factor, proportional CO2 is a non-issue.
In brief– decades of geophysical studies attests that global temperatures have been trending downward for the past 3,300 years. If this continues, despite Klimat Kultists’ bleats-and-squeaks a looming 70+ year Grand Solar Minimum to c. AD 2100 –following Earth’s 500-year Little Ice Age from AD 1350 to 1850/1890 and its 140-year “amplitude compression” aftermath to c. 2030– likely portend geophysically induced (plate tectonic vs. climatological) 102-kiloyear Pleistocene glaciations up to 2½ miles deep.
Thanks Lloyd, detailed, interesting and thought provoking. It’ll take me a while to digest.
Though galactic cosmic rays impacting Earth’s solar system are relatively constant, solar magnetic fields (SMFs) extending through the Asteroid Belt (2.2 – 3.2 AU from Sol) fluctuate with solar activity manifest as sunspot counts. Because SMFs deflect ambient cosmic rays, shielding Earth from particle-radiation that seeds global cloud-cover, high sunspot counts warm planetary temperatures by increasing total solar irradiance (TSI), while decades-long “dead sun” Grand Solar Minima (long-term zero sunspots) such as those of AD 1350 – 1420, 1645 – 1715, induce heavy overcast driving Little Ice Age chill.
This scenario dates, first, from Danish physicist Henrik Svensmark’s 2005 correlation of solar magnetic flux with cosmic rays; and second, from Russian researcher Valentina Zharkova’s
2016 – ’18 showing that “active” sunspot counts govern the strength of inner-system Solar Magnetic Fields.
Meantime, for the record, in December 2017 Australian analyst Robert Holmes’ peer-reviewed “Molar Mass version of the Ideal Gas Law” definitively refuted any possible CO2 connection to climate fluctuations: Where GAST Temperature T = PM/Rp, any planet’s near-surface global Temperature derives from its Atmospheric Pressure P times Mean Molar Mass M over its Gas Constant R times Atmospheric Density p. Absent any carbon-factor, proportional CO2 is a non-issue.
In brief– decades of geophysical studies attest that global temperatures have been trending downward for the past 3,300 years. If this continues, a looming 70+ year Grand Solar Minimum to c. AD 2100 –following Earth’s 500-year Little Ice Age from AD 1350 to 1850/1890 and its 140-year “amplitude compression” aftermath to c. 2030– likely portends geophysically induced (plate tectonic vs. climatological) 102-kiloyear Pleistocene glaciations up to 2½ miles deep.
One influence which is never mentioned is the radioactive poisoning of the Pacific. Due to the mass die off of plankton allowing sunlight to penetrate and heat the ocean to greater depths than ever before possible. As the ocean temperature increases wind temperature will increase accordingly as well. Moisture content will also increase leading to higher rainfall totals.
That piece is pretty straight. What about the rest of the world?
http://www.stormsurfing.com/cgi/display_alt.cgi?a=glob_250
Turbulence is cool.
Indeed
https://earth.nullschool.net/#current/wind/isobaric/250hPa/orthographic=43.92,-97.23,412
It was cold too, north of the jet stream, only getting to a high of +9 (48F) in Central British Columbia, and almost freezing overnight at the higher altitudes in the mountains. Probably the coldest July so far I have seen in over 60+ years. No one has cut hay around here yet…I guess the global warming is over now and this is the start of the cooling trend. It was sort of like this 60 years ago the old timers are saying including the hot dry summers preceding with bad forest fires in back to back years as well. Wouldn’t really surprise me.
https://earth.nullschool.net/#current/wind/isobaric/250hPa/orthographic=-100.58,48.99,325/loc=-122.140,52.071
E2, c.62yrs is a full cycle of short to medium term weather from solar system mechanics. Stronger effects are possible,depending on how gravitational pulls from planets affect the Tayler Instability. More to come as we learn more, but even part of NASA now admits the above.
Yep, Sol and IGL, they rule. Strange cold to come. Brett Keane
So THAT’s why I had to stand my corn plants back up this morning!
You must have some mighty tall corn there Nick. Most of the corn I’ve seen this year has been knee high to a Barbie Doll.
Corn here is 9 ft. Best in years. Trifid-like.
Fantastic – watch this space – what will the outcome be?? What a great time to live in – when we can observe such weather happening in all its details. After a couple of hundred years of further observations we may even be able to speak with some confidence about future climate.
You mean real science and not this Political Science: Global Warm…aaahh we really meant Climate change all along, UN alarmism they have been whining about for the past 20 years right Andy.
https://earth.nullschool.net/#current/wind/isobaric/250hPa/orthographic=-106.66,37.53,651/loc=-117.078,47.177
What a cool map!! Can I figure out the best surfing conditions from these jets teams?
drag and rotate….look what’s going on in So Africa
There is a Surface Wind component that could allow you to see where wind induced swells could occur
It does have a Wave Layer
https://earth.nullschool.net/#current/ocean/primary/waves/overlay=primary_waves/orthographic=275.18,1.33,496
Really cool.
Parts of it looks like Edvard Munch’s The Scream!
What’s causing the jet to go so fast?
Pressure gradients. CW High to the south. CCW Low to the north. Tight isobars in the stratosphere in between.
Uncontrolled white men and their use of fossil fuels.
Brexit or Trump, surely?
Those wild and crazy guys who like large American breasts.
To be fair, etc don’t have to be American, per se.
Arnold in his Hummer…I’ll be back
Or what Johann Sebastian might have said
I’ll be Bach
There, I feel much more Composed
We used to tell a joke in the 70’s that they dug up Bach’s coffin and opened it to find his skeleton busy erasing manuscript from the insides of his casket. When asked about his activity he replied: “What do you think I’m doing… I’m decomposing”.
Hi All – just been looking at Toto’s link above.
Spare a thought for the jet stream that’s above Cape Town right at this moment. Makes it’s northern hemisphere brothers look puny by comparison.
Thirty years ago, every weekend over a 14 year period, I would make a pest of myself at the Met guys at the airport – getting the met balloon readings while the ink was still wet! I would then throw the bones for out gliding club and do my best to tell them what we could expect for the day’s gliding.
Then one afternoon there was this stream of alto-cumulus clouds sprinting across from west to east at an incredible 420 km/hr.
A most memorable and wonderful sight.
cheer edi
Well, that is about the maximum jet stream velocity I have ever observed.
This is surely merely the strongest jet stream in the very short history of monitoring jet streams? I understand we didn’t even know about them until 1945.
I wonder what it was like in the 1920’s and 30’s?
The jet stream was discovered in the 1920’s by the Japanese (Wasaburo Ooishi) and used to great effect during WWII
Specifically, but attaching incendiary bombs to balloons which would float over the Pacific on the jet stream to hopefully ignite the vast US forests. Some of the balloons reached the US intact, but no confirmed reports of starting fires as planned (though how you’d confirm I have no idea).
There was at least one confirmed “kill” in Bly, Oregon.
https://www.history.com/news/attack-of-japans-killer-wwii-balloons-70-years-ago
But one did kill several people from Bly Oregon who were out in the woods on a picnic.
The 1920’s and 30’s was the Dust Bowl years. Read “The Worst Hard Time” by Timothy Egan.
Egan also has: The Big Burn: Teddy Roosevelt and the Fire That Saved America
It also has interesting weather related information.
Be prepared, these are sad episodes, well told.
Bingo, tonyb!
Reading through the article, the author was continuously hyping the concept of “ever”!
Leaving me wondering where fifty years of wildly variable ability to monitor jet streams allows anyone to recognize ‘World Record’ or ‘All Time Record’ or ‘Fastest Ever’ silliness about wind speeds?
Note the details, i.e. all of the details, not just the ones the author likes or prefers!
Maybe, just maybe, in five hundred years one could get a little enthused about fast winds…
Nope. Did not impress me at all.
Claiming the wind speed is impressive is similar to declaring a thunderstorm had the fastest winds, ever!
It’s just a weather event! Collect all of the details and maybe, someday, humans will understand why. One thing is certain; the pseudo science known as climate alarmism will never identify the real reasons.
Right on! “Ever observed” covers at most just the last 50 years, whereas “ever” covers, oh, some 3+ BILLION years of Earth’s dense, stable atmosphere.
Who knows when the first jet streams appeared, but I’ll bet it was closer to 3 billion years ago than 50 years ago.
ATheoK – I think that the post was written with tongue just slightly in cheek. The extravagant use of language was making a parody of the typical news item with “hottest” “coldest” “wettest” “driest” “strongest” (tick where applicable) – EVER!!! and it’s caused by climate change, and we’re to blame and we have 15 minutes to save the planet or we’re all gonna die!!
Cliff tries to inform. Try not to read his blog entries as serious scientific papers.
The jet stream this week is interesting.
Would you have known this if Cliff had not explained it?
Thought not.
Now, have another beer and relax.
A greater density of measuring stations will almost always lead to records being broken, even when the phenomenon being measured is not changing in strength.
There is also the – were we looking for this before phenomena. I wouldn’t be surprised if we went through the post 1945 data, and “homogenized” the results with that of our modern equipment that there will be several of these events found of similar scale.
I think I read a claim this week that the forecast heat in Europe next week is “caused” by a weaker jet stream?!
I suspect that was the usual lazy Climate Science, blaming climate change for something based on whatstandard supposedo to happen without checking that it was actually happening.
Ja.ja.
It is globally cooling.
I am on the global cooling/possible lead in to a new Ice Age side of the fence. I can’t say “there is no climate change” because the climate is constantly changing – that is its nature, it is change. If you look around for older papers that haven’t been memory holed, part of an Ice Age is a period of warming before the big chill.
We are in an ice age. The ups and downs in this ice age are less cold and more cold periods. When in a less cold period like now there is generally a “climate optimum” period, in the past, some have been sharp and fleeting, and some plateau like and sustained. When we are in a more cold period plateaus appear to not be a defining feature thank goodness but more like a jagged “V” and we are about 6 degrees or more cold than now.
We are currently in a less cold period of the plateau kind inside an ice age. That said, I think we passed our climate optimum some time ago. When we begin the steep, jagged decline to a more cold sharp trough is somewhere in the distant future.
The following link is easy to read and can be verified in peer reviewed literature if the reader wants to take the time to do so. I have done it myself many times.
https://www.thespectrum.com/story/opinion/mesquite/2017/06/23/global-warming-were-middle-ice-age/412206001/
Try telling that to others. I’ve been trying but to no avail. They still see this as man made climate chaos with less snow and hotter than ever temperatures. I am ashamed to share this planet with idiots like those.
Presumably this is merely a gust in the climate perpspective.?
My first thought is: “what is the probability of having the ‘strongest summer jet stream'” Unfortunately almost none of the required data is available:
1.How often does the jet stream change (A)
2. How many years has it been recorded (B)
AxB gives the number of possible events of which one will always be “strongest”. The next question is whether this event is consistent with a long string of random events, or whether it is abnormally high. Again the information is missing.
Basically, without any of this necessary information to put this “highest evah” into context, it is not information but climate porn.
Solar F10.7 flux has been at or below 68.2 now for 7 weeks, since about May 20th.
Pretty quiet solar wind too over that period.
But not unusual for SC minimum.
I suspect we’ll be seeing an early end to summer though. Put down some firewood now, and fill the propane tanks.
Um, just a tempo flux. Plenty of summer left. Heading for mid 90s and dewpt near 80F where I live today.
So your “Heat Index” is about 105F. My area is forcast for a 110 heat index today. I’m going to have to get out and mow early. In about an hour, as a matter of fact.
I think for me personally, the high-humidity heat is worse than the dry heat. A 95F temp with high humidity affects me more than a 105F temp with low humidity.
I notice states farther north than Oklahoma, like Nebraska and Kansas are showing air temperatures climbing over 100F today while here in Oklahoma the high air temps are going to be five or more degrees lower. That’s all because Oklahoma has much more moisture avialable than the states farther north. Once we dry out around here a little bit, our air temperatures will start to climb up over 100F, too.
It’s miserable either way, 95F and high humidity, or 105F and low humidity.
The weather forcasters are predicting “lower” temperatures in Oklahoma for next week, in the lower 90’sF. Usually this time of year the temperatures are climbing, climbing, climbing.
Maybe we’ll have another nice summer, not too hot and not too dry. Here’s hoping.
Cooler South and East US is coming next week.
https://drive.google.com/file/d/1tl_jZ1C5WmXPhJHxHVjVbHwfCpuF-i3L/view?usp=sharing
My first question is, “What happens now?” Do those of us east and south of the current jet stream get a blast of cooler air? Warmer air than the heat we’re in right now? Rain? What?
The record jet stream is interesting, but I searched in vain for any hint of what changes, if any, it might bring about, where they might occur, how long they might last, or anything else of use to me as a gardener.
My “rule of thumb” has always been:
The North side of the Jet Stream is always “sucking” the cold air down from the Artic, whereas the South side of the Jet Stream is always “sucking” the hot air up from the Equator.
Or, another way of saying said, …… the near surface temps north of the vertical position of the Jet Stream will be cooler than the near surface temps south of the vertical position of the Jet Stream.
Forecast is for cooling next week in the East, not sure it has anything to do with the Jet Stream. However, if you are flying from Seattle to anywhere east, you should make good time.
“The record jet stream is interesting, but I searched in vain for any hint of what changes, if any, it might bring about, where they might occur, how long they might last, or anything else of use to me as a gardener.”
One thing the jet stream will do in its current configuration is to keep the eastern two-thirds of the United States hot and dry. The speed of the jet stream won’t change this, and is a local, temporary phenomenon that is a record only because we have very little data in the past to look at. It’s a record since 1960, but we have very little information about jet streams before that time.
The jet stream is behaving normally as far as I can see. In the winter it dips down into the lower 48 states and during the summer it flows straight across from west to east along the U.S./Canandian border, more or less.
The jet stream is the superhighway for storm fronts. When the jet stream dips south it brings storm fronts to the central U.S. When it pulls back north, it takes the storm fronts with it and leaves the central U.S. hot and dry. Then those in the central U.S. have to depend on being close enough to the coasts to get storm fronts moving into their area and those in the central U.S. have to hope and pray a tropical storm comes their way.
The Middle of August is the hottest part of the year and that’s less than a month away, so we are not in for an exceptionally hot summer. We’ll get a few days of high heat but that’s about all there will be time for before the weather breaks in August We certainly won’t have a summer like we had in Oklahoma in 1936 with over 60 days over 100 degrees F, about a dozen of those days over 110F and four of those days were 120F.
Summertime around here nowadays is a Walk in the Park! 🙂
Here are some pretty graphics of Jet Stream ”meandering” presented by NASA that one should check out.
https://svs.gsfc.nasa.gov/3864
Careful! A forecast is not an observation. (But you did have radiosondes to back up the forecast.)
These high-speed streams embedded in jet streams are a well-known phenomenon known as jet streaks. Jet streams are a kind of thermal wind, observed as vertical wind shear induced by pressure gradients and Coriolis effects. A weak surface convergence coupled with strong upper-air divergence will produce these streaks. Usually stronger in winter because the Sun heats the upper air more than surface.
Neat weather event. Not climate. Still, pretty neat overall.
Climate change is causing jet stream extremes and jet stream chaos. We’re doomed.
I don’t think this jet stream super max was well predicted by the 5 day ago GFS. Does anyone know if any of the other models did a good job on this.
As of now, the GFS predicts a pretty decent cool down for the Upper Great Lakes by Sunday and a similar cool down for the midwest and northeast on Sunday thru Tuesday.
In wake of weeks of very warm/hot/humid conditions. The cool-down will be welcomed and get us back near our average after 1 or two below average days.
Just a guess, but the jet seems to be along the boundary between the Polar cell and the Ferrel cell. This would suggest cold polar air descending to the north and warm (hot) air descending to the south. And lo, we’re having a heat wave.
Check out the JS graphic on tis site.
https://weather.com/news/weather/news/2019-02-19-jet-stream-winds-among-highest-on-record-southwest-northeast-us
By Monday or Tuesday that “loop” in the JS will likely have moved off to the East with cooler temps following it.
It should not be, but will be . for instance the very wet US since 2013 is opposite of their forecasted dust bowl and perma drought and indicative of the “resistance” to the warming in the mid and upper levels leading to enhanced condensation processes But sure enough the opposite of their forecast now becomes the reason they say they are right. I wrote about that here
https://www.cfact.org/2019/07/17/33553/
…Every meteorologist around my age knows the old adage, never trust a warm-up that starts with rain to last long. The reason that is true it means something is resisting the warm air. In a large sense, the heavy US precip is a similar signal. There is resistance to the warming. They know no one is going to call them out,
“Lost in the article was the fact that in spite of the warm June, the western Pacific typhoon season which runs all year round, is going thru one of their quietest periods, if not the quietest, since March 1st on record .”
Ren
Sea surface temperatures are one factor, but should not be used in isolation for TV activity. It is the volume if convection that is the key over the whole equatorial convection interface that is the key to TC occurrence and frequency.
So far this year it is very low, all of the data that I look at confirm a very “soft” atmospheric situation.
July 21st is the mean date for increased activity most notable in the Atlantic sector. All three TC basins are inactive for the same reason.
Therefore the 2 meter temperature anomalies will remain anomalously high.
Regards
TV = TC
The phenomena on the 21st July (mean date) causes a tightening or restriction to convection transport poleward. Almost a compression effect. I expect this occur late this year compared to mean.
With low convection the “phenomena”
increases in intensity reducing the threshold. That is, it compounds. If the current conditions prevail expect Atlantic TC to form closer to the USA, increasing rate of landfall. One has already occurred, Barry.
So let’s say 3 landfalls, ACE of 80.
Regards
In July 1995, there was a record heat wave that caused a large number of deaths of elderly and indigent people in Chicago. There were many excuses made for it, but it was mostly heat-related because they were vulnerable to the heat. It lasted just long enough to cause an upgrade in weather reporting and the startups of things like cooling centers.
Now people are stealing large air conditioners right out of homeowners’ and businesses’ back door properties.
I keep wondering when the ecohippies are going to realize that they have zero control over any of this.
Does this mean lots of rain in California? Please tell, I’m planning a holiday.
I used to live in California, and my best guess is that the jet stream is too far north to have an winter pattern for California, Washington might be wet, but it notoriously is normally.
“Winds in the jet stream are westerly (from the west) and aircraft like to fly in the jet stream going east, while avoiding it going west. “
That can’t be right. Flying into strong winds reduces your ground speed. Surely it’s the other way round?
Flying ‘with the flow in the jetstream flowing to the east’ and vice versa.
Sorry, read that as planes going east.
In mid 70s was navigating a C5A from Alaska to Japan and ran into a Jet stream of 250+ knots, our ground speed was about 200 knots. The ne t day flying back we had a ground speed of over 750 knots. What a difference the direction makes.
Toto’s link is cool. Forecast shows jet breaking up & a piece goes deep south into TX & even Mexico. Big cool-down in the US….
It’s gotta be gorebull weirding!
Meanwhile, with the current heatwave affecting a good part of the east, the narrative is that heatwaves are getting “more extreme” and that we can expect them to become even worse going forward due to (of course) “climate change”. I have reached the point where now, I would welcome a significant cooling of perhaps as much as 1C, just to shut the friggin’ Climate Cabal up! Of course, that could take a decade or more. Sigh.
Bruce, I’m walking around in the “extreme heat” yesterday (in an urban area!), and found it remarkably pleasant.
That’s because it’s still dry. Just wait til the humidity creeps in, and it will.
Nope — standard MD high humidity.
Anyone care to explain to me why they express altitude in terms of pressure (hPa)?
They don’t, he’s just translating o something understood by laymen.
Many of the instruments operate on pressure measurements, which are easy to take for many devices, while altitude is harder, requiring a laser rangefinder of similar. But pressure correlates with altitude pretty well, and absent weather, perfectly, so he can adjust the actual measurement in hPA and report it as approximate altitude for people for whom an hPA metric is meaningless (I am in that camp too, just because I know how it works doesn’t mean my gut has any baseline for these figures).
Ocean depth usually works this way too, for that matter.
It is a way to have consistency. “Altitude” is better measured with air pressure – aircraft (for example) operating in reference to a pressure level will be referencing the same thing and have consistency among and between each other. Height above ground, on the other hand, is largely irrelevant unless conducting low visibility operations at low altitudes or needing to reference height above ground for other reasons such as regulatory restrictions on low altitude over populated areas and so forth.
When height above ground is a concern, the altimeter (pressure sensor) needs to be frequently reset to the local sea level pressure reference as pressure systems are traversed. At higher altitudes, (18,000′ in US) Aircraft will all be utilizing the same “standard” sea level reference and height above ground will vary across pressure systems.
In meteorology, I would surmise that the use of various pressure levels is a convention to obtain consistency and uniformity.
The contours are constant isobars which can vary somewhat in altitude. This program has predictive value also. https://earth.nullschool.net/ One of the neat things is that when you go to a time other than “now” the date appears in the URL, so you can go to any past date by simply changing the date in the URL and hit enter. (Useful for looking at past hurricanes.)
Surface zero
1000 mb ~100 m, near sea level conditions
850 mb ~1,500 m, planetary boundary, low
700 mb ~3,500 m, planetary boundary, high
500 mb ~5,000 m, vorticity
250 mb ~10,500 m, jet stream
70 mb ~17,500 m, stratosphere
10 mb ~26,500 m, even more stratosphere
note: 1 hectopascal (hPa) = 1 millibar (mb), 1000 mb = 1 atmosphere
Keyboard Shortcuts
e show menu (toggle on/off)
esc close dialog/menu
k forward one hour
K forward one day
j backward one hour
J backward one day
n go to now
i go up one pressure level
I go to 70mb (stratosphere)
m go down one pressure level
M go to the surface
g toggle grid on/off
p toggle animation on/off
H enable/disable high definition mode
The NCEP GDAS and CPC temperature and height analyses are used to monitor processes in the Stratosphere and Troposphere.
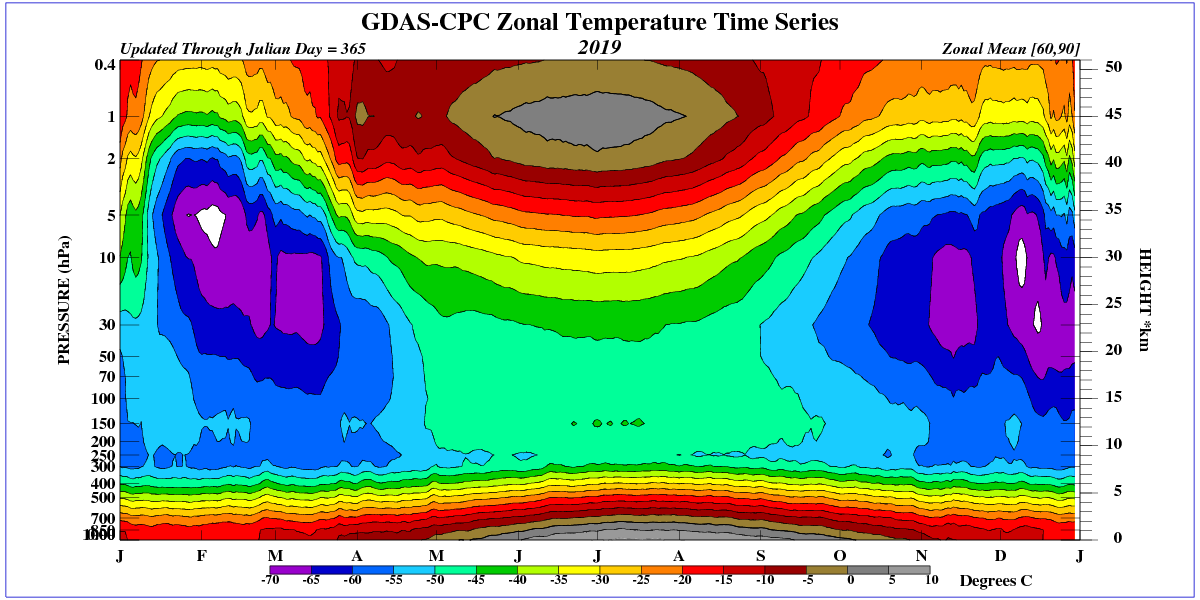
The Tropopause begins when the temperature gradient drops sharply.
Having spent time doing upper air observations I can tel you. Radiosondes cannot measure altitude, they can only measure temperature, pressure, and humidity. Wind speed is determined by bouncing radar off a reflector attached to the radiosonde. The height of the balloon at mandatory reporting levels (1000mb, 850mb, 700mb, 500mb, etc) is computed from the ideal gas laws using the average temperature and humidity between the mandatory levels. It is much easier to plot heights at a mandatory level then to try to figure out what the actual pressure is at 18kft or whatever and plot that. Since the computations for the mandatory levels are already done you don’t have to do the additional computation of trying to figure out what the pressure is at your chosen altitude, which won’t be at the same level as reported for the mandatory level.
another record, wow. and we have been recording this stuff for how long?????
Circulation over eastern North Pacific has been stable for many months.
http://tropic.ssec.wisc.edu/real-time/mtpw2/webAnims/tpw_nrl_colors/namer/mimictpw_namer_latest.gif
Circulation over the eastern North Atlantic is similarly stable.
That is why there are no hurricanes in the eastern Atlantic.
https://www.tropicaltidbits.com/sat/satlooper.php?region=eatl&product=wv-mid
“And one that should not be pinned on global warming. In fact, several of the global warming jet stream papers (e.g., by Jennifer Francis and others) suggest that global warming will bring a weak and wavy jet stream. ————— This is just the opposite.”
The atmosphere and its albedo reflect away 30% of the incoming solar energy making the earth cooler. Remove the atmosphere and the earth gets hotter.
Radiative GreenHouse Effect theory claims ——– exactly the opposite.
That the earth without an atmosphere would be similar to the moon, blazing hot lit side, deep cold dark, is not just intuitively obvious, but that scenario is supported by UCLA Diviner lunar mission data and studies by Nikolov and Kramm (U of AK).
This actual and indisputable fact negates, refutes, guts and tosses RGHE theory straight onto the long established rubbish heap of failed scientific theories together with Vulcan, phlogiston, Martian canals, luminiferous aether, spontaneous generation, tabula rasa, phrenology and cold fusion.
No RGHE, no CO2 warming, no man caused climate change or global warming.
Jet stream forecast.
http://squall.sfsu.edu/scripts/namjetstream_model_fcst.html
Better get ready for more records in 2020 as solar minimum-like conditions continue and look back for comparison to solar minimum 2009 in Northern Hem.
How long time is “EVER”?
While a record strong over the Pacific Northwest is it at its weakest somewhere else? Just thinking about conservation of angular momentum.
I am afraid it is not a solid body.
It’s the sum of solid bodies ie molecules and atoms. Coriolis force is used in the fluid mechanical analysis of the jet stream. The reason why it has such high speeds is because of the ballerina behaviour which relies on conservation of angular momentum as air moves further from the equator and closer to the axis of rotation.
Yep. 140 knots is a strong summer jet stream. I note that it was located at a fairly high latitude and associated with a strong cold spell.
Fastest jet I ever encountered was around 225 knots, but that was in January 1964 (https://overedicated.blogspot.com/2019/03/fighter-drags.html). That one ran from about New Mexico, sweeping northeast toward Maine, and then swept southward toward Spain.
I experienced a redux of that in the winter of 1970 flying from Puerto Rico to Madrid, Spain
The author’s use of the term “winds” implies that there are more than one…wonder where one wind ends and another begins. I submit that there is one wind which is connected throughout the planet’s atmosphere and whilst the wind may vary in speed and direction at various points on the earth, it remains one wind.
I think that flat and fast jet streams keep cold air closer to the poles and warm air closer to the tropics. My uneducated guess is that the northern ice minimum will be higher this year. It already looks like the DMI high arctic temperatures are starting to go down.
Anomalies in the height of the sea surface on the equatorial Atlantic.
Your jet streams are non events. About thirty years ago I dawdled westwards for about five hours with 170 kts on the nose. Next night, coming home, the wind had dropped away to 160 kts but we whistled back at about 520 kts groundspeed in our sedate sub sonic airliner. The control towers at each end were kind enough to log the overhead times and the FAI people gave us a world record uncontested to this day. (No: 1766 for the sceptics). Sorry, I meant to make the point that this was not a jet stream with associated entry and exit agro. It was a simple pressure pattern. I still have the met chart somewhere if anyone is interested.
They will soon be telling us that it is all caused by CO2, our SUVs and Climate Change…..Yawn!
Waiting for Hollywood to declare jet travel pollution as the cause and that they are all planning a mass protest in Washington DC as soon as they can confirm airline tickets.
They all have private jets
If you are flying from Seattle to say Chicago, you should make really good time – (depending on if they have a gate open). . .
As reported by the BBC, due to climate change we can expect more extreme weather https://www.bbc.co.uk/news/world-us-canada-49049378
What I find interesting is jet streams this strong are usually accompanied by strong surface low pressure systems. Not so much this summer. In fact this summer has been unusually “normal.” No heat waves no extended days of rain. Just morning clouds and afternoon sunshine. Summer weather in the Pacific Northwest is the best. Even when it hits 100ºF (every couple of years or so) it cools off at night into at least the 60’s. (Don’t ask me about the S.A.D. inducing winters)
“The North side of the Jet Stream is always “sucking” the cold air down from the Artic, whereas the South side of the Jet Stream is always “sucking” the hot air up from the Equator”
I agree. Here on the Canadian Prairies whenever the jet stream moves away from its ‘normal’ summer location usually drifting too far north, summer rains become fewer in number and intensity.
I always remember the dry summers of 1988/1989. During the evening weather reports, there were quite a few discussions about the jet stream, back when CAGW was not the cause of every sparrow that falls from the sky.
Has anyone looked in that Jet Stream for Flight 33?
For those not of a certain age, I am referencing The Twilight Zone episode: Odyssey of Flight 33!
“It is often the conduit for storms and is associated with a large temperature gradient (change in temperature with horizontal distance) in the middle and lower troposphere. ”
Should that read “vertical” distance, or am I misunderstanding something?
The strongest summer jet stream ever observed over the Pacific Northwest was all https://www.google.com/search?client=ms-android-huawei&ei=-0s1XZ_4A8GxrgSo7qHgBA&q=Airbus+Brasilia+descending+drowned&oq=Airbus+Brasilia+descending+drowned&gs_l=mobile-gws-wiz-serp. missed.
+ an unfrench pitot tube.