By Philip Mulholland
1. Introduction.
The following image shows the Earth’s outgoing longwave radiation recorded by the CERES (Clouds and the Earth’s Radiant Energy System) Instrument onboard the NASA Aqua Satellite (Damadeo and Hanson, 2017). This image is compiled from measurements made on March 18 2011, near the time of the Vernal Equinox.

Image credit: NASA
The colour table legend records the energy flux of the outgoing radiation. This flux ranges from a minimum value of 150 W/m2 displayed as white, to a maximum flux of 350 W/m2, displayed as yellow. Using the Stefan-Boltzmann law of radiative emission these energy flux values can be converted to emission temperatures using the following equation: –
Where T is the thermodynamic temperature in Kelvin.
j* is the black body radiant emittance in Watts per square metre.
σ is the Stefan-Boltzmann constant of proportionality.
(Sigma has a value of 5.670373 * 10-8 W m-2 K-4)
Using equation 1 we can determine that the emission temperatures recorded by the Ceres instrument range from a minimum value of 226.8 Kelvin (-46.2oC) for the 150 W/m2 low-end flux, to a maximum value of 280.3 Kelvin (7.3oC) for the 350 W/m2 high-end flux.
2. Calibrating the CERES image
The CERES image is a single snapshot of the Earth’s thermal radiant emission to space. This image contains a significant amount of information, however to understand this in its global context we must first calibrate the image against known measurements of the major components of the Earth’s atmospheric system.
The Earth’s atmosphere is a dynamic system composed of three separate types of interlocking cells, symmetrically distributed in each hemisphere. These cells consist of two thermal cells and one mechanical cell, they are: –
1. The tropical thermal Hadley cell located between the equator and latitude 30 degrees.
2. The temperate mechanical Ferrel cell located between latitude 30 degrees and latitude 66.56 degrees.
3. The frigid thermal Polar cell located around each pole and defined by the Arctic and Antarctic circles.
The global areal distribution of each cell is as follows: –
1. The Hadley cells occupy 50% of the surface area of the globe, and in total intercept 60.9% of the sun’s insolation.
2. The Ferrel cells occupy 41.75% of the surface area of the globe, and in total intercept 36.29% of the sun’s insolation.
3. The Polar cells occupy 8.25% of the surface area of the globe, and in total intercept only 2.81% of the sun’s insolation.
The high concentration of insolation intercepted by the tropical Hadley cells, compared to the low insolation intercepted by the Polar cells, is the fundamental reason for the low surface temperatures found in the polar regions of our planet.
Visual inspection of the CERES image shows the presence of cloud tops associated with the convective storms of the equatorial intertropical convergence zone (ITCZ) or doldrums. These storms are radiating at 150 W/m2 and have an emission temperature of 227 Kelvin (-46.2oC). In order to determine the elevation of this emission, we need to establish three atmospheric parameters for the Hadley, Ferrel and Polar cells, which are: –
1. The height of the tropopause.
2. The temperature of the tropopause.
3. The environmental lapse rate of the atmospheric cell.
Using these three metrics we can then calculate the temperature elevation profile that relates to the given emission rate for each of the three atmospheric circulation cells. Published information for the temperature of the tropopause is not easy to establish, however using various sources the values used in this analysis were obtained and are recorded in Table 1.
| Cells | Hadley | Ferrel | Polar |
| Tropopause Height (km) | 17 | 13 | 9 |
| Tropopause Temperature (Celsius) | -83 | -78 | -78.5 |
| Environmental Lapse Rate (K/km) | -6.5 | -6.5 | -6.5 |
| Information Source | Environmental Lapse Rate |
Table 1: Atmospheric Cell Parameters.
Using the values established in Table 1 we can now determine the top down temperature profile for each of the three atmospheric cells. The calculations for the Hadley cell show that to maintain a 17 km tropopause with a temperature of 190 Kelvin (-83oC) and a lapse rate of -6.5 K/km, then the average surface temperature of the tropical zone must be 301 Kelvin (27.9oC).

Table 2: Hadley Cell – CERES Image Emissions Calibration Table.
Converting this average surface temperature of ~28oC into a radiant energy emission flux, by using the Stefan-Boltzmann equation, we can establish that the tropical surface energy flux is 465 W/m2. This value is 115 W/m2 higher than the maximum observed flux of 350 W/m2 in the Ceres image, and so we have established that this image does not record direct sea level surface radiant emission. Rather, with this image we are observing the atmospheric temperatures at elevations of 3,160 m (10,370 ft) and above. Consequently, all high elevation land surfaces in the latitude zone of 30oS to 30oN, such as the Tibetan plateau at 4,500m (14,750 ft), will be capable of directly emitting thermal radiant energy to space through the overlying atmosphere.
The calculations for the Ferrel cell show that to maintain a 13 km tropopause with a temperature of 195 Kelvin (-78oC) and a lapse rate of -6.5 K/km, then the average annual surface temperature of the temperate zone will be 280 Kelvin (6.5oC).

Table 3: Ferrel Cell – CERES Image Emissions Calibration Table.
Converting this average surface temperature of 6.5oC into a radiant energy emission flux, by using the Stefan-Boltzmann equation, we can now establish that the temperate zone surface energy flux is 346 W/m2. This value is 46 W/m2 higher than the maximum observed flux in the Ceres image of 300 W/m2 for the temperate zone as seen from space. Once again, although this image does not record direct sea level surface radiant emission, all land surfaces with an elevation above 1,500 m (4,920 ft) will be capable of directly emitting thermal radiant energy to space through the overlying atmosphere.
The calculations for the Polar cell show that to maintain an 9 km tropopause with a temperature of 194.5 Kelvin (-78.5oC) and a lapse rate of -6.5 K/km, then the average annual surface temperature of the polar zone will be 253 Kelvin (-20oC).

Table 4: Polar Cell – CERES Image Emissions Calibration Table.
Converting this average surface temperature of -20oC into a radiant energy emission flux, by using the Stefan-Boltzmann equation, we can now establish that the polar zone surface energy flux is 232 W/m2. This value is just 7 W/m2 higher than the maximum observed flux in the Ceres image of 225 W/m2 for the region of the Southern Ocean, south of the Antarctic circle. This calculation demonstrates that all parts of the polar regions above 310 m (1,020 ft) elevation, and in particular the high elevation ice domes, will be capable of directly emitting thermal radiant energy to space through the overlying atmosphere.
3. Conclusion
Using the average surface temperature values calculated for each cell (Tables 2, 3 & 4), combined with the percentage of the global areal distribution of each cell (Table 5)

Table 5: Calculating the Global Areal Distribution of the Atmospheric Cells.
we can now compute the average annual surface temperature of the Earth (Table 6).

Table 6: Calculating the Global Average Temperature of the Earth.
The average temperature of the Earth determined by this calculation method is 288 Kelvin, which is the currently accepted value of 15oC used by climate science.
4. Discussion
The process of establishing the average temperature of the surface of the Earth presented here, relies on the following atmospheric measurements and fundamental planetary parameters.
These are: –
1. The height of the tropopause for each atmospheric cell.
2. The temperature of its tropopause.
3. The environmental lapse rate of each atmospheric cell.
4. The relative proportion of the Earth’s surface occupied by each cell.
With these measurements established, the global average temperature of the Earth is simply the arithmetical sum of the relative proportion surface temperatures for the three atmospheric cells.
Perhaps the most interesting part of this analysis is the apparent coincidence between the maximum surface elevation of the Antarctic Icecap at Dome A (4093m) and the maximum elevation of supercooled water (Moore and Molinero, 2011) in the atmospheric profile of the Polar Cell (Rubin, 1953). It would appear that the vertical elevation of continental ice caps is limited by atmospheric processes, however it is equally clear that no such vertical constraint occurs with solid rock land surface elevation. Because mountain ranges can reach vertical elevations that lie within the radiant transmission zone to space for each atmospheric cell, it appears that these topographic features can form leak zones that emit radiant energy to space independently of the transmission properties of the overlying atmosphere.
References
Beal, A. 2011. The Surface Area of a Sphere Between Parallel Planes. Online Blog
Damadeo, K. and Hanson, H. 2017. CERES Clouds and the Earth’s Radiant Energy System. NASA 9pp.
Moore, E.B. and Molinero, V. 2011. Structural transformation in supercooled water controls the crystallization rate of ice. Nature, 479, 506-508.
Rubin, M.J., 1953. Seasonal variations of the Antarctic tropopause. Journal of Meteorology, 10(2), pp.127-134.
Excel spread sheet containing the source tables for the essay.
Interesting that one can apparently predict the observed Earth temperature with no recourse to greenhouse gases.
That’s because the atmospheric content of greenhouse gases is accounted in the lapse rate, that depends on radiation and convection.
Is it not an interdependence of radiation and convection such that a change in one is neutralised by a change in the other ?
Change the lapse rate slope and a change in convection inevitably follows.
So how has the lapse rate changed from when there was 280ppm of CO2 to now ,where there is circa 405 ppm of CO2?
I do not recall having seen, in the literature, any change in the lapse rate these past 100 years.
Javier,
I’m pretty sure that GHGs play no part in setting the dry adiabatic lapse rate of 6.5 K/Km which is entirely a product of mass and density as per the gas laws. Are you suggesting that they do?
I accept that GHGs will distort the lapse rate one way in rising air and the other way in falling air for a net zero effect but they surely cannot affect the average lapse rate slope globally.
Well done Steven. There has been a willingness to ignore the data in the alarmist community. Data does the dardest things.. like ruin a perfectly wonderful hypothesis.
The lapse rate completely depends on GHGs, particularly H2Ov the main one. That’s the reason the troposphere is higher at the tropics.
http://clivebest.com/blog/?p=5375
Javier,
Are you saying that there is no lapse rate in the absence of GHGs?
There is no doubt that water vapour reduces the lapse rate in rising air simply because water vapour being lighter than air rises more readily than air and so will also rise higher as in the Tropics. However, that is then offset by the faster lapse rate in descending dry air which recovers all the latent heat of evaporation that was used to lift that water vapour in the first place. So, a zero net effect.
The lapse rate is actually caused by declining density with height as per the gas laws and would exist in the absence of any GHGs at all.
First none of you spotted the mistake (300.87+279.50+253.00)/277.79 K not 288 K. Second GHG do not dominate over convection. Convection is 20.5 W m2+atmospheric window 40.5 W m2 total 61 W m2, 278 K is 339 W m2 (1356/4=339) solar energy + 40.5 + 20.5=400 W m2 = 289.8 K. Heat capacity of air produces 283.6 K from solar energy per second. Heat capacity of CO2 is 0.3 K from solar energy per second. Add together you get 284 K -273 K = 10. 278 K -273 K= 5 10C (heated mass) + 5C (solar energy)= 15C (I have a spreadsheet for the solar energy calculations and weight of gases). Any questions twitter tag is @LindsayyuleS
First none of you spotted the mistake (300.87+279.50+253.00)/277.79 K not 288 K.
Sorry Stephen Lindsay-Yule, I don’t know what mistake you are referring to.
Have a look at the Excel cells for Table 6 – Calculating the Global Average Temperature of the Earth.
The Excel worksheet clearly shows that 288K = 150.44K + 116.69K + 20.87K These temperature numbers are the Areal Weighted percentages of the surface temperatures for the Hadley (50% ) Ferrel (41.75%) and Polar (8.25%) Cells respectively.
@Philip NASA’s Earth’s Energy Budget solar global illumination of sun’s energy distribution is spread over entire planet e.g. 174 Petawatts 174E+17 / 4*3.14159265359 x (6178100)^2 x 0.995(emissivity) = 339 W m2 matching the cell average temperature, (300.5+279.5+301)/3 =278 K (339 W m2). You have halved the global illumination of sun’s energy e.g. 174 Petawatts 174E+17 / 2.39*3.14159265359 x (6178100)^2 x 0.995(emissivity) = 390 W m2 288 K and claimed this represents the global average temperature. Not the cell average temperature that covers the entire earth.
@ Stephen Lindsay-Yule May 20, 2019 at 5:19 pm
You have stumped me with this comment. I have no idea what part of my essay you are referring to. I see that I am going to have to start using Willis Eschenbach’s best practice disclaimer.
“MY USUAL POLITE REQUEST: When you comment, please QUOTE THE EXACT WORDS YOU ARE TALKING ABOUT so we can all understand what you have an issue with.”
Javier – The lapse rate is called the ‘adiabatic lapse rate’ look up the meaning of adiabatic
Tropo is from the Greek for movement as in the movement caused by convection – the tropopause is where the movement of the atmosphere due to convection stops. If the heat and humidity at the surface are higher then the amount of latent heat energy to be released is considerably higher, convection currents are a lot more powerful and they reach higher into the atmosphere. So the tropopause where there is no further convection is higher.
CO2 is not involved at all.
Stephen,
The lapse rate exists because the climate system is an open sytem heated at the base (surface) by solar insolation and cooled from the upper atmosphere by radiation. If there were no GHG’s, the emission height for radiative cooling would be at the surface. At equilibrium, this hypothetical planet with a transparent atmosphere would have a surface temperature which balanced incoming radiation and the atmosphere would stabilise at the same surface temperature i.e. no lapse rate. See https://wattsupwiththat.com/2012/01/24/refutation-of-stable-thermal-equilibrium-lapse-rates/ With the actual Earth system, lapse rate at any location varies – diurnally and seasonally in particular. With the addition of GHGs, the expected averaged effect is for a decrease in lapse rate to act as a negative feedback.
You would still have a lapse rate without any GHGs because there would still be conversion of KE to PE with height in uplift and conversion of PE to KE in descent.
The flaw in Robert Brown’s ‘experiment’ is the presence of vertical sides for his container. That effectively prevents the exponential increase in volume with height that occurs as one moves up and away from a sphere.
It is that exponential increase in volume that permits the linear fall in temperature along the lapse rate slope in accordance with the gas laws.
He is correct on his own two dimensional terms but those terms do not reflect real three dimensional geometry.
I have told him but he won’t accept it.
You don’t need either GHGs or convection to produce a temperature gradient. A gravitational field is enough. Dr. Brown’s counterexample makes several bad assumptions, and should not be used. Not least being that he assumes that a solid would not produce a thermal gradient in a gravitational field, and he uses this to “prove” that a gas couldn’t either. But the solid is subject to exactly the same physics as the gas. There’s no escape that way.
In the absence of convection there would be no conversion of KE to PE in ascent or PE to KE in descent so the atmosphere would become isothermal via conduction from surface to top of atmosphere.
GHGs would make no difference because they would radiate to space at the same temperature from every height.
Solids behave very differently to gases hence the gas laws. Mr Brown seems oblivious.
Good point. And why the difference between the average global temperature from NOAA (13.9C) and the 15C here. How did NOAA get an average earth temperature from 100 years ago?( see https://www.climate.gov/news-features/understanding-climate/climate-change-global-temperature) …”Based on NOAA data, the 2017 average global temperature across land and ocean surface areas was 0.84°C (1.51°F) above the twentieth-century average of 13.9°C (57.0°F), making it the third-warmest year on record behind 2016 (warmest) and 2015 (second warmest). It was the warmest non-El-Niño year in the record”.
You simply use the physics laws 1) Avagadro’s Law – a mole 6.022140857E+23/44= 1.37E+22 (CO2 has molar mass of 44g)
0.04/6.022140857E+23= 2.40886E+20/6.022140857E+23 =2500.
2500/52 = 48.07 m3 ; 0.044kg/48.07=0.0091g/m3
Use this expression (101325 * 1.225)/(51.83*8.314)=288.
(51.83*8.314-430.91)
CO2 51.83 x 2.40886E+20
CO2 12.485121380E+21 x 1.38E-23=0.17 Joules(pressure only),
Air 51.83 x 6.022140857= 31.21756061831E+24 x 1.38E-23 = 430.73 Joules
(Are you following this)
Air (solar energy 4.36E+19 Joules per hour) / 3600 / 5.1E+8 m2 = 237473 J(m2 * s) / 1005 J(m2 * s) = 236.3 * 1.217kg = 288 J (m2 * s).
CO2 0.28 x 0.0091kg = 0.00026 J(m2 *s) (solar heat) 0.17+0.00026 (Observed Earth Temperature without a joule of greenhouse gas)
For additional credibility, use the proper number of significant digits on each of the values above expressed in scientific and standard notation: 2.409 6.022 12.48 etc
Your calc even then was “=0.17 ” and “=430.73”
So even after the excess digits, you still trimmed it to just 2 decimal places at the end. One could argue further than “0.28 x 0.0091 = 0.00026 is only 1 decimal place, but then I would be distracting. 8<)
Oops 0.28 x 0.0091 = 0.0026.
CO2 (solar energy 4.36E+19 Joules per hour) / 3600 / 5.1E+8 m2 = 237473 J(m2 * s) / 844 J(m2 * s) = 0.28 * 0.0092kg =0.0026 J (m2 * s).
I have a problem with this. The insolation over the planet is essentially the same since the Eocene and then we had palm trees in the Arctic, so that is clearly not the fundamental reason. The winter pole gets all its energy transported from the mid-latitudes, when the planet is in an ice age all that energy is lost to space through outward radiation. When the planet is in a hothouse condition, like the Eocene, part of that energy is used to keep the poles warm and iceless during the dark winter.
Apart from the likelihood that the Eocene involved a greater atmospheric mass from volcanic outgassing and the creation of oxygen it is also likely that the atmospheric convective cells were differently arranged but it would still be the case that the surface temperature could be predicted from the specific parameters that Philip has described.
One could envisage many different global climate configurations arising from a simple redistribution of energy between the various atmospheric convective cells whilst the average surface temperature remains the same. Thus the pattern you describe does not invalidate the current proposition.
Anyway, the Eocene contained several widely differing climate conditions.
Perhaps “fundemental reason for a lower temperature at the poles” is better. The actual temperature at the poles is determined by other factors, but the tropics will always be hotter than the poles.
My knowledge of computer modeling tells me that with a temperature profile like the one described above and just 20 to 30 different other parameters affecting the climate that even with all of the existing “Super Computers” networked together it would take over 100 years to analyze what the earth’s temperature will be in 100 years. And it would be wrong.
The point seems to be that whatever other parameters there might be the average surface temperature can be predicted from the four parameters specified by the author.
The other 20 to 30 parameters would only affect the distribution of energy around the sphere.
So, if you increase GHGs a bit you might get a an indiscernible change in the distribution of the climate zones but the average temperature would stay the same.
Among those problems is that the data shown above will shift hour-by-hour, day-by-day, month-by-month and Averages are not going to cut it in an accurate model. Not only does that require extensive computer modeling it would be virtually impossible to predict and model the 365,000 daily profiles indicated above.
The flow of water in a pipe or river is not equal from one edge to the other edge. An average flow can not be used to predict problems caused by water flow in a pipe or river in with a computer model. The flow of the atmospheric currents both horizontally and vertically are affected by the temperature gradient horizontally and vertically and averages are not going to predict what happens after 100 years of “Averages”. To claim it will is proof of lack of intelligence of effort to push a falsehood.
The point is that the four listed parameters determine the surface temperature for any planet with an atmosphere above a hard surface. For that limited purpose averages are fine. The calculation is independent of the quantity of radiative gases in the atmosphere.
If you want a detailed predictive analysis of variation around the average 100 years ahead then feel free to submit your own proposals.
“This image is compiled from measurements made on March 18 2011, near the time of the Vernal Equinox.”
Be very interesting to get an updated image and see what that average temperature is. Given the known CO2 emissions in the period, that should give an interesting take on the sensitivity of temperature (not necessarily climate) to CO2 emissions.
If CO2 increase from 300 to 400ppm causes X amount of warming (and the feedbacks), then there must be the same GHG effect (and feedbacks) for the 100ppm to 200ppm and then 200ppm to 300ppm jumps. So where do they include this in the calculations ? If CO2 has this effect going from 300 to 400, then same (but stronger) effect MUST exist in the 200-300 jump and the 100 to 200 jump – but no one seems include this ? So either CO2 GHG physics (feedbacks etc) only applies once CO2 passes 300pm – OR – it was never there in the first place.
And radiative balance is not at a height of 0 meters…
So, if you plot this out over the history of the CERES data, how close do you get to the UAH satellite record?
I wonder what resolution you could calculate surface temperatures using the CERES data.
Would be interesting to see how well it agrees (or disagrees) with various surface station records.
House of cards, I’m afraid.
“Using the Stefan-Boltzmann law of radiative emission these energy flux values can be converted to emission temperatures using the following equation”.
….which of course requires that the emission conforms to a Planck curve, which it does not, as the several sources aren’t black bodies. Emission from the surface is close to “black body”, but because only a band of that, through the “atmospheric window” is emitted to space, that can’t be considered a black body either.
Greenhouse gases don’t behave anything at all like “black bodies” – emission is discrete, in bands, not a continuous spectrum. Emission to space is a composite of the sources, and so by definition can’t be considered to be a single black body.
Deviation from the required Planck curve will depend on the exact origin(s) of the flux(es). Very different over ocean, vegetated land, desert, polar ice. What’s being calculated is the “effective” temperature and consequently “effective” height of emission, neither of which has any physical meaning whatsoever.
Tony,
The author is dealing with averages and the fact is that, on average, emission to space equals energy absorbed from space so the author’s approach is entirely valid. The inevitable deviations from the Planck curve are simply adjusted for by the size and shape of the atmospheric convective cells and the interactions between them.
Otherwise the calculation provided could not come out so neatly at the actual observed Earth temperature.
There are many problems with this analysis.
Two of them are:
1. The environmental lapse rate is based on an assumed international standard atmosphere. The standard atmosphere assumes no moisture (invisible water vapor and visible water-droplet clouds). That simplifying assumption allows the same -6.5K/Km to be used from the equator to the pole. Nature doesn’t work that way.
The absolute humidity (total precipitable water) varies greatly with latitude just as the temperature does.
The drier air of the polar regions (less TPW) means the adiabatic lapse rate is closer to 9.8K/Km. While the moist air of the tropics, the adiabatic lapse rate is closer to 5K/Km. So the simplifying assumption of -6.5K/Km produces a circular logic trap when it is used across all 3 zones to make the calculations.
2. Inversions are also common in the polar regions in winter, especially over land surfaces that get very cold during winter clear night time hours, producing a very cold boundary layer with suppressed convective exchange. This commonly seen as poor air quality in winter as it traps surface pollutants and particulates from motor vehicle exhausts and fires. And also in the tropics and sub-tropics in summer time when warm fronts override cooler surface air are more common.
(as an aside: Summer time inversions of warmer maritime air overriding cooler surface layer produces the common VHF radio ducting phenomenon that messes with people’s FM radio station receptions. This RF refraction phenomenon provides a method to study the extent and depth of inversions).
These inversion can cover wide areas and sit for days even into weeks until weather conditions change and move them out. Simply ignoring them brings in errors that compound to an assumed, simplified radiatve energy budgets.
Joel,
The author is dealing with global averages. Wherever the lapse rate deviates from the dry adiabatic lapse rate of 6.5 K/Km there is an equal and opposite deviation in another location which nets it out to zero.
That is the nature of convection as a zero sum process. What goes up must come down, always, and the adiabatic process is fully reversible.
That is why the Standard Atmosphere works for all practical purposes including those requiring a high degree of precision including aeronautics and rocketry.
The truth is that knowledge of the thermal effects of GHGs is not required to establish the surface temperature of a planet with an atmosphere.
Does such linear averaged, single lapse rate really capture what happens across a spherical surface with non-linear atmospheric dynamics of water vapor and phase change distribution?
My point is,… it probably doesn’t.
It produces the observed number therefore it must.
However, it does not capture the detail, just the overall average.
I would expect it to work for all planets with a hard surface beneath atmospheres.
Maybe the author could be persuaded to produce numbers for, say, Mars, Venus and Titan ?
“It produces the observed number therefore it must.”
But one can simply pick a lapse rate that results in the desired 15 °C global average surface temperature. Is the 15 °C average surface temperature really based on observations? I’ve never seen them.
If 15 °C is accepted as fact, then the calculation yields the average lapse rate, but I’m far from convinced that the calculations really reflect reality. It would take laboratory measurements of the electromagnetic emission from greenhouse gases at these every low temperatures to convince me.
15C is the temperature required to match energy out to space with energy in from space at the same time as providing enough energy to maintain convective overturning within the three cells described by the author so as to keep the system stable. Therefore it is a real, measured quantity.
How about looking at Earth from a geological scale?
For example, before the Tibetan plateau existed?
Interesting analysis. We have a direct record of the lapse rate from balloon data. Is the lapse rate fairly constant or is it a smooth curve from lower to higher or vice-versa as a function of altitude?
It changes constantly from place to place, often over short distances both horizontally and vertically, but overall averages 6.5 K/Km
Any deviations from that figure result in convective changes that neutralise any thermal effect. Otherwise the author’s calculation would not come out at the correct surface temperature as observed.
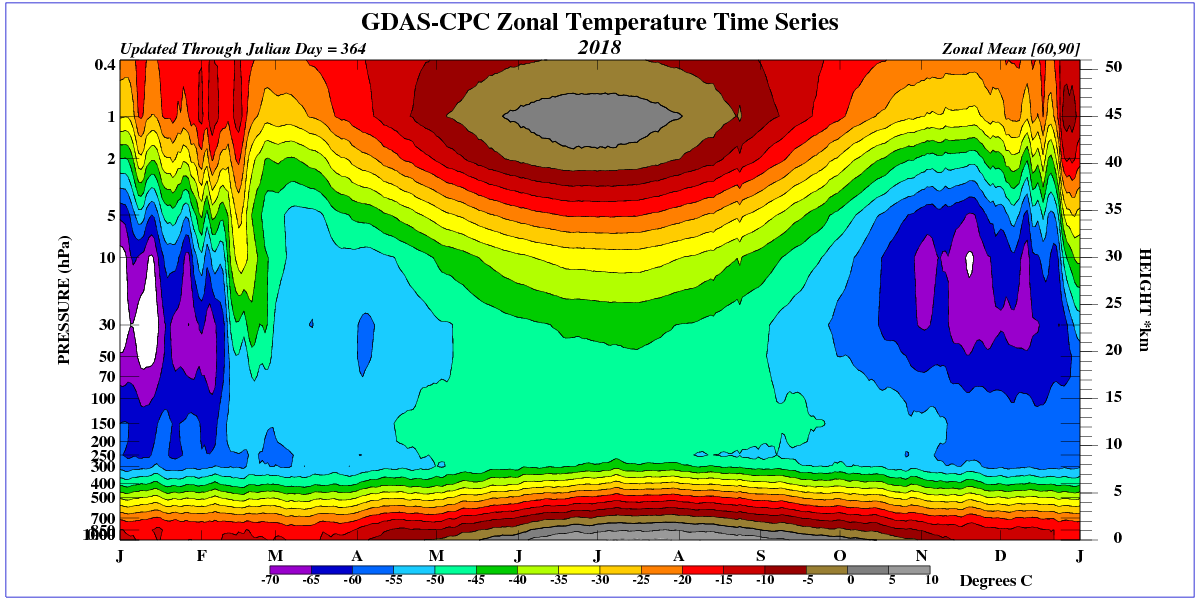
The reduced height of the tropopause over California on 05/19/2019.
http://oi67.tinypic.com/2yki1ab.jpg
I was wondering why 2011: From NASA site (today 2019)
Aqua Status
Operating instruments: AIRS, AMSU, CERES, MODIS, and AMSR-E, the latter at a reduced rotation rate appropriate for cross-calibration purposes rather than for science.
Guess I’ll have to wait on an answer.
Phillip ==> 288 K more precisely is: 288K − 273.15 = 14.85°C.
Amazing how closely this agrees with the reported temperatures of Earth — see mine Almost Earth-like, We’re Certain.
If we keep at it, we may actual;ly finally qualify as an Earth-like Planet — at least for average surface temperature.
“The tropopause is the boundary in the Earth’s atmosphere between the troposphere and the stratosphere.
Going upward from the surface, it is the point where air ceases to cool with height, and becomes almost completely dry. More formally, the tropopause is the region of the atmosphere where the environmental lapse rate changes from positive, as it behaves in the troposphere, to the stratospheric negative one. Following is the exact definition used by the World Meteorological Organization:
The boundary between the troposphere and the stratosphere, where an abrupt change in lapse rate usually occurs. It is defined as the lowest level at which the lapse rate decreases to 2 °C/km or less, provided that the average lapse rate between this level and all higher levels within 2 km does not exceed 2 °C/km.”
I suppose old school factors determining ice cap elevation include: decreasing precipitation with increasing elevation (as the ice cap grows); increasing ice flow with added weight; greater ground sinking with added weight. “[T]he apparent coincidence between the maximum surface elevation of the Antarctic Icecap at Dome A (4093m) and the maximum elevation of supercooled water” is intriguing alright. Is there an agreeable mechanism for this? –AGF
“The apparent coincidence… Is there an agreeable mechanism for this?”
Arthur.
My thought is this – Once the ice surface rises above the point where it is no longer possible to have supercooled liquid water droplets in the atmosphere, then there is no further possibility for latent heat of crystallisation to be released. Therefore there is nothing left in the system to power moist convection and so vertical ice accumulation stops.
Happy to hear of other ideas.
Slick as a float valve. Interesting.
Wouldn’t the availability of such interesting scientific data mean that future IPCC reports now can and must include more consideration taken to cloud cover as a factor in our changing climate?
poor north korea. jilted again.
I am not sure what the colorful NASA picture of the globe shows. Is it a day time temperature, a night time temperature, or some sort of an average?
“The average temperature of the Earth determined by this calculation method is 288 Kelvin, which is the currently accepted value of 15 °C used by climate science.”
The average absolute temperature measured by UAH6.0 LT for the period 1981-2010 is, according to
https://www.nsstc.uah.edu/data/msu/v6.0/tlt/tltmonacg_6.0
264 K
Two years ago I made a comparison between UAH6.0 and the RATPAC B radiosonde data set (used by J. Christy as well).
The result has shown that the average atmospheric pressure giving the best difference fit was between 700 and 600 hPa, giving in turn an altitude somewhere between 3.0 km and 4.2 km.
3.7 km would give us, with the usual lapse rate of 6.5 K / km in the lower troposphere, a temperature difference of
24 K
Thus it seems that Mulholland’s computations are correct.
Who disagrees should give us more than guessing on the road…
“Because mountain ranges can reach vertical elevations that lie within the radiant transmission zone to space for each atmospheric cell, it appears that these topographic features can form leak zones that emit radiant energy to space independently of the transmission properties of the overlying atmosphere.”
I wonder if the climate models have taken these leak zones into account.
I’ve never formally studied atmospheric physics so please take my comments with a big grain of salt.
While the methodology employed arrived at the accepted ave earth surface temp, which of course indicates correctness, I have some contrary observations:
1. The various cell and tropopause data MUST be averages, and there appears to be an implicit (but unqualified) assumption of linearity.
2. High altitude land/ice masses are clearly a “leak” as noted. How did this analysis incorporate this leak? IF the leak was not implicitly accounted for, it would seem to over estimate the average temp. But how much?
3. The analysis was based on a single snapshot near the vernal equinox. Is the image based on a 24 hr average? Since cloud cover varies, how representative is this particular day (or period) of a annual average?
Yes, you can reduce the source of outgoing LWIR to a single “average” temperature of an equivalent black body and, yes you can use published average surface temperatures and lapse rates to put that equivalent surface at a specific elevation. But, that equivalent black-body surface doesn’t exist as such. Al you can say is that, if it existed, it would produce the same LWIR radiation as measured. Surely, the outgoing LWIR is a dynamically varying integral of grey-body radiation from the surface and the whole atmosphere, minus any absorbed radiation by greenhouse gases, plus any upward re-radiation from the same greenhouse gases.
So you can use those equivalent surfaces to work out an average surface temperature (but I seriously doubt if it’s possible to do it to 2 decimal places like the climate science people do from weather station data), but you cannot possibly state that the only surface-emitted LWIR is from mountains that are higher than the elevation of your equivalent surfaces. It doesn’t make much sense if you think about it.
And it’s only a “sort of” average temperature because emitted radiation is proportional to the fourth power of absolute temperature. What it is, is ((∑(T^4*a))/(∑a))^0.25 where T is surface temperature of unit area a. Which will be quite different from the real weighted average surface temperature Tavg = (∑(T*a))/(∑a). (I used the capital sigma because I couldn’t figure out how to do an integral sign) You would need to know the way temperature varied across the surface to deconvolute from the “average of T^4” to a true Tavg. And if you were able to factor in elevations of the land surface, you would need some powerful hardware to crunch the numbers.
Interesting post, and thought provoking, but I’m not sure what we can learn from it in terms of global climate and its variation.
We can learn from it that the average global surface temperature is a consequence only of atmospheric mass being convected up in one location and down in another in a never ending cycle which delays radiation to space thereby heating the system. No other explanation fits the facts.
Nothing to do with GHGs at all.
We can allow an element of variation for GHGs but only in terms of energy distribution and not absolute temperature.
The average height of the tropopause above the 60th parallel ranges from 6 km in January to around 9 km in July.
Thank you all for the interesting comments and challenges.
I am looking here at climate from a geological perspective. My motivation for this study was to try and determine if high elevation solid surfaces, such as the Tibetan Plateau, are “thermally visible” from space, and if the contrast in land surface elevation between the Cretaceous and the Tertiary can provide a physical explanation for the long-term planetary cooling over the last 65 million years.
I am basing my analysis on the following points: –
1. Planets shed energy to space via thermal radiation.
2. Flexure is the fundamental process that interlinks vibrating matter with thermal radiation.
3. Solid surfaces (either rock or ice) held at high elevations are efficient radiators precisely because they are composed of flexible materials.
4. Icecaps can melt, therefore the ice age high elevation solid ice surfaces of Canada and Scandinavia can rapidly disappear with major implications for surface radiation loss, whereas the Tibetan plateau remains as a long-term high elevation radiant leak point.
The simple algorithm I am using to determine the average temperature of the Earth is an interesting spin-off from this primary study.
The numbers from this study learn that the here given [average] local level of direct emission into space (respectively on average 3,160, 1500 or 310 meter for the three zones) plays an important role in cooling the Earth.
At the poles (at present average temperatures) elevations above 310 meter cool the Earth by [partly] unhindered radiation. Which has been of importance for the development of the ice shelves at the poles. ‘Land’ at or near the poles already was recognized as an important factor for the development of ice shelves and a higher elevation can be added as a factor in the cooling not only of the region but also of the Earth as a whole.
It makes a big difference where on Earth elevations are found: the same elevation at the poles (on average) has more cooling effect than in the tropics.
In fact the described simple relationship between topography and radiation is an extension of the theory about the influence of moving continents on the average temperatures of the Earth. Moving continents cause topographic changes that indirectly (by creating oceans that produce whether warm or cold deep water) or directly create cooling of the Earth, for example by producing direct outward radiation causing elevations or by causing dry air behind developing mountain ranges that diminish the content of water vapor on the leeward side, also causing extra outward radiation.
No water vapor in the air means radiative cooling. As elevation creates cooling and as cooling results in low water vapor, ‘elevation’ causes extra outward radiation. As the numbers show, at the poles from 310 meter (on average) till from an average 3.160 meter in the tropics.
Extra outward radiation cools the Earth. The movements of continents (both horizontally and vertically) have big temperature effects.
It seems more likely to me that polar ice growth produces negative temperature feedback through reduced radiation on several counts:
1. Obviously the initial accumulation of permanent ice increases albedo, decreasing absorption of summertime incoming radiation and reducing outward IR radiation year around.
2. The lower the ice, the higher the surface air temperature, and the greater the radiation to space, as well as the more effective heat transport to the upper atmosphere through the convection of denser air from the surface.
3. Cold air is drier, and water vapor is a greenhouse gas. The less vapor the less IR radiation outward.
The statement, “the same elevation at the poles (on average) has more cooling effect than in the tropics,” is beyond me, seeing as cooling effectiveness is temperature dependent.
–AGF
2.
AGF: “The lower the ice, the higher the surface air temperature,”
WR: Correct. But the higher the surface air temperature, the more water vapor molecules there are in the air that will absorb surface radiation. The more absorption, the less direct (!) radiation into space. After absorption the other gas molecules in the air (N2, O2) receive kinetic energy from the absorbing molecules: the air warms.
AGF: “and the greater the radiation to space,”
WR: Indeed, there is more surface radiation at higher temperatures but because water vapor H2O (on the average) is 29 times more abundant than CO2 the air is easily opaque for surface radiation. https://journals.sagepub.com/doi/10.1177/0958305X17722790 For the poles a number of one molecule of water vapor for every molecule of CO2 is given. The warmer it is, the more surface radiation is absorbed. Over most of the surface only surface radiation in non-absorbable wavelengths is able to reach space directly through the so-called Atmospheric Window.
AGF: “as well as the more effective heat transport to the upper atmosphere through the convection of denser air from the surface.”
WR: the temperatures at the poles are that low that the air becomes very dense. Water vapor molecules have a low molar mass making air less dense but at the poles we find relatively few of them because of the low temperatures. Because of both reasons polar air is very dense, High Pressure areas are dominant and the dense air in the HP areas is descending. Convection is rare at the poles, especially at Antarctica.
3.
AGF: “Cold air is drier, and water vapor is a greenhouse gas. The less vapor the less IR radiation outward.”
WR: Near the surface water vapor is nearly everywhere blocking outgoing surface radiation. But at high elevations (stratosphere) the remaining H2O plus CO2 molecules can effectively radiate outward. The reason is the lack of a huge quantity of absorbing H2O molecules.
AGF: “The statement, “the same elevation at the poles (on average) has more cooling effect than in the tropics,” is beyond me, seeing as cooling effectiveness is temperature dependent.”
WR: At higher temperatures surface radiation is a bit higher, but the quantity of absorbing (= surface radiation blocking) water vapor molecules is much higher. For that reason the efficiency of surface (!) radiation over most of the surface is very very low: nearly all is blocked / absorbed.
At the poles above 500m a plateau is efficiently radiating straight into space. Which means that there is but a few water vapor in the air and a lot of surface radiation can pass ‘the water vapor barrier’ and disappear into space. The number of the study above is 310 meter for the poles: above this line not all absorbable surface radiation will be absorbed / blocked.
In the tropics at and above 500m there are still lots of water vapor molecules, absorbing all radiation that is absorbable. More surface radiation is emitted but surface radiation that can be absorbed by H2O and CO2 will be absorbed. Efficiency of absorbable surface (!) radiation in the tropics (on the average) is zero.
For this reason a plateau at 500m at the poles results in a greater radiative cooling than the same plateau at an elevation of 500 meter in the tropics. The poles are net emitters, the tropics are net absorbers.
See the high quantities of water vapor everywhere: https://earth.nullschool.net/#current/wind/surface/level/overlay=total_precipitable_water/orthographic=-143.25,73.81,415/loc=-157.421,77.546 Move the map and click on the map to see the local quantity of water vapor in an air column above 1 m2 of surface area.
OK, I stand corrected…and schooled. Thanks, –AGF
AGF, my reply to your comments are erroneously put above your comments. Sorry
Sorry, this reply was meant for Arthur G. Forster below
We live in a very narrow temperatue band. A few kilometres higher ( mountain) or lower (ocean) and we freeze.
Simple as that. No greenhouse to be seen.
I like the way Kristian deals with the CERES data in relation to global warming theory. As he states:
Three Tests for GHG Warming in the Sky
The null hypothesis in this case would claim or predict that, if there is NO strengthening “greenhouse mechanism” at work in the Earth system, we would observe:
1. The general evolution (beyond short-term, non-thermal noise (like ENSO-related humidity and cloud anomalies or volcanic aerosol anomalies))* of the All-Sky OLR flux at the ToA to track that of Ttropo (e.g. TLT) over time;
2. The general evolution of the All-Sky DWLWIR at the surface to track that of Ttropo (Ts + Ttropo, really) over time;
3. The general evolution of the All-Sky OLR at the ToA and the All-Sky DWLWIR at the surface to track each other over time, barring short-term, non-thermal noise.
The post at okulaer is https://okulaer.wordpress.com/2018/11/11/how-the-ceres-ebaf-ed4-data-disconfirms-agw-in-3-different-ways/
My synopsis is https://rclutz.wordpress.com/2018/12/12/no-ghg-warming-fingerprints-in-the-sky/
My interpretation is that, whatever internal system changes occur, the average surface temperature stays the same for the same insolation and atmospheric mass but the energy distribution across the surface changes.
If it were not so then the existence of atmospheric convective cells would not continue indefinitely.
The convective cells must change in size, shape or vigour in order to neutralise internal system imbalances otherwise the atmosphere would either be lost to space or fall to the ground.
That scenario is implicit in the author’s four relevant parameters.
The only question then is to what extent do the air circulation patterns change in response to GHGs.
Given the size of natural variability it must be indiscernible.
Stefan-Boltzmann is invalid in this context, as would be Kirchhoff’s Law. Neither Earth nor its atmosphere, nor any part of the atmosphere is a black-body. To be valid, these “laws” require a genuine black-body, as in soot black.
THX1138
I’m asking how long this ridiculous black-body manipulation will persist among the ‘skeptic’s.
The one and only difference between a black-body and the rest (the so called gray-bodies) is that while a black body absorbs all incoming radiation, the others reemit a part of it.
The rest is pure, unscientific invention.
Actually, the unscientific invention is the notion that a planet whose principal means of heat transfer to its gravitationally-bound atmosphere is via evaporation constitutes a thermodynamic”gray” body.
1sky1
Sorry: writing a highly educated prose does not exempt a proof.
I guess the more important take away from this picture is, whether you think it supports the IPCC position according to which clouds reduce emissions by 31W/m2 (or even less), or whether it is (much) more. Nothing less than the GH theory is at stake.
Leitwolf
I don’t think that there has ever been any doubt that clouds block surface emission to space. We know that on clear winter nights a ground frost occurs as radiation passes out to space through the atmospheric window. Whereas on cloudy nights the temperature does not fall as low because the clouds block surface radiative cooling.
The real question is what is going on where there are no clouds? Have a look at India, its shape can easily be identified coloured in bright yellow on the 18Mar2011 CERES image. This is pre-monsoon season and India appears to be like the Atacama Desert in Chile. The humidity in the Atacama Desert, is between 5 to 10% all year round. Here is a link to the nullschool Total Precipitable Water (TPW) data for 18 Mar 2014 (the 2011 data is not available).
https://earth.nullschool.net/#2014/03/18/0000Z/wind/surface/level/overlay=total_precipitable_water/winkel3=174.48,-0.32,332/loc=-68.246,-24.300
Move the green cursor ring from Chile (3.217 kg/m3) to pre-monsoon India (click on the map) and notice that the TWP values there are up to 9 times those of the Atacama.
https://earth.nullschool.net/#2014/03/18/0000Z/wind/surface/level/overlay=total_precipitable_water/winkel3=174.48,-0.32,332/loc=75.156,17.506
Nice article.
What is the relation between Earth rotation speed, aka angular momentum of air mass on equator, aka Coriolis force and size of Hadley cell?
Earth rotation is significantly slowing down in scope of hundreds million years.
My feeling is that higher the Earth rotation speed, the stronger and stable jet streams and Hadley/Ferrel cells.
Thus greater difference in temperature between tropic, moderate and polar zones.
Thanks Peter.
Planetary rotation rate is a big issue. The speed of daily rotation is one of the fundamental controls on planetary climate. We can divide the terrestrial bodies that have a gaseous atmosphere into two groups, slow rotators, such as the planet Venus and the Saturn moon Titan, and rapid rotators such as Earth and Mars. Slowly rotating Venus does not have an equatorial bulge, this is in contrast with rapidly rotating planets, such as Earth and Mars, that do.
On Earth the rapid daily rotation limits the latitudinal reach of the Hadley cell, it creates forced descent of upper atmospheric air in the mid-latitudes and directly accounts for the existence of the Ferrel cell. The Ferrel cell is a mechanical cell that acts as a cog between the tropical thermal Hadley cell of solar heating and energy surplus, and the thermal Polar cell of surface radiant cooling and energy deficit.
The impact of the forced descent of Hadley cell air in the mid-latitudes can clearly be seen in the CERES image. This descent creates a zone of high surface pressure and reduced moist convection that allows for significant planetary thermal loss to space over continental land areas, such as the Sahara Desert of North Africa. Over the adjacent mid-Atlantic and Indian Oceans, the same latitudinal zone of forced air descent allows for clear skies and deep penetration of solar insolation that leads to energy capture and retention by the marine waters below.
Slowly rotating Venus does not have a Ferrel Cell. On Venus the Hadley cell extends from the equator to the pole, and only at the Venusian poles can deep atmospheric release of thermal energy to space occur. As a direct consequence of mid-latitude forced air descent on Earth there is a significantly larger planetary area that can produce solid surface thermal loss to space, thereby acting as one of the controls of planetary temperature.
Have a look at these two papers that deal with the issue of planetary rotation rate: –
Hunt, B.G. 1979: The Influence of the Earth’s Rotation Rate on the General Circulation of the Atmosphere. Journal of the Atmospheric Sciences, Vol. 36 (8), 1392-1408.
Del Genio, A.D. & R. J. Suozzo 1987: A Comparative Study of Rapidly and Slowly Rotating Dynamical Regimes in a Terrestrial General Circulation Model. Journal of the Atmospheric Sciences, Vol. 44 (6), 973-986.
Excellent document.
From this is clear that Hadley cell is increasing while rotation speed decreases, eventually Hadley cell will reach poles.
It is far future, whole world having average average temperature of 15C.
Closer future is about disappearing polar cell, merging with Ferrel cell and increasing size of Hadley cell. That means tropics will be bigger, very slightly colder. But moderate area on Earth will suffer from merge with polar, temperature falling rapidly.
My guess here is: moderate area shrinking from 41.75% to 31.75%, merging with 8.25% polar area.
Temperature in moderate area will be around 1K colder 278.5K, because of losing 10% of warmest part.
This is giving weighted average temperature: (31.75%x278.5K+8.25%x253K)/40%=10929.6/40=273,24K
Whole moderate area from 40 degrees north/south to pole will have average temperature around 0C!!!
Question is how far this state is. It is even possible that it already started, polar cell merging with Ferrel. My guess is that first symptoms are meandering of jet stream dividing polar area from moderate. And this is already happening.
Peter,
Interesting new application of the Wighted Area technique, with a troubling result.
Welcome to my world. 😉
I am not a scientist but we don’t live in a moisture free world with the same -6.5 degree lapse rate and top of troposphere temperatures of -78.5 to -83 degrees celsius. I got lost right there when you somehow decided the whole world had a constant moisture free lapse rate all the way to the top of the troposphere. The top of the troposphere is supposed to be about -56.5 C per the source link you provided for your lapse rate. The reason there does not appear to be a green house gas effect is because you used a moisture free lapse rate for the whole world and bogus temperatures for the top of the tropopause based on that. I have often questioned why CO2 is not included in the lapse rate if it really has a significant impact on temperature but I thought everyone understood why humidity was included in the lapse rate.
James,
As I mentioned in my essay, finding accurate temperature data for the tropopause is not easy. This is not least because the tropopause is a dynamic zone and subject to daily and seasonal variations, as well as latitudinal differences both within and between the main atmospheric circulation cells.
That said I am a great admirer of the philosophy of science practised by Richard P. Feynman in particular this quote:-
“Study hard what interests you the most in the most undisciplined, irreverent and original manner possible.”
There are two basic issues with ideas in Science ; –
1. The idea is wrong, but the data are correct.
2. The idea is correct, but the data are wrongly applied.
Clearly, we aim to achieve the optimum position of: –
The idea is correct and the data are correct.
My motivation for this study was to try and establish if, from a long-term geological perspective, land surface elevation is a factor in reducing global average temperatures over the last 65 million years. The mechanism I am exploring is if the presence of high elevation land surfaces, such as the Tibetan plateau, provide a persistent energy leak point that allows radiant energy to pass more easily through the atmosphere and out to space.
Calibrating the CERES image is one way to achieve this. My numbers may be wrong in absolute terms, but I believe that the concept is valid, and while capable of refinement with more accurate data, it has not been disproved by my analysis.
Looking now in detail at the specifics of your criticism regarding the role of humidity in the lapse rate. Firstly, the great bulk of the Earth’s atmosphere is composed of the three non-condensing gases Nitrogen, Oxygen and Argon. So, to a first approximation the atmosphere is dry.
Next the atmosphere is a vertical drying machine. Moist air at the base when lifted dries out through the process of rainfall that leaves air lifted aloft drier than that of the surface.
The process of latent heat release by the water in the rising air as it first condenses from vapour to liquid, and then crystallises to solid ice ensures that upper atmosphere air possesses a large Potential Temperature.
Cold low-pressure stratospheric air needs to be cooled when it is brought inside the pressurised cabin of a jet airliner because of it large potential temperature, something that is well understood by aircraft engineers. Similarly forced descent of dry upper air in the vertical overturn of the tropospheric Hadley cell returns air to the surface in high pressure anticyclones. Air that undergoes heating at the dry adiabatic lapse rate as it descends.
1. It seems that ‘potential temperature’ is just another way of looking at lapse rate.
2. In the article you state:
Most of the energy ‘release’ at height in the convective cells such as Hadley Cells, is the release of latent heat on change of state of water – say from liquid to ice.
Latent heat does not follow Stefan Boltzmann – it is a set number of 334 Kj/Kg liquid to ice and 2264.7 Kj/Kg vapor to liquid. In some of the extreme convective updrafts in the Hadley cells water can still be vapor and liquid at 30,000ft, so the phase changes can happen at that height.
Is the use of Stefan/Boltzman to back calculate atmospheric temperature correct?
“In some of the extreme convective updrafts in the Hadley cells water can still be vapor and liquid at 30,000ft, so the phase changes can happen at that height.”
Ian,
You have spotted what I consider to be one of the flaws in the Energy Budget diagram, namely Latent Heat transport is a mass motion process and not a radiation process. It is impossible to vector latent heat without also convecting water. Then there is the issue of descending mass in a gravity field. All mass that has been lifted aloft, be it air or water, must convert potential energy back into kinetic energy as it descends. Witness the effect on solar panels of descending hail stones. The issue is one of quantity of energy being transported. As a hill walker I am very familiar with the effect on clouds as moist air descends over a Scottish ridge. The evaporation of the cloud moisture as it descends is another example of latent heat transport, but this time in a descending air parcel.
“Is the use of Stefan/Boltzmann to back calculate atmospheric temperature correct?
Probably not, but I am just trying to apply the pre-set rules as best I can. YMMV
Emissive power at 15 C is 392 W/m^2 of which 80 W/m^2 is absorbed by the spectral bands of CO2, am I correct in observing this from the above tables derived from the CERES data.