Dr. Roger Pielke Sr. joins me on a podcast to discuss the surface temperature record, the upcoming IPCC report, and climate science moving forward.
Dr. Roger Pielke Sr. explains how the Intergovernmental Panel on Climate Change (IPCC) is incorrectly explaining climate change to the media and public. Pielke highlights how the IPCC ignores numerous drivers of climate aside from CO2, leading to numerous factual inaccuracies in the IPCC reports.

We also cover what is wrong with the surface temperature record – specifically why many temperature readings are higher than the actual temperature.

Pielke is currently a Senior Research Scientist in CIRES and a Senior Research Associate at the University of Colorado-Boulder in the Department of Atmospheric and Oceanic Sciences (ATOC) at the University of Colorado in Boulder (November 2005 -present). He is also an Emeritus Professor of Atmospheric Science at Colorado State University.
Thank you, Anthony and Roger!
Regards,
Bob
Thanks for an interesting conversation- to ignore land use, urbanization, the sun, solar system, oceans,, clouds and so many other obvious drivers of climate demonstrates the IPCC process is aligned with statist control- nothing else.
Even Pielke ignored the obvious driver – the oceans. Every time he mentioned the oceans, he drew this picture of the oceans responding to surface temperature when in fact the evidence shows that the surface temperature responds to the oceans.
He constantly had the proverbial tail wagging the dog.
That’s not how I heard it, Mike H.
Bingo!
I’m only half-way through the talk and Pielke has already said three times that ocean temperature measurement is the best way to measure global temperatures.
The overwhelming majority of the Earth’s surface _is_ ocean, so most solar radiation is absorbed by the oceans rather than land. Coastal areas tend to have more moderate temperature swings due to the influence of the water. When temperatures rise above the ocean surface level, cooling breezes moderate them, and low temperatures are mitigated by warmer winds. So even though the oceans are responding to changes over land, they are in the long term stronger.
If as you claim there may be problems withe US temp record, then how much worse is the rest of the World?
And why did the HAD Crut 4 data change so soon after Jones’s BBC Q&A in 2010.
The two earlier warming periods were adjusted DOWN and the two later warming periods were adjusted UP.
You know, leaving aside the developing world, where’s the proof that in, for example, Europe, weather stations networks are so much worse than in the USA?
The networks are the problem, not the individual stations. Somebody operates them, and if that somebody wants to make a name for himself he becomes an “adjuster,” and proceeds to make his record useless.
Putting stations close to concrete, pavement, as in the photo, IS the problem!! Much higher temps than out in the open fields and forests.
Flavio
Why worry about surface weather stations, when the majority of surface grids have no weather stations at all, or are missing data from one or more stations in a given month?
That means government bureaucrats get to make up some, or all, of the numbers in a majority of surface grids, before they compile a global average temperature.
And they will never discuss that “voodoo” in public !
If not for the UAH weather satellite data, as a checkpoint. and maybe weather balloon data too, I’m confident the surface data would show even more warming than it does now, because the people in charge can not be trusted — the ClimateGate e-mails showed their coming climate change crisis narrative was much more important than scientific integrity.
Also, there were very few Southern Hemisphere surface measurements before 1900, and far too few until after World War II — so there were lots Southern Hemisphere numbers, over many decades, to be wild guessed, by government bureaucrats who can’t be trusted
.
.
On a related subject, a single number global average temperature does not even come close to accurately describing the climate of this planet.
No one lives in an average temperature.
People are most affected by their local temperatures.
Also useful are the locations, time of year, and time of day, when global warming has actually happened.
Did you realize global warming since 1979, based on weather satellite data, with MUCH better global coverage than surface thermometers, revealed warming mainly in the cold, high latitudes, mainly during the coldest six months of the year, and mainly at night ?
That sounds like warming the people affected would LOVE !
And want more of !
No one could even guess those details with ONE number — the global average temperature — a number that works much better as a propaganda tool, for climate change scaremongering, than to inform people about changes to the climate where they actually live and work in.
.
Let’s suppose there was ONE perfectly accurate global average temperature that EVERYONE agreed was accurate ( a fantasy ).
.
What would that “accurate number” tell us about the future climate?
.
Answer: Almost nothing. We’d still have no idea if the planet was going to be warmer, or cooler, in 100 years (only liars “know” that now), and we’d still have no idea what caused the warming, or cooling, (only liars “know” that now).
So, in summary, a global average temperature is a low value statistic that obscures more about climate change than it reveals.
If people are ever going to be hurt by climate change, and I don’t know of anyone hurt so far, then they will be hurt by changes to their local weather conditions — NOT one or two tenths of a degree changes to the global average temperature, over a decade.
In my opinion, the surface global average temperature change since 1880, said to be +1 degree C., is really somewhere in the the range of zero to + 2 degrees C. .
The claimed +/- 0.1 degree C. margin of error is an insult to people around the world, especially those of us who have BS degrees (we know BS when we see it), who are being manipulated with a surface global average temperature climate propaganda number, that has a much higher margin of error than claimed.
My climate science blog:
http://www.elOnionBloggle.Blogspot.com
I find these Heartland Institute pod casts valuable and interesting!
Keep ’em coming!
They could turn the sound level down. Don’t like having my ears blasted and having to grab for the volume button because there is no volume control anywhere on the soundcloud interface.
Yeah, the lack of a volume control got me also, but then I noticed a toolbar appear at the bottom of the page when you scroll down (I’m using FF). Confusing UI which violates the Law of Least Surprise.
What’s wrong with the surface temperature record???
Pretty much everything.
It’s about time someone stands up for the truth and uses actual facts to back it up. I’m just so tired of the Climate Change people not using facts or distorting facts and spewing out the narrative that sea levels are going to wipe out humanity and temperatures are going to be so high that animal species will go extinct and it will cause economic and social chaos. They will not listen to facts but only tell you how bad it’s going to be in the future. The problem is most of the so called scientists barking out this narrative can’t even predict what climate we will have next week let alone 10, 20, 30…. years in the future.
‘They will not listen to facts but only tell you how bad it’s going to be in the future.”
I’ve started calling them weather worriers or climate hypochondriacs to their face if they’re really bad and calling me a denier. That rocks them back on their heels and quietens them down as it seems to hit a raw nerve.
The other show stopper is to ask whether they really know the science. Shocked indignant look on their face and you follow up with- For instance what is the average annual global sea level rise in this current interglacial? You know according to NOOA (1.7mm) and the CSIRO (1.6mm) estimates? Don’t know? Care to hazard a guess? When you get the blank embarrassed look you rattle it off and then qualify it saying of course that’s an average that has to take into account isostatic rebound in some places and you don’t want to rely too much on a tide gauge in Venice or a coral atoll naturally (they get the Venice one).
If they aren’t looking for a place to hide by then and come back for more you chime in with- How do these clever climastrologists and their computer models measure temperature hundreds of years ago to come up with this new kid on the block doomsday theory of theirs by the way? They haven’t a clue and you’ll be surprised at the number who think we’ve had thermometers since Jesus was a lad. You can let them off the hook with- That’s OK 97% of believers in CAGW don’t know the science either.
Can we look forward to Surface Stations Gallery going back on-line soon?
Good info – I hope a lot of folks listen and understand some of the intricacies of temperature measurement ‘in situ’. Very important to get this type of data out where peolpe can make themselves aware.
Thank you.
I was most interested to see Pielke comment on the current ability of the models to predict such significant events as El Niño/La Niña, the NAO, and the PDO…
…and not at all surprised to hear him say that the models are still struggling to do so, even on a statistical basis.
While the major legacy-media outlets are familiar with how influential some of these events are on weather and climate indices, they also appear oblivious to the fact that the climate modelers are still living in the dark ages as far as prediction is concerned.
“The left’s climate change concern devolves into hysteria”
https://video.foxnews.com/v/6036263199001/#sp=show-clips
Full video
https://www.facebook.com/consequence/videos/2685086428175111/?t=2
Yes, 99.9% of the heat energy budget of the earth is in the ocean, but how does LWR from CO2 increase that ocean heat content?
One of the largest ways that ocean heat is transferred to the atmosphere is via latent heat of evaporation. This has little effect at the surface – where the temperature is maintained pretty constant – but it does change RH and that in turn changes the temperature after that rain is released higher in the atmosphere.
That is part of the system whereby the oceans release heat to the atmosphere and from there to space. If however, you block out IR from being emitted from the cloud layer, then you reduce the amount of rain and increase the RH for air that descends from cloud layer back to the ocean. As such it cannot take up so much evaporation and the cooling effect on the ocean is diminished.
That’s a vast simplification – but I hope it explains how changes in IR can affect the ocean temperature. But what you should also see, is that I’ve assume the cloud cover remains constant – and that is not correct – but that is another issue which is not what you asked.
By slowing down the rate at which energy put into the oceans by SWR, gets out.
I watched an interesting program on the history of Ben Nevis last week, which included the fact that the Victorians set up a weather monitoring station at the top – quite a feat in those days. They dutifully measured various parameters each day BUT, because Ben Nevis had over 200 days per year of gales howling over the top, the wind measuring equipment often ended up broken.
Rather unscientifically, the three weather men would estimate the wind speed, by measuring the angle they could lean into the wind, before falling over.
It just makes me wonder how many readings back in the day were just estimates, because it was just too cold or too wet or too hot to attend to the instruments
Great! With enough experience, they got their bodies calibrated as wind-measuring devices.
Yes – but did the amount of beer and ale consumed over time decrease their “instrument’s” sensitively to wind over time?!
I watched an interesting program on the history of Ben Nevis last week, which included the fact that the Victorians set up a weather monitoring station at the top – quite a feat in those days. They dutifully measured various parameters each day BUT, because Ben Nevis had over 200 days per year of gales howling over the top, the wind measuring equipment often ended up broken.
Rather unscientifically, the three weather men would estimate the wind speed, by measuring the angle they could lean into the wind, before falling over.
It just makes me wonder how many readings back in the day were just estimates, because it was just too cold or too wet or too hot to attend to the instruments
A relative was a lighthouse keeper,and whilst he was meticulous in doing the measurements, he told me of a light keeper with a heart condition who could only climb the stairs once a shift – so he used to guess all the meteorological measurements during his shift.
Of course, some were not exactly “precise” – for they were asked to estimate cloud height. I believe they estimated 2000m, and by chance had to make a journey by helicopter and found to their amazement it was really 500m.
But on temperature – I wouldn’t be surprised if 10% or more were guessed. And that is in Scotland where there was a very strict regime. But in other places, I could quite believe that no one checked equipment for weeks on end and they just pencilled in all the readings they missed.
They are now infilling over 50% measurement. Yet they are totally unconcerned about it. So much for past measurement being estimated, I am guessing today is worst than the past.
Land use issues are probably number one. Many locations that were once rural are now urban or suburban. Also, airports have grown and grown bigger.
Many US National Weather observation locations that are used for climate records use ASOS. These sensors were designed with airport operations in mind and not climate. Here in the Pacific Northwest, we have issues with spiders and other insects building their webs on/in the sensors. Then, the fans fail.
We are measuring something different than we did 30-40-60 years ago or more, and we are measuring them using different instruments that were designed to get the human observer out of the picture. I could go on and on.
As a society, it seems that we are putting the cart in front of the horse. We are coming to conclusions when the science of measurement and instrumentation is in itself a problem. We don’t know what is going on, yet we need to do something, and do it quickly -even though we really don’t know the scope of the problem if there even is one. We live in a mad world!
Why muddy the water by going on about aerosols as if they’re one of the “other” drivers but fail to mention aerosols mask CO2 caused warming? Without aerosol masking it would 1C hotter.
Why muddy the waters by continuing your specious fulminations?
“specious”?
Go on Einstein, you explain aerosol masking.
“Einstein”? Go on Loydo, your explain your specious fulminations, if you can.
You are the one making vacuous claims. Document them.
Loydo,
And you know that aerosols produce 1C cooling because…models? Models yielding spaghetti all over the chart and not reproducing the actual temperature record.
“And you know that aerosols produce 1C cooling because…”
Volcanoes.
Because they scatter and absorb incoming sunlight, aerosol particles exert a cooling effect on the Earth’s surface. The Pinatubo eruption increased aerosol optical depth in the stratosphere by a factor of 10 to 100 times normal levels measured prior to the eruption. (“Aerosol optical depth” is a measure of how much light airborne particles prevent from passing through a column of atmosphere.) Consequently, over the next 15 months, scientists measured a drop in the average global temperature of about 1 degree F (0.6 degrees C).
https://earthobservatory.nasa.gov/images/1510/global-effects-of-mount-pinatubo
Loydo,
A selective, partial truth, specious response, eh?
Def: Aerosol – a suspension of fine solid or liquid particles in gas
Far more more than fine volcanic ejecta are defined as atmospheric ‘aerosols’. Fine dispersions of water droplets; eg. ‘clouds’, are the primary atmospheric aerosols. These H2O aerosols (clouds) can obstruct the sun on a hot summer day and lower the surface temperature by 15 F. These same H2O aerosols can locally reduce night time radiational cooling by similar degrees. Of all of the ‘aerosol dispersions’ present in our atmosphere, H2O is by far the most significant. Add in the heat transfer effects of H2O sensible heat capacity and phase change transformation latent heat flux from surface evaporation, convection, and high altitude condensation, and H2O aerosols dwarf all other atmospheric ‘aerosols’ for heat transfer effects on climate. CO2 gas is a tertiary contributor to atmospheric heat flux. Its minor effects are ‘masked’ by and indiscernably confounded with primary atmospheric heat transfer effects.
Atmospheric aerosols are not singularly ‘heating’ or ‘cooling’, and selectively stating otherwise is either specious or ignorant. But you already knew that, didn’t you Loydo? The only ‘masking’ here is generated by your specious fulminations.
Sulphurous aerosols, mainly from coal combustion have a masking effect otherwise know
global dimming. I didn’t that was controversial. I’m sure Roger is aware of it.
Loydo,
First you said it was volcanic aerosols. Then you claim it is coal combustion aerosols, without substantiation. Your evasive attempts to muddy the waters by continuing your specious fulminations have failed.
Loydo, the big difference in Aerosols is that since the 1970s clean air acts we have massively REDUCED air born aerosols particularly those like SO2 which are known coolants.
Indeed the big clean up occurred between 1970-2000 which just happens to be the same period as we had warming. So, yes aerosol cooling did appear to be important in the 1970s, indeed, I strongly suspect the rapid increase in SO2 was a large contributor to the global cooling scare.
But likewise, if it cooled the atmosphere in the 1970s removing those aerosols as we did undoubtedly led to warming after the 1970s cooling scare.
Loydo is obviously the latest iteration of the “Doyle”. The effects of aerosols depend on the where,what, how,size,when etc. The only person “muddying the waters” or to be more precise, talking nonsense, is you.
Now that griff has worn out his welcome, Loydo has taken over that role.
I love the way the acolytes pretend that they know exactly how much everything impacts the climate.
Exactly 1C hotter? How do you know that? Direct revelation from God?
Regardless, even a troll such as yourself should be capable of recognizing how the level of aerosols in the atmosphere has been decreasing since the 70’s. By your own claims, that would result in a net warming that has nothing to do with CO2.
The problem is that there are no solid records of the amount of aerosols in the atmosphere. Not today, and certainly not 50 years ago. So the correction factors are just more guesses, added to all the other guesses that are used to create the climate models.
At about min. 4:50 Dr. Pielke says he thinks the IPCC focuses on CO2 almost exclusively because it stays in the atmosphere for a long time.
That is the assumption that is used for much of the IPCC analysis but it is not validated and remains a poorly supported assumption. There is adequate analysis evaluating the evolution of CO2 in the atmosphere to falsify the assumption . Because the residence time of CO2 is short (about 5 yrs.) human generated Co2 can only be responsible for about 4% of the CO2 in the atmosphere and thus can only be blamed for about 4% of whatever evil this trace gas gets blamed for. Isn’t it time to focus on this fact when discussing human effects on the climate system?
You’ve fallen for some disinformation. 5 years might be the average residency of a single molecule but not of the plume as a whole which is exchanging with the ocean.
“from 20–60%, remains airborne for a thousand years or longer”
https://geosci.uchicago.edu/~archer/reprints/archer.2008.tail_implications.pdf
In other words forever.
Loydo, if you believe the “its forever” meme then mans 4% contribution – 8 billion vs nature’s 198 billion tonnes annual “churn” then next year the 400ppm will be 416 and 432 the year after that etc. etc.
The IPCC’s 100 year residence is a childish and cherry picked calculation and is also unsupported by the rate of growth in atmospheric CO2.
It is you that has fallen for disinformation.
“The IPCC’s 100 year residence is a childish”
No.
The CC is in balance.
Any more added will push it out of balance.
It builds up (in the air and in the oceans alike)
Individual atoms of CO2 are exchanged in the biosphere but the balance is maintained.
A 100 gal tank has a drain of 1 gal/min and rain input of 1 gal/min.
Result balance.
Now make the input 1.5 gal/min for the same drain.
Guess what?
The tank will overflow.
Result on Earth… 40+% increase in atmospheric CO2 concentration since pre-industrial.
It’s really not controversial.
Oh wait….
It is if you only read from certain sources.
And there is no controversy over where the extra 40+% is coming from.
Us.
There are sceptics out there (here?) that know this.
Why are they not calling out this rubbish?
The volume of a tank is fixed while the volume of the atmosphere is not and expands and contracts accordingly.
40% of a trace gas is still a trace gas. What is this “balance” you speak of? Which came first, the temperature or the CO2? So far that scary 40% INCREASE in CO2 has not done didly squat to anything.
“The volume of a tank is fixed while the volume of the atmosphere is not and expands and contracts accordingly.”
Only because of temperature changes.
I talk of CO2 being respirated by plants to make O2, and the ocean exchanging molecules. There is no increase in the total number of molecules in the atmosphere. The balance comes from the carbon cycle being able to source and sink the CO2 that was present pre-industrial. Such that the atmospheric ppm was static and ocean ph was too. Now it is not – hence the tank analogy.
To Anthony B:
So, the active volume of water increases to exceed the volume of its static, fixed container. The Earth does not have a static, fixed container for its atmospheric volume — if the atmospheric volume does increase by a tiny bit because of added CO2, then the tiny expansion of the atmosphere would seem to increase the surface area of atmosphere, in effect , increasing the volume of the “container” holding the added CO2.
The carbon cycle does not “source and sink”. You write that sentence as though a knowing entity is conscious of its own dual process. Sourcing and sinking are components of the cycle — these come first. Sourcing and sinking are the carbon cycle — these components of the cycle allow us to refer to an encompassing process correctly (i.e., the cycle). Cycle awareness does not come before the sourcing and sinking. Rather, sourcing and sinking are terms we apply to the process of cycling. The cycle does not source and sink. Rather, sourcing and sinking constitute the process of the cycle.
You use terminology as though things are the other way around. The carbon cycle does not know a preset balance before it is achieved, in order to maintain it — the carbon cycle proceeds “in ignorance” of such proposed “balance”, and we humans assess the inputs and outputs.
I don’t think that even we humans have established this “balance” that you speak of. Nature is not static, and nature is not static, even dynamically, like your water tank.
A slight increase in atmospheric volume of a 0.04% gas would seem to introduce a slight increase in the volume that radiates, and this still would not be enough to affect all the other molecules that this added radiation could jiggle, heat-wise. There’s lots of room still left, even if CO2 worked the way you seem to believe, as I’m seeing it.
“So, the active volume of water increases to exceed the volume of its static, fixed container.”
Yes.
Except, that the analogy is not imagining an increase in the volume of the atmosphere, rather a conversion/exchange of molecular chemistry of the 0.04% and increasing, part of it. As CO2 increases, atmospheric O2 concentration is decreasing. The CC works in balance and as such is the “static tank” – the additional CO2 is added as the increase in the inflow with the outflow unchanging (due the CC balance). Hence the “overflow”.
“The Earth does not have a static, fixed container for its atmospheric volume — if the atmospheric volume does increase by a tiny bit because of added CO2, then the tiny expansion of the atmosphere would seem to increase the surface area of atmosphere, in effect , increasing the volume of the “container” holding the added CO2.”
That’s not what I am saying. No extra molecules are made.The atoms volume is unaltered.
“You use terminology as though things are the other way around. The carbon cycle does not know a preset balance before it is achieved, in order to maintain it — the carbon cycle proceeds “in ignorance” of such proposed “balance”, and we humans assess the inputs and outputs.”
The CC is achieved naturally by virtue of the planet coming to a (quasi) balance ….
Sources and sinks, as I term them, are simply terms to describe natural respiration in the biosphere.
“Nature is not static, and nature is not static, even dynamically, like your water tank.”
Indeed so …. but with enormous inertia on millennial scales (in absence of humankind).
“A slight increase in atmospheric volume of a 0.04% gas would seem to introduce a slight increase in the volume that radiates, and this still would not be enough to affect all the other molecules that this added radiation could jiggle, heat-wise. “
But it’s not a “slight increase” – it’s in excess of 40%. And yes it is enough to increase back-radiated LWIR. It is the most important non-condensing GHG, it can increase by virtue of that and by being independent of temp. Use MODTRAN to verify, and/or see ….
https://newscenter.lbl.gov/2015/02/25/co2-greenhouse-effect-increase/
BTW: I note that it’s important enough to “green” the planet never-the-less.
Anthony B,
If there is no volume increase, then how is your analogy still applicable? For something to overflow a container of a given volume maintained, then that which overflows must be of greater volume.
The extra bulk of water does not somehow become exchanged or reorganized with the molecules of the water container — it overflows the container volume with a greater volume of liquid.
You now focus on the re-organizing of oxygen to make CO2, and how this removes some oxygen from the atmosphere, while increasing the percentage of CO2. So, what is your worry? — depleting atmospheric oxygen or CO2 warming, or both?
Both worries are unjustified, because there is too little CO2 to cause any significant warming, even if the percentage tripled or more, and there’s so much oxygen that the loss from fossil fuel use is insignificant — comparable to other periods of Earth’s geological existence, where life still flourished during several percentage points below current oxygen levels in the atmosphere.
The greater greening or Earth attributed to CO2 provides more plants to reverse the process you worry about, adding more oxygen to the atmosphere. It’s as if Nature has a strategy to keep your sense of “balance”.
CO2 plant food is a benefit to humanity.
5 years is a long time compared to water and methane.
Dr Pielke talked of using the argo data instead of air temperature. The problem I have with this is that since about 2012 Josh Willis has been adjusting that data. prior to that for example he wrote several papers showing the oceans were cooling, particularly the southern Pacific. After he had his eureka moment these oceans showed warming. His justification for adjustments was very debatable and the factors he was taking into account were in some cases no better than guesses. At the end of the day his aim was to account for the claimed difference between incoming and outgoing radiation. But that factor is nothing but a guess also as the outgoing radiation cannot be properly assessed because the satellite can only detect radiation traveling vertical to the earth. Photons on an oblique path are not detected.
So are we talking about Willis’s adjusted data or unadjusted data. Could Dr Pielke care to comment on that
If you give people a lot of monitoring equipment and then ask them to look for errors that will tend to push the average one way – it’s pretty obvious that they will predominantly find errors that push the average in the preferred direction and that the average will move.
If you ever hear of people “having to make adjustments” who have a known bias as to what they think the data should show, then unless the change is significantly greater than the worst errors in the system (or contrary to what they would be erring toward), then you should basically ignore any changes/trends from such a group.
As I’ve always said. If your adjustments are larger than the signal you claim to have found, then you haven’t found anything.
Reality is a cruel mistress.
When you design tools to read reliably to whole temperatures don’t be surprised when you can’t read reliably to fractions of temperatures
Don’t be surprised either when this is pointed out to you.
Unless you have an agenda. Then those people are deniers.
I’ll repeat myself. There are two things at work here, accuracy and precision.
Accuracy – how close a measurement is to the correct value.
Precision – how close the agreement is between repeated measurements.
This definition of precision inherently requires the same device and measuring the same thing. Multiple measurements of the same thing with the same device can be used to find a mean measurement with a smaller error, assuming a random (Gaussian) distribution which is a BIG assumption. Under these conditions you can make the case that the mean is converging point of the measurements and that the error of the mean is smaller than any of the independent measurements.
The problem here is that you are never measuring the same thing. This means you can’t reduce the error component. You can calculate a mean of unique things like temp measurements at different times but the error of the mean does not really predict how accurate the mean is. With independent temp measurements the best you can do is average the maximum possible and the minimum possible and that defines the error range.
Climate scientists ignoring this and using temps recorded to the nearest degree to calculate precision out the hundreths of a degree are simply abusing everyone. This is why significant digits on measurements were originally designed and why metrology is a unique course all by itself.
I forgot to add that this is similar to taking the output of 10 GCM’s, averaging them, and saying that you then have an accurate answer. It just won’t work!
Yep.
The best advice is to design the repeatability to be a factor of ten less than the variation you expect to measure.
Then you don’t have to worry about sample distribution assumptions.
Or in simple terms, follow the Scientific Method when considering measurements.
The trouble is that the same method allows you to make assumptions about the data but then this precludes conclusions from real application. A subtle but powerful shift that requires awareness. And somw training in Metrology as you say.
First, the idea of “improving” the weather stations is just the kind of nonsense which got us into this mess. You don’t start with a pig’s ear of a station network and try and turn them into silk purses. Instead you MUST get the required funding (probably well over $1billion) and then set up a PURPOSE made network of stations DESIGNED to do the job .. and with the budget that will DO THE JOB.
Second, the biggest problem facing humanity is due to anti-biotic resistance where the single most obvious issue is that we feed farm animals anti-biotics as a matter of course. Even for clean humans with good hygiene and a relatively low level of contamination from person to person, there is in effect a limited number of doses of anti-biotics until we go back to the pre WWII situation of about 1/3 of all children dying from preventable infections. But if you give those anti-biotics at low dosage to animals living in close proximity in their own filth you are MASSIVELY reducing the number of doses before anti-biotic immune bacteria evolve. Indeed, if you want a perfect environment to develop anti-biotic immune bacteria it is a factory farm where you feed low dosages of anti-biotics as a matter of course.
Finally, the big problem we have is the group-think which is now prevalent in academia. And whilst I congratulate Pielke for being less affected than most, I have little doubt that even what Pielke is saying is swayed strongly toward the group-think and that the real truth about the climate will lie a good deal to one side (away from the “consensus” group-think). Indeed, in 100years, I suspect people when they look back will think that Pielke’s view was just as crazy as the rest of academia – the problem of course, is that until we can look back with hindsight, non of us can be certain what “sane” looks like.
Ocean heat content cannot be a direct measure of the level of climate forcing with the cloud cover feedback being negative. The upper 2000 meters OHC was largely static during the last cold AMO phase, and has increased since 1995 with the warm AMO phase reducing cloud cover. The warm AMO is associated with weaker solar wind states since the mid 1990’s.
It’s possible that ocean heat, which would correlate strongly with absolute humidity, would create a positive feedback at lower levels, due to the “greenhouse” behavior of water vapor, but as levels rise and the water vapor condenses into droplets to form clouds, starts to become a negative feedback. When those clouds build into cumulonimbus and convection transports large amounts of latent heat from the surface to the tropopause, it’s a circumvention of the “greenhouse” mechanism, and even more of a negative feedback.
Warmer sea surfaces means less low cloud cover. A warm AMO and increased El Nino during weaker solar periods will increase lower troposphere water vapour, amplifying the negative feedback effect of the ocean phases. There has also been an increase in surface wind speeds over the oceans since the mid 1990’s.
Ulric Lyons
The OHC is increasing since 1970:
https://www.data.jma.go.jp/gmd/kaiyou/english/ohc/ohc_global_en.html
I could show you a graph presenting both the undetrended AMO and Japan’s OHC.
No problem!
Thanks for discussing some of the x’s that effect the heat profile in the oceans.
By chance have you had a chance to review Dr. Reid’s thoughts on the need to take a deeper look into the fundamentals of fluid dynamics- “The Fluid Catastrophe has just been published. It is likely to be controversial so I have set up a blog to facilitate discussion:”
http://fluidcatastrophe.net/
Temperature data is totally useless without sunshine hours data.
Location, location, location.
Ian Plimer, in Heaven and Earth, 2009, p 378 – 379 talks about the global location of weather stations. There have been more in populated areas of developing counties than in third world countries and remote areas.
He also notes changes in the numbers of weather stations for compilation of average surface temperatures.
1980 – more than 6,000
1998 – 2,700
2009 – about 2,000
Most of the stations that disappeared were rural especially in the former Soviet Union.
Might that have something to do with an increase in global temperature reporting?
Seeing that change as a gif would be interesting.
Joe Armstrong
You refer to a 10 years old paper which itself did not properly reflect reality.
In the list below, you find over 100000 weather stations, about 36000 of them busy with temperature measurements:
ftp://ftp.ncdc.noaa.gov/pub/data/ghcn/daily/ghcnd-stations.txt
YES: it is evident that historically, most stations were set up in Northern America and Northern Europe.
If you subdivide the Globe into a grid of 2.5 ° cells (about 77000 km² at the equator), you will see where the most stations were/are located:
https://drive.google.com/file/d/17ZgjmYUL43320EoLQ5bL0Hs3aYwas-gt/view
There are in the GHCN daily record as many stations in the US as outside of it. Some of the grid cells in the US host more than 300 stations. The 100 worldwide most populated cells contain over 16000 stations; only four of them are outside of the US.
This is the reason why temperature time series are constructed such that this predominance of the US, Europe etc is reduced as much as possible, by averaging station data into latitude weighted grid cells before averaging the whole into months or years.
Instead of having 18000 US stations competing with 18000 non-US stations (and thus 6 % of the Globe’s land surfaces having the same weight as the remaining 94%), you move to 200 US grid cells competing with 2000 non-US grid cells. Is that not more equitable?
Some are brazen enough to regard this procedure as manipulation, and call it ‘data wrangling’.
But only because its effect is to make the Globe a bit warmer; it the effect was the other way ’round, they would of course all silently agree.
Rgds
J.-P. D.
No matter how much they mess with the numbers, ice knows no law except 32 degrees.
The Nenana date record of the ice on the river breaking every spring makes it a non fudgeable figure to track. And it clearly shows some level of warming in the last half century.
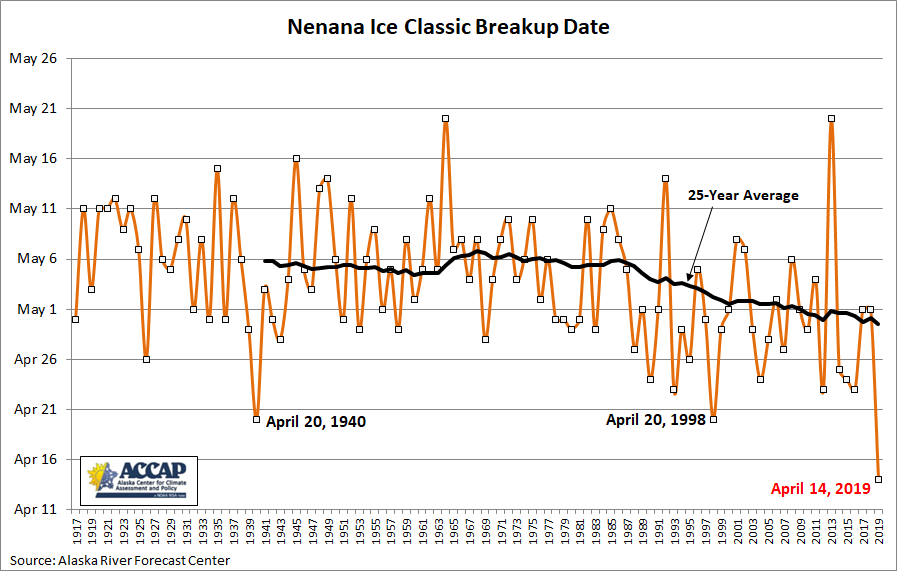
Somewhere there are probably other long running records of thaw or first frost dates or such that can be used to determine the direction and velocity of temperature changes while bypassing the adjustable nature of figures. It won’t give the simpletons their exact decimal value of changes over time, but its far more reliable.
Or was there a change in the watershed such that there was less ice?