Reposted from Dr. Roy Spencer’s Blog
April 23rd, 2019 by Roy W. Spencer, Ph. D.
This post has two related parts. The first has to do with the recently published study of AIRS satellite-based surface skin temperature trends. The second is our response to a rather nasty Twitter comment maligning our UAH global temperature dataset that was a response to that study.
The AIRS Study
NASA’s Atmospheric InfraRed Sounder (AIRS) has thousands of infrared channels and has provided a large quantity of new remote sensing information since the launch of the Aqua satellite in early 2002. AIRS has even demonstrated how increasing CO2 in the last 15+ years has reduced the infrared cooling to outer space at the wavelengths impacted by CO2 emission and absorption, the first observational evidence I am aware of that increasing CO2 can alter — however minimally — the global energy budget.
The challenge for AIRS as a global warming monitoring instrument is that it is cloud-limited, a problem that worsens as one gets closer to the surface of the Earth. It can only measure surface skin temperatures when there are essentially no clouds present. The skin temperature is still “retrieved” in partly- (and even mostly-) cloudy conditions from other channels higher up in the atmosphere, and with “cloud clearing” algorithms, but these exotic numerical exercises can never get around the fact that the surface skin temperature can only be observed with satellite infrared measurements when no clouds are present.
Then there is the additional problem of comparing surface skin temperatures to traditional 2 meter air temperatures, especially over land. There will be large biases at the 1:30 a.m./p.m. observation times of AIRS. But I would think that climate trends in skin temperature should be reasonably close to trends in air temperature, so this is not a serious concern with me (although Roger Pielke, Sr. disagrees with me on this).
The new paper by Susskind et al. describes a 15-year dataset of global surface skin temperatures from the AIRS instrument on NASA’s Aqua satellite. ScienceDaily proclaimed that the study “verified global warming trends“, even though the period addressed (15 years) is too short to say much of anything much of value about global warming trends, especially since there was a record-setting warm El Nino near the end of that period.
Furthermore, that period (January 2003 through December 2017) shows significant warming even in our UAH lower tropospheric temperature (LT) data, with a trend 0.01 warmer than the “gold standard” HadCRUT4 surface temperature dataset (all deg. C/decade):
AIRS: +0.24
GISTEMP: +0.22
ECMWF: +0.20
Cowtan & Way: +0.19
UAH LT: +0.18
HadCRUT4: +0.17
I’m pretty sure the Susskind et al. paper was meant to prop up Gavin Schmidt’s GISTEMP dataset, which generally shows greater warming trends than the HadCRUT4 dataset that the IPCC tends to favor more. It remains to be seen whether the AIRS skin temperature dataset, with its “clear sky bias”, will be accepted as a way to monitor global temperature trends into the future.
What Satellite Dataset Should We Believe?
Of course, the short period of record of the AIRS dataset means that it really can’t address the pre-2003 adjustments made to the various global temperature datasets which significantly impact temperature trends computed with 40+ years of data.
What I want to specifically address here is a public comment made by Dr. Scott Denning on Twitter, maligning our (UAH) satellite dataset. He was responding to someone who objected to the new study, claiming our UAH satellite data shows minimal warming. While the person posting this objection didn’t have his numbers right (and as seen above, our trend even agrees with HadCRUT4 over the 2003-2017 period), Denning took it upon himself to take a swipe at us (see his large-font response, below):

First of all, I have no idea what Scott is talking about when he lists “towers” and “aircraft”…there has been no comprehensive comparisons of such data sources to global satellite data, mainly because there isn’t nearly enough geographic coverage by towers and aircraft.
Secondly, in the 25+ years that John Christy and I have pioneered the methods that others now use, we made only one “error” (found by RSS, and which we promptly fixed, having to do with an early diurnal drift adjustment). The additional finding by RSS of the orbit decay effect was not an “error” on our part any more than our finding of the “instrument body temperature effect” was an error on their part. All satellite datasets now include adjustments for both of these effects.
Nevertheless, as many of you know, our UAH dataset is now considered the “outlier” among the satellite datasets (which also include RSS, NOAA, and U. of Washington), with the least amount of global-average warming since 1979 (although we agree better in the tropics, where little warming has occurred). So let’s address the remaining claim of Scott Denning’s: that we disagree with independent data.
The only direct comparisons to satellite-based deep-layer temperatures are from radiosondes and global reanalysis datasets (which include all meteorological observations in a physically consistent fashion). What we will find is that RSS, NOAA, and UW have remaining errors in their datasets which they refuse to make adjustments for.
From late 1998 through 2004, there were two satellites operating: NOAA-14 with the last of the old MSU series of instruments on it, and NOAA-15 with the first new AMSU instrument on it. In the latter half of this overlap period there was considerable disagreement that developed between the two satellites. Since the older MSU was known to have a substantial measurement dependence on the physical temperature of the instrument (a problem fixed on the AMSU), and the NOAA-14 satellite carrying that MSU had drifted much farther in local observation time than any of the previous satellites, we chose to cut off the NOAA-14 processing when it started disagreeing substantially with AMSU. (Engineer James Shiue at NASA/Goddard once described the new AMSU as the “Cadillac” of well-calibrated microwave temperature sounders).
Despite the most obvious explanation that the NOAA-14 MSU was no longer usable, RSS, NOAA, and UW continue to use all of the NOAA-14 data through its entire lifetime and treat it as just as accurate as NOAA-15 AMSU data. Since NOAA-14 was warming significantly relative to NOAA-15, this puts a stronger warming trend into their satellite datasets, raising the temperature of all subsequent satellites’ measurements after about 2000.
But rather than just asserting the new AMSU should be believed over the old (drifting) MSU, let’s look at some data. Since Scott Denning mentions weather balloon (radiosonde) data, let’s look at our published comparisons between the 4 satellite datasets and radiosondes (as well as global reanalysis datasets) and see who agrees with independent data the best:

Trend differences 1979-2005 between 4 satellite datasets and either radiosondes (blue) or reanalyses (red) for the MSU2/AMSU5 tropospheric channel in the tropics. The balloon trends are calculated from the subset of gripoints where the radiosonde stations are located, whereas the reanalyses contain complete coverage of the tropics. For direct comparisons of full versus station-only grids see the paper.
Clearly, the RSS, NOAA, and UW satellite datasets are the outliers when it comes to comparisons to radiosondes and reanalyses, having too much warming compared to independent data.
But you might ask, why do those 3 satellite datasets agree so well with each other? Mainly because UW and NOAA have largely followed the RSS lead… using NOAA-14 data even when its calibration was drifting, and using similar strategies for diurnal drift adjustments. Thus, NOAA and UW are, to a first approximation, slightly altered versions of the RSS dataset.
Maybe Scott Denning was just having a bad day. In the past, he has been reasonable, being the only climate “alarmist” willing to speak at a Heartland climate conference. Or maybe he has since been pressured into toeing the alarmist line, and not being allowed to wander off the reservation.
In any event, I felt compelled to defend our work in response to what I consider (and the evidence shows) to be an unfair and inaccurate attack in social media of our UAH dataset.
I have always relied upon UAH data because it is closest to the radiosonde data, and because I have the greatest confidence in Roy Spencer and John Christy.
Agree.
UAH is the only data-set that seems trustworthy, compiled by people without an agenda, which used to be most scientists, in the good old days.
It is a reminder that compilations can vary a lot.
But why is any average global temperature compilation useful as a proxy for “the climate”?
From a physics point of view, there is no global temperature.
The use of a global average temperature is substituting statistics for physics !
People are “measuring” a non-existent quantity.
An average of various temperatures, is not a temperature itself, it is only a statistic, that could be calculated in hundreds of different ways.
There is no way to falsify any particular method of calculating an average — they are all (falsely) proclaimed to be “the temperature”.
Of course an out-of-equilibrium climate system does NOT have only one temperature.
And no one has any idea what a “normal” global average temperature would be, because the concept of one temperature makes no scientific sense for a planet not in thermodynamic equilibrium.
It would be surprising if any two compilations of the “average” were the same — that would suggest collusion — and require an investigation for several years (Robert Mueller is available now) !
.
.
.
What really matters to people ?
Not the average temperature of the ocean, assuming anyone could measure that with any accuracy — because almost no one lives on the ocean’s surface.
People should care if where they live was repeatedly setting new heat records, or new cold records.
People should care about the length of the growing season.
People should care about the productivity of farmers.
And for the rich folks — they should care about whether rising sea levels have lowered the valuations of their seafront mansions?
What people should NOT care about, is an average of various temperature measurements, for a planet not in thermodynamic equilibrium, because a single average temperature makes no scientific sense, and most important: — NO ONE LIVES IN THE AVERAGE TEMPERATURE !
And the average temperature does not drive the weather on this planet.
Local temperatures are important.
Temperature differentials between the poles, and the tropics, are important.
The average temperature is not important, except for climate change propaganda.
The “average temperature” is a nearly “perfect” statistic for science-free climate change scaremongering !
It would be “perfect” if Mr. Spencer and Christy stopped compiling their UAH data, and allowed the climate scaremongers to run wild with their infilled, adjusted, readjusted, re-readjusted homogenized pile of you know what !
My climate science blog:
http://www.elOnionBloggle.Blogspot.com
Richard Greene asks: “But why is any average global temperature compilation useful as a proxy for “the climate””
Officially it is not called the “global average temperature”, it is called the global mean SURFACE temperature (GMST). Surface temperature or its anomalies can be average over the entire surface of the globe by weighting per unit area. Different schemes for accomplishing this give essentially the same answer.
People care about the amount of change, but that appears to be small compared with other things. In the continental US away from the coasts, moving south 100 miles is an average of 1.25 degC of warming. Moving south 100 miles isn’t a lot of climate change, especially compared with seasonal or diurnal change (about 10 degC). Nevertheless, GMST was about 6 degC colder on the average during the last glacial maximum. The Little Ice Age appears to have been at most 1 degC cooler than the MWP and 1850-1930.
Change is important because change can be expensive or difficult. The 6 degC of warming that slowly ended the last ice age was accompanied by 120 m of sea level rise – 20 m (at equilibrium) per degC of warming! Since the amount of land covered with ice shrinks as ice caps retreat towards the poles, it won’t be 20 m/degC, but 10 or even 5 m/degC is large. Apparently SLR was about 7 m higher during the last interglacial.
When you are talking about temperature not representing physics, you may be concerned with heat capacity, which is measured per unit weight or volume/density. Most of the planet’s air mass is mixed well enough vertically so that a 1 degC rise at the surface is a 1 degC rise throughout the troposphere. That is good enough for many calculations (and we are debating whether the anticipated modest amplification of warming in the upper tropical troposphere has been observed in parallel with surface temperature. To a first approximation, surface warming provides reasonable estimate of how much heat flows into the atmosphere when the surface warms 1 degC. ARGO has been tracking the slow penetration of surface warming into the depths of the ocean, so we no longer need to make guesses about that subject.
Finally, if you take a gray body with emissivity of 0.61 and temperature of 288 K and warm it 1 degC, simple physics would predict that it will emit 3.3 W/m2 more LWR. And if you take a model of the planet with a million grid cells with temperatures ranging from 190 K to 310 K and artificially raise the temperature 1 K everywhere without allowing anything else to change, the model emits an additional 3.2 W/m2. The simple graybody model works pretty well.
I used to like the fact that alarmist’s RSS was warming slower than skeptics UAH. It kinda gave the impression that they were both doing their best in an objective way without letting their positions on AGW taint their work.
Since then a UAH revision made very slightly more warmer and the RSS, having been attacked when the lack of warming of 18 years was pointed out by Christopher of Benchley, did a major shake up , jumped the shark and lost all credibility.
BTW Dr Spencer, don’t bother responding to “rather nasty comments on Twitter”. That is a hole you will never get out of. Plus it probably gives more pleasure than you can imagine to the insignificant dork that wrote it that you took him seriously enough to pen a reply.
Link to Christy et al. 2018 paper
Examination of space-based bulk atmospheric temperatures used in climate research
International Journal of Remote Sensing 39(11):3580-3607 · June 2018
https://www.tandfonline.com/doi/full/10.1080/01431161.2018.1444293
This fascinating exposition shows clearly how much scientists still have to learn about the science of temperature measurement, a far cry from the proselytising certainties presented to Joe Public.
It is rather reminiscent of the difference between what oncologists said amongst thenselves 30 years ago and how cancer treatments were presented to the well meaning but uninformed publics.
As Dr Spencer so rightly says, there is no crime in discovering the limitations of your early methodologies, it being a spur to refinements, improvement and deeper understanding.
Some sizeable errors bars on those puppies.
Bear in mind that this is showing the difference between satellite and radiosonde, the difference is small and the error bar has to account for the uncertainty in both sets of data since both contribute to the uncertainty of the difference.
Ok thanks Greg.
The differences are in hundredths of degree.
I still think the most useful thing the satellite AMSU’s can perform at this point is to provide evidence of (presence or absence) of the AOGCM-predicted mid-tropospheric tropical hotspot.
There just can’t be any wiggle room for the modellers on this point. Their entire line of argument for GHG effect amplification, and thus alarmist model outputs beyond 1- 1.5 deg C warming from CO2 alone, relies on that damn hotspot being there. It is the unique signature of GHE warming, as opposed to internal climate cycles, or UHI contamination of surface datasets. If it ain’t there, then everything the IPCC and the climate alarmists keep saying is wrong.
And so far, there is no clear data to support a mid-troposphere hotspot in the AMSU data, unless I’ve missed something. Karl and Co., tried to hand-wave it away with a, “It is now largely resolved” mis-direction. (ref: Global Climate Change Impacts in the United States, by Karl, Melillo, Peterson. Cambridge University Press, 2009, on page 21, their references: 31, and 71-75).
But if one drills down through each of those references and the references behind them behind that particular passage on the hotspot, you find they were lying. They made-up the exoneration (the hotspot being “found”), when the literature didn’t actually say that.
If it ain’t there, then everything the IPCC and the climate alarmists keep saying is wrong.”
… and the Hot Spot ain’t there!
Face it – the warmists are great storytellers, but they exclusively deal in fiction. NOT ONE of their very-scary predictions of runaway warming or wilder weather has happened. They have a perfectly NEGATIVE predictive track record. Nobody should believe them.
. If it ain’t there, then everything the IPCC and the climate alarmists keep saying is wrong
Even if we suddenly experienced surface warming, without the hotspot – their hypothesis is disproven.
The official line is that a Santer study found the hotspot. They won’t discuss how he got there, though. It has to do with his using a novel theory to calculate the wind’s effect, thereby showing the hotspot. He then smeared the color palate of his atmospheric graphic to show …. what?
Benji Santer’s own “seasonal heartbeat paper” last year (another sad, pathetic attempt to find a fingerprint of a-GHE) published in Science mag actually showed the Annual tropospheric tropical hotspot was indeed missing. All one had to do is look at his data graphs in that paper critically for past (previously claimed) fingerprints to realize he actually was disproving with his own data his own previous hypothesis of positive feedback GHE.
Just another tangled web in an attempt to deceive.
“Their entire line of argument for GHG effect amplification, and thus alarmist model outputs beyond 1- 1.5 deg C warming from CO2 alone, relies on that damn hotspot being there”
A popular claim, but I think most scientists involved at some point or another have noted that this is not the case, e.g. John Christy: “Yes, the hot spot is expected via the traditional view that the lapse rate feedback operates on both short and long time scales… it [the hot spot] is broader than just the enhanced greenhouse effect because any thermal forcing should elicit a response such as the “expected” hot spot.”
The greenhouse effect is radiative, so primarily warms by increasing downwelling longwave (and reducing energy loss to space). Many mechanisms influence the vertical distribution of warmth (lapse rate). Apparently, “in the tropics, moist thermodynamic processes amplify surface warming”, so it is about the modeling of these “moist thermodynamic processes” i.e. convection and evaporative heat transfer, not the greenhouse effect.
I assume Christy and others still bring it up in support of claims that models on the whole still might have significant problems, but not as a specific dispute of the greenhouse effect as a cause of warming (but I could be wrong.)
“And so far, there is no clear data to support a mid-troposphere hotspot in the AMSU data, unless I’ve missed something”
Santer et al’s 2016 paper “Comparing Tropospheric Warming in Climate Models and Satellite Data” is interesting to compare here.
https://journals.ametsoc.org/doi/full/10.1175/JCLI-D-16-0333.1
It looks at 37 CMIP5 models (“the number of CMIP5 models with preindustrial control runs from which synthetic MSU temperatures could be calculated”) and finds “It is shown that amplification of tropical warming between the lower and mid-to-upper troposphere is now in close agreement in the average of 37 climate models and in one updated satellite record” which apparently was RSSv3.
See Figure 9, and “For RSS, therefore, we no longer find evidence of a serious mismatch between simulated and observed amplification behavior in the tropical troposphere. Since Po-Chedley and Fu (2012b) also relied on CMIP5 simulations and on version 3.3 of the corrected RSS tropospheric temperature data, the fact that we obtained closer agreement between RSS and model average values appears to be primarily related to the availability of a longer observational record.”
It continues with some skepticism about UAH values given UAH TMT trends smaller than surface temperature trends over tropical oceans and other reasons:
“In contrast, UAH-based values of 1.013 and 1.030 (for UAH versions 5.6 and 6.0, respectively) are now even lower than the UAH results in Fu et al. (2011) and Po-Chedley and Fu (2012b) and are 13%–14% smaller than the CMIP5 value. On the longest time scales (35–37 yr), version 6.0 of the UAH TMTcr and TLT datasets yields tropical TMTcr/TLT trend ratios <1 (Fig. 9b). Such behavior is difficult to reconcile with basic physical principles (Stone and Carlson 1979), with model simulations (Po-Chedley and Fu 2012b; Held and Soden 2006; Thorne et al. 2007; Flannaghan et al. 2014), or with satellite estimates of tropical amplification on monthly to interannual time scales (Yulaeva and Wallace 1994; Hegerl and Wallace 2002; Santer et al. 2005; Karl et al. 2006). Taken together, these results suggest that residual errors in the UAH TMTcr and TLT datasets10 are the most likely explanation for UAH values close to unity, as well as for UAH TMTcr trends that are smaller than surface temperature trends over tropical oceans (Po-Chedley et al. 2015)."
Absolute B.S. This is another example of CliSci piling up words, mostly disconnected, to confuse the issue. There is no hotspot as predicted by UN IPCC climate models, no matter how many words one piles up.
The CliSci community could not have been more clear. The CMIP3 (AR4) and CMIP5 (AR4) models that had high ECS all predicted that the Tropical latitudes mid-troposheric hotspot was a unique signature, and thus expected finger-print of the GHE amplifying warming with a positive feedback from water vapor condensation in the tropics at mid-tropo altitudes. That is how they get from a CO2-only +1.5K CO2 warming to 2x to 3x warming of +3 K to +4.5 K temperature alarmism with water vapor + feedback.
The microwave sounders on the satellites are ideally in a position to globally confirm or refute this tropics prediction with hard observational data. So far, there is nothing. And you can bet if there were hard data to support the model GHE prediction, the Alarmists would be parading it up and down everywhere as vindication and “In Your Face, I Told You So.”
But 30+ years on and they ain’t.
As such, the strong GHE theory (water vapor amplified warming) should be dead. Gone. Done. Stick a fork in it.
Such a theory would have been long discarded in any other branch of non-politicized science. But Not climate science. Too much money is riding on the those Cargo Planes appearing.
“Greenhouse” gas “theory” is a total failure because since the surface is warmer than the atmosphere, the only way for the atmosphere to cool down is to radiate into space, and this would not be possible without active gases in the infrared spectrum.
The observations (see Khiel & Trenberth 1997, NASA 2009 Earth’s energy budget for example) show that :
– active gases in the infrared spectrum absorb 17 W/m² from the upward infrared flux emited by the surface,
– on the other hand, they radiate 170 W/m² into space in this same infrared spectrum.
Thus, the net effect of so called “greenhouse” gases (in conjuction with convection), if anything, is to cool down the atmosphere.
From the article of Dr Spencer :
“AIRS has even demonstrated how increasing CO2 in the last 15+ years has reduced the infrared cooling to outer space at the wavelengths impacted by CO2 emission and absorption, the first observational evidence I am aware of that increasing CO2 can alter — however minimally — the global energy budget”
There are many factors that could alter CO2 radiative flux. For example, as far as I know, an explanation of the reduced CO2 infrared cooling mentioned above might be :
– the sun activity has been decreasing since (at least) the two last cycles (23, 24) and this causes a modification of the Sun radiative spectrum with less emitted UV,
– in the stratosphere, collision between UV and O2 produce O3 which has a warming effect on the stratosphere,
– thus, a less active Sun should induce less warming in the stratosphere (less UV+O2 -> O3 reactions), and hence, a decrease of the radiative flux emitted into space by CO2.
Not to mention that a decrease in infrared cooling AT THE WAVELENGTHS IMPACTED BY CO2 does nothing more than confirm that there is more CO2. Infrared cooling from wavelengths NOT impacted by CO2 may have increased, which is conveniently omitted. When all you look for is an “effect” from CO2, that’s all you find.
“was a unique signature”
Sounds like you’re saying you think it’s a clear signature of water vapor feedback, not greenhouse warming. But that’s incorrect as well – water vapor feedback you test by studying water vapor itself, not lapse rate.
WG1 2.5.5 “Tropospheric humidity”:
“Since AR4 there have been three distinct efforts to homogenize the tropospheric humidity records from operational radiosonde measurements (Durre et al., 2009; McCarthy et al., 2009; Dai et al., 2011 … Over the common period of record from 1973 onwards, the resulting estimates are in substantive agreement regarding specific humidity trends at the largest geographical scales … In each analysis, the rate of increase in the free troposphere is concluded to be largely consistent with that expected from the Clausius–Clapeyron relation (about 7% per degree Celsius)”
If you want to convey IPCC statements, state the section. It sounds like you are conveying your interpretation of climate science, which when conveyed on web sites like this is maybe 99% wrong 99% of the time. What climate scientists actually believe should be the most testable claims out here – you just have to show what they say where.
The tendency seems overwhelming to say “the test of AGW is [what I say it is], and it failed, so throw the whole thing out and greenhouse warming isn’t real.” I understand fully why this is such a compulsion and I fully sympathize with it. I don’t want it to be true either. But in scientific method you have to apply tests correctly. I don’t get to just say “I dropped the feather in the wind, you’re ‘gravity’ theory says it’s supposed o fall, but it floated away – sorry if this were real science it would be Gone. Done. Stick a fork in it. Instead this ‘gravity’ theory is a cargo cult.’ As satisfying as that might feel.
I believe it’s relative humidity, not specific, that drives the discussion.
Geof.
It is not controversial to say as Christy does that;
“..any thermal forcing should elicit a response such as the “expected” hot spot.”
The key word is “expected” in this context.
AR4 states clearly that they see a tropospheric hot spot as the signature of GHG warming as GHG warming and some internal variability are their only significant forcings.
AR4, Ch. 10, Page 765;
“Upper-Tropospheric warming reaches a maximum in the tropics and is seen even in the early-century (2011-2030) time period. The pattern is very similar over the three periods, consistent with the rapid adjustment of the atmosphere to the forcing. These changes are simulated with good consistency among the models. The larger values of both signs are stippled, indicating that the ensemble mean is larger in magnitude than the inter-model standard deviation. The ratio of mean to standard deviation can be related to formal tests of statistical significance and confidence levels.”
The diagram shows a modelled warming at 200-400 hPa over the tropics to 2011-2030 of 1.5C to 2.0C above the 1980-1999 average. This is for the A1B scenario.
This implies that tropospheric warming is a signature of GHG warming or more specifically a signature of strong positive feedbacks to initial warming.
This is not observed;
McKitrick and Christy, 2018, referring to the hot spot;
“Table 2 lists the model-specific comparisons against the average observational series. In the restricted case, 62 of 102 models reject, while in the general case, 82 of 102 models reject. It is striking that all model runs exhibit too much warming and in a clear majority of cases the discrepancies are statistically significant.”
The idea that an initial warming at equilibrium of 1.1C for 2xCO2 could be amplified by strong positive feedbacks to 3.0C, the IPCC position, was always extremely unlikely. The data is now supporting what common sense should have shown us in the first place.
Geoff,
I point you to Santer’s own recent “seasonal heartbeat paper” in Science mag.
This paper
https://science.sciencemag.org/content/361/6399/eaas8806
(you have to be able to view the figures he shows – it’s paywalled)
was an attempt to find a another unique finger-print of GHE attribution to global warming, a claimed “seasonal heartbeat” fingerprint. But if you examine Santer’s own graphs in that paper, he actually refutes his own earlier tropical tropospheric hotspot claims. #tangledwebs
I have access and just looked through the figures. Not sure what you’re claiming, could you be more specific? Do you mean Figure 2?
Geoff, you say “The greenhouse effect is radiative, so primarily warms by increasing downwelling longwave (and reducing energy loss to space). Many mechanisms influence the vertical distribution of warmth (lapse rate). Apparently, “in the tropics, moist thermodynamic processes amplify surface warming”, so it is about the modeling of these “moist thermodynamic processes” i.e. convection and evaporative heat transfer, not the greenhouse effect.“.
Not exactly. The increasing downwelling longwave can’t just come from nowhere. It has to come from somewhere (the tropical troposphere) that has warmed more than the place it is going to (the surface). Without a difference developing between the source and the target, there can be no net change in long wave radiation. It all has to start with the greenhouse effect. That’s why no TT hotspot means no CAGW.
Aside from the fact that this is an inaccurate description of TT hotspot in the first place (it’s not “atmosphere must be hotter than surface”… the troposphere decreases in temperature with height and is generally colder than the surface), the idea that the atmosphere has to be warmer than the ground for the GHE to work is part of the “GHE violates 2nd Law” yarn.
Even Dr. Spencer here has tried to put a stake through that one, but it’s clearly pretty indestructible at least in some circles. It’s analogous to saying insulation in your walls doesn’t keep your bedroom warm unless it is heated to be warmer than room temp. As an experiment, try opening all your windows in winter, to see if warmth from unheated insulation is a fiction.
Greenhouse gases enable a parcel of air to both heat and cool itself, and there is a ton of convection and latent heat transfer gong on, so it is all far more complex than you are suggesting. Better to start with the statements of textbooks, atmospheric physicists, and scientists like Christy until pointed to convincing evidence otherwise.
Mike Jonas:
“Not exactly. The increasing downwelling longwave can’t just come from nowhere.”
It comes from the surface and the CO2 in the air between the surface and the measurement point.
If seems there is still alive a belief that radiative energy transfer between to “objects” can only take place from the warmer to the colder object. This is simply not so. All objects radiate energy in all directions all the time, whether in larger or smaller amounts, save in very special circumstances such as having energy added below an emission threshold.
Another point apparently missed in many comments, and it is subtle, is that the “hot spot” is not literally “warmer” it is that the temperature in that zone is rising three times faster than the surface warms. That is what is meant by “hot spot”. The models all have that zone 8-16 km above the surface warming at a faster rate, not to a high temperature than the surface.
Consider how difficult that would be to prove, even if it was true. If the surface didn’t warm for 17 years, then three times nothing is nothing. If the surface warms at 1 deg per century, then the hot spot should warm on average at 3 deg per century. Good luck measuring that, on average, over 20 years. It’s hopeless with the tiny warming rate that prevails at this time.
Remember Gavin saying 2015 was 0.001 deg warmer than 2014? That means the hot spot is supposed to show 0.003 degrees of increase. However even if it was, proving it is hopeless, as the “hottest evah” number was based on some supposedly found deep ocean heat, not actual air temperature increases. The hot spot is not expected to be warming at a rate three times that of the deep ocean on an energy content basis (enthalpy).
The supposed hot spot is a hot crock cooked up by badly programmed general circulation models. It is not detectable. If it is not detectable then it is not real as far as science is concerned. It remains a hypothesized effect yet to be demonstrated as real.
Just like the rest of CliSci: Speculation.
“three times faster”
Charts I’ve seen make it look more like two times faster? Just curious. E.g. Figure 1 here for 79-05, surface ~0.14K/decade, peak amplification at that height ~0.28K/decade.
https://www.researchgate.net/publication/232794223_Atmospheric_science_The_answer_is_blowing_in_the_wind
“Consider how difficult that would be to prove, even if it was true”
You feed models the actually observed forcings, ENSO trends (or select models which selected the right ENSO phases, if not parameterized) and see what they say should have happened, then compare it to measurements.
“If the surface didn’t warm for 17 years, then three times nothing is nothing.”
What’s the problem exactlyl? Yes, if there was no warming, there would be a bigger issue to resolve. Of course, on the real surface and in the real troposphere there has been warming, as Spencer notes above.
“It’s hopeless with the tiny warming rate that prevails at this time.”
Spencer cites 0.17 to 0.24. Doesn’t seem like anything immeasurably tiny about it.
I think the problem (and topic of discussion) is just that the measurements are all over the place.
“Remember Gavin saying 2015 was 0.001 deg warmer than 2014”
Indeed doing this comparison on a one year to one year basis would be a waste of time. The actual comparisons are all looking at trends over a couple of decades at least, where you have clearer warming signals.
Mike Jonas wrote, “The increasing downwelling longwave… has to come from somewhere (the tropical troposphere) that has warmed more than the place it is going to (the surface). Without a difference developing between the source and the target, there can be no net change in long wave radiation.”
That’s completely wrong (and Crispin & Geoff are right).
The emitter of longwave IR radiation (in this case, radiatively active gases in the atmosphere) does not know or care what the temperature is of the surface that will absorb that radiation.
The absorber of that radiation does not know or care whether the emitter is warmer or colder than itself.
The reason the net heat flow between two adjacent objects is from warmer to cooler is not that the warmer can’t absorb radiation from the cooler. Each object absorbs radiation from the other. But the warmer object emits radiation more rapidly than the cooler one does, so the rate of energy transfer from warmer object to cooler object is greater than the rate in the other direction.
Have you been reading the Skydragon Slayer and/or Principia-Scientific crackpottery? Don’t do that! They tell lies. Reading their rubbish is, best case, a waste of your time (if you see through the lies). Worst case, they will convince you of things that are untrue (and that will make you look foolish when you repeat them).
I agree, this is wordy BS.
The “enhanced” greenhouse effect is based on water vapor amplification which inevitably must result in a reduced lapse rate and hence a “hotspot”. No hot-spot = no amplification.
The only possible way around this would be to suppose that condensation has somehow shifted downwards and become more efficient, actually making the middle-upper troposphere drier than it was before.
First, you’re not offering a reason to reject Santer’s comparison of RSS to models. I can see arguing that the picture isn’t “clear” (because troposphere measurements are generally a mess), but RSS matching models at least suggests a more complicated situation than you’re asserting, speaking skeptically.
Your physics sounds confounded as well. The argument isn’t that there is no water vapor in the troposphere, it is that models are not capturing troposphere convection and lapse rate correctly. If anything, it is about the models not capturing (the smaller) *negative* lapse rate feedback correctly, not modeling of the larger positive water vapor feedback (which is GHE based). Conveying more warmth higher in the troposphere improves emission to space. It doesn’t amplify warming by heating the atmosphere which heats the surface.
Simply put, it is the additional (delta) IR heat radiation reflected to the surface that drives some small surface warming. No hotspot, no delta. No delta, no additional GHE surface warming. No delta, UN IPCC climate models are bunk.
I thought this must be a typo: “in the tropics, moist thermodynamic processes amplify surface warming”. I thought it should be: “in the tropics, moist thermodynamic processes attenuate surface warming”. But I see that it’s a direct quote from Santer et al 2016.
It seems backwards. Isn’t “moist thermodynamic processes” a fancy way of saying “evaporative cooling” of the surface? What am I missing?
Evaporative cooling should increase with higher temperatures, because warmer water evaporates more readily, accelerating the water cycle.
The water cycle is a classic phase-change refrigeration cycle, just like the Freon refrigeration cycle in your refrigerator: Water evaporates at the surface, absorbing “Heat Of Evaporation” (evaporative heat loss). Because the molecular weight of water vapor molecules is just 18 (compared to 28 for nitrogen), moist air is lighter than dry air (contrary to intuition). So the moist air rises to the mid-troposphere, where the water condenses into clouds, releasing the “latent heat” which it had absorbed at the surface.
This process is the most important way in which heat is removed from surface of the Earth. Warmer temperatures should increase the rate of evaporation, and thereby increase the rate at which heat is transported away from the surface: a negative feedback. That decreases the surface temperature changes which result from other forcings.
The importance this feedback is demonstrated by the dramatically lower diurnal temperature swings in humid climates, compared to deserts.
Santer’s phrase “amplify surface warming” is in the context of “in the troposphere”. By default, the troposphere warms with the surface, but the latent heat transfer amplifies this in the troposphere. Yes, my layman’s understanding is like yours – that this is about hydrology / water cycle.
“Attenuates” surface warming seems true to the degree that this results in the negative lapse rate feedback – warmth conveyed higher faster emits to space more quickly so there is actual slowing of surface warming. Of course, there is also more energy in DWIR so the net effect of the water vapor is to speed surface warming up.
While this assertion is basically correct, there are important caveats that should be noted. The downwelling LWIR doesn’t warm the surface in the strict thermodynamic sense; it merely reduces the energy loss to space AT THE GHG-ABSORPTION FREQUENCIES. But GHGs shed their absorbed energy more through molecular collisions with bulk atmospheric constituents than through re-radiation. It’s the “inert” bulk constituents that wind up storing the transferred energy–and radiating it much less efficiently in the FAR infrared. That’s what raises the temperature in the system.
On the other hand, Santer et al.’s claim that :
is contradicted both by physical theory and observation. Evaporation invariably COOLS the surface and, on our oceanic planet, demonstrably transfers more heat through moist convection to the atmosphere than ALL other mechanisms combined. The quaint notion of “positive water-vapor feedback” is a grossly inept misconception.
“It’s the “inert” bulk constituents that wind up storing the transferred energy–and radiating it much less efficiently in the FAR infrared. That’s what raises the temperature in the system”
I don’t think this is accurate – I think you are reasserting the original, incorrect claim. The bulk constituents also heat up the GHGs among them, which radiate energy away in the *same* wavelengths. The net downwelling infrared has an insulating effect at the surface, and this is what raises the planetary temperature over time (until it can radiate enough to get closer to radiative equilibrium with space.)
“Evaporation invariably COOLS the surface”
Another person had the same reaction – I don’t think you are disagreeing with Santer. His comment about “amplifying” warming was in the context of the troposphere. *Troposphere* warming is amplified by latent heat transfer, as you say.
“The quaint notion of “positive water-vapor feedback” is a grossly inept misconception”
You are confusing lapse rate and water vapor radiative feedback. They are two separate things, and you are pretending one of them doesn’t exist – the one that happens to have the much stronger net radiative effect. Water vapor is a greenhouse gas. See first paragraph above.
There’s little indication of any realistic understanding of the underlying physics here.
There is no “net downwelling infrared;” the net LWIR is decidedly upwelling and the “insulating effect at the surface” is simply an inhibition of radiative cooling through the mechanism that I accurately describe. Likewise, there is no heating of GHG by bulk constituents. The collisional discharge of excited states of GHGs is always in the opposite direction. Finally, I make no reference to any lapse rate, but dismiss the “positive water-vapor feedback” as a fundamental misconception that those totally unschooled in system analysis frequently resort to.
UAH shows the least bias. Case closed.
Spencer’s claim rests mostly on the comparison with IGRA. I hadn’t heard of that data set, being more familiar with RATPAC which is maintained for climate studies meaning consistent comparisons over time/decades (“Radiosonde Atmospheric Temperature Products for Assessing Climate”.)
I looked up IGRA, and from the NCDC page:
“Recommended Uses and Limitations
IGRA is useful as input to air pollution models, for studies of the detailed vertical structure of the troposphere and lower stratosphere, for assessing the atmospheric conditions during a particular meteorological event, and for many other analyses and operational applications. NCEI scientists have applied a comprehensive set of quality control procedures to the data to remove gross errors. However, they did not attempt to remove jumps and other discontinuities caused by changes in instrumentation, observing practice, or station location. Users studying long-term trends may wish to use the NOAA Radiosonde Atmospheric Temperature Products for Assessing Climate (RATPAC) or one of the available non-NOAA IGRA-derived, homogeneity-adjusted radiosonde datasets.”
So this seems another case of critics rejecting mainstream data sets and measurements in order to rest arguments on a data set that is stated not to be suited for comparisons over time. In this case due to “jumps and other discontinuities caused by changes in instrumentation, observing practice, or station location”.
It’s similar with the NVAP water vapor data set used to claim no water vapor rise, and the ISCCP data set used to claim that clouds have been declining over time and are the cause of global warming (though both those ideas contradict assertions that ECS must be very low due to negative cloud feedback… issues with internal consistency are another topic). Those data sets also disagree with other measurements, and the researchers who curate the data say they are not fit for the applications critics use them for, but hundreds or thousands of blog articles repeat claims about them without mentioning any of this.
Dr. Spencer’s paper does include a comparison to RATPAC, but it looks like only through 2002. Commenters in this article:
https://tamino.wordpress.com/2016/11/27/which-satellite-data/
discuss a growing cooling bias of UAHv6 relative to weather balloon data in RATPAC (designed for climate comparisons) happening in the AMSU era *after* 2000. So it is disappointing that Dr. Spencer’s paper only does this comparison through 2002.
Seems to underscore that “UAH shows the least bias. Case closed.” deserves a bit of skepticism. And potentially puts Denning’s “Don’t be conned” warming in a more sympathetic light.
If Dr. Spencer has any comments on any of this it would be great to hear them.
thanks
Geoff
“Their calculations do not agree with the vast bulk of data from real thermometers, towers, aircraft, balloons, and satellites. They have repeatedly been forced to apologize for their errors, and will again and again in the future.”
Why is it that so many climate scientists (1) place such a high value on agreement; and (2) claim to know what will happen in the future?
I think the answer to (1) is logic. The scientific method is basically operationalized logic, based on the notion that the *only* way to *confidently* differentiate what is true vs. what is false is to look for independent reproducibility of results. Meaning different people can repeat the same experiment or make the same calculation and come to a consistent answer. “Agreement” is one word that is used for this; it is central to science.
I think the answer to (2) is physics. There are fixed laws of physics, and as a result for some sets of physical problems consequences of changes can be predicted. Think of Halley’s prediction of a comet’s return to the sky. In climate, the successful prediction of warming for the last four decades hinges mainly on conservation of energy – more energy entering the system from space than leaving.
I’m pretty wordless. Agreement was not here so much between measurement but on the confirmation bias. And yes, when you’ biased, your predictions become biased.
The question is how the bad satellite data may trump the good data, and why it s not shwing up in error margin.
NOAA-14 is claimed here to be the outlier.
Denning’s comment was about comparing UAH to other measurements – the other satellite estimates, and things like weather balloons, where all the analysis I’ve seen says UAH shows growing cool bias relative to RATPAC in the AMSU era. See my longer comment above.
Choosing UAH because it is an outlier relative to other data in the direction you prefer actually is “confirmation bias”. Dr. Spencer obviously disagrees with you on this point as well, since his entire article above was about looking for agreement between UAH and other data sources (but his choice of IGRA without explaining why he is ignoring NOAA’s statements that the data is useless for this purpose is not very convincing.)
NOAA-14 is Spencer’s hypothesis why UAH is right and the others wrong – he’s just not making his case that UAH is right and all the others wrong. Why does UAH show growing cool bias relative to weather balloons since 2000, as well as to the other satellite data sets?
“Why does UAH show growing cool bias relative to weather balloons since 2000, as well as to the other satellite data sets?”
Indeed ….
Vs….
The changes RSS made to minimise the error in V4.0
If only physics could account for turbulent flow and the prediction of non-linear chaotic systems…
Statistical prediction of chaotic systems is quite possible. There are obviously many trivial examples (the accurate-enough prediction of projectile trajectory through a turbulent atmosphere.) Turbulent boiling of air and water doesn’t defeat conservation of energy when more energy is coming in than leaving.
If chaos dominates over energy budget, why do we consistently see warmer summers each and every year due to energy in ramping up? Where are the chaotic/random summers that are colder than winters for the Northern Hemisphere? (Yes, I’m sure you’ll find some tropical location that did, going local vs. global is always a desperation move to prop up the weather vs. climate argument.)
But we don’t have to rehash the whole chaos conversation here, it is off topic.
The topic is, as always: Are UN IPCC climate models and the rest of the CliSci output sufficient to justify the fundamental change of our society, economy and energy systems?
Socialamismo O Muerto!
Having nothing to do with the climate models and long term projections, that is just a non-sequitur.
Even the IPCC recognizes the problem.
Please.
“why do we consistently see warmer summers each and every year ”
We do?
What nonsense you speak.
First, if you truly believed that “independent reproducibility” is what is important to the scientific method, you should have been one of the first to criticize Scott Denning’s cavalier disparagement of the UAH temperature series, purely on the basis that the independent way in which Spencer measures temperatures don’t fall in line with ways that other scientists measure temperatures. Scott Denning is using “agreement” as a weapon to stifle conflicting evidence on a scientific matter that cannot be objectively proven, one way or another, and you defend it with a sophomoric argument that “agreement” is central to science.
Agreement is not central to science. The word “agreement” (like the word “consensus”) is just an obtuse expression for a group opinion, and real scientists recognize that opinions are poisonous to the scientific process; the very reason for double blind studies and controlled experiments is to do everything possible to shelter the scientific process from any opinion or “agreement.” The fact that scientists may temporarily agree on something that has otherwise been scientifically shown as being likely true does not make that agreement part of, or central to, the scientific process.
Second, I’d like you to explain the physics Scott Denning used to make his prediction that Spencer and his colleagues will be “forced to apologize for their errors . . . again and again in the future.” Also, I couldn’t help but notice that you referred to “the successful prediction of warming for the last four decades” without at all mentioning any individual prediction, or any numbers or quantification associated with your predicted warming. Why is that?
Second
“you defend it with a sophomoric argument that “agreement” is central to science”
The commenter here stated “Why is it that so many climate scientists (1) place such a high value on agreement” and I simply offered an answer. Spencer clearly appears to agree with my point – his post is about evaluating agreement between different data sets.
“shelter the scientific process from any opinion or “agreement.””
You are confusing agreement among observation and experiment results with opinion.
“I’d like you to explain the physics Scott Denning used to make his prediction”
Denning is sharing an opinion based on history appearing to repeat itself – i.e. ongoing issues with re-adjusted UAH disagreeing with other data sets such as apparent growing cool bias relative to RATPAC in the post 2000 timeframe.
If you’d like to have a more substantial scientific conversation, as you imply, you have to get into that level of detail. Spencer gives an example of a possible line of argument above (but doesn’t appear to address the post-2000 RATPAC issue, comparing instead to IGRA without justification/transparency about the apparent problems with doing so.)
“without justification/transparency about the apparent problems with doing so”
(For the record – I now see I am wrong here, Spencer does discuss discontinuities in IGRA and that’s what the “adjusted IGRA” discussion is about. My mistake.)
“the *only* way to *confidently* differentiate what is true vs. what is false is to look for independent reproducibility of results. Meaning different people can repeat the same experiment or make the same calculation and come to a consistent answer. “Agreement” is one word that is used for this; it is central to science.”
_______________________________________________
– what is this holy one experiment “different people” should do to come “to a consistent answer”.
– what is this holy one calculation “different people” should do to come “to a consistent answer”.
– how many “different people” ever did this experiment or this same calculation – and came to confident reproducible answers.
_______________________________________________
– reproducing a calculation on a trusty calculating device doesn’t say anything about the performed formula or algorithm.
– reproducing an experiment just says the experiment was performed under similar / same conditions following similar / procedures. Nothing about the experiment itself.
_______________________________________________
These are just simple prerequisites: training for the real thing.
“what is this holy one experiment”
There is nothing in my comment about “one” experiment. The general principle behind experimentation is that different individuals should be able to perform it to try to confirm the results.
“reproducing a calculation on a trusty calculating device doesn’t say anything about the performed formula or algorithm”
But it does say other necessary things, like confirm that an individual doing a calculation (or programming an algorithm to do so) hasn’t made a mistake – or worse, rigged it.
“reproducing an experiment just says the experiment was performed under similar / same conditions following similar / procedures. Nothing about the experiment itself”
When people use phrases like this they generally mean that the *results* of the experiment are reproducible. For example, it consistently confirms or contradicts a hypothesis.
The answer to (1) is that scientists are human and therefore, subject to errors in reasoning just like everyone else. It’s human nature to believe that one is correct in one’s assumptions; how much more so when one is ostensibly a trained scientist?
To exacerbate the problem, in today’s scientific community empirically verifiable evidentiary results seem to be going out of style in favor of computer modeling. Sometimes it can’t be helped, but modeled results aren’t necessarily the best results. Nevertheless, the faith in them could move mountains.
You can see this methodological error in Geoff’s answer to you above. He argues:
I think the answer to (1) is logic.
The consistent reproducibility of empirically verifiable results supersedes and therefore has nothing whatsoever to do with logic. Whatever logic is (or is not, as the case may be) applied to any hypothesis is done at the hypothesis stage. Once you reach the laboratory stage and begin testing your hypothesis there, logic is no longer necessary. Now all that matters are the results of your experiment. For example, there is no logic employed when a scientist combines hydrogen and oxygen to produce water. Rather, the combo produces what it produces, and does so regardless of whether or not such a combination is logical.
Geoff further argues:
The scientific method is basically operationalized logic, based on the notion that the *only* way to *confidently* differentiate what is true vs. what is false is to look for independent reproducibility of results.
This proposition contradicts itself and thus should be rejected as false.
Operationalization is a method that’s employed when empirical results of a phenomenon aren’t directly measurable. Thus, “operationalized logic” is used in the social sciences, psychology, life sciences, metaphysics, etc. It’s the last one that has many believing what they believe by faith. Some physics is metaphysics and can’t be done other than with “operationalized logic,” however, it doesn’t follow from this that the method is the scientific method. The scientific method is defined as “consisting in systematic observation, measurement, and experiment, and the formulation, testing, and modification of hypotheses.” “Operationalized logic” presupposes one’s evidence is not verifiable (measurable), hence by default that “evidence” is not empirical and therefore, the two methods contradict each other.
Geoff concludes:
“Agreement” is one word that is used for this; it is central to science.
On the contrary, “agreement” isn’t central to science at all, rather it’s anathema to real science. Without verifiable evidence, agreement in science is useless for any practical purpose. George Washington died the day he did because there was consensus among the finest medical science of the day that blood letting was a practical cure for what ailed him. Instead it killed him. If agreement were central to science, then there’d be no advancement in science! Nay rather, it would seem exactly the reverse is true, i.e., that disagreement is central to pure science.
For a great primer on consensus and it’s dangers, see this article:
https://wattsupwiththat.com/2018/12/23/oreskes-harvard-and-the-destruction-of-scientific-revolutions/
The answer to (2) is pretty much the same as (1), i.e., arrogance, but those that believe they can predict the future contradict the IPCC’s own statement on that subject. From TAR 14 (771):
“The climate system is a coupled non-linear chaotic system, and therefore the long-term prediction of future climate states is not possible. Rather the focus must be upon the prediction of the probability distribution of the system’s future possible states by the generation of ensembles of model solutions.
Addressing adequately the statistical nature of climate is computationally intensive and requires the application of new methods of model diagnosis, but such statistical information is essential.”
Great summation of the CliSci method, sy: “We can’t scientifically predict, but we will use multiple models, all based on our predictions, and statistically prove to ourselves what we predicted.”
Circular reasoning is manifest in the CliSci papers I’ve reviewed. Especially bad are UN IPCC and U.S. Assessments.
When the UN IPCC opines on the worth of socialism and social justice dictates, if further devolves into propaganda. ‘Sustainable development’ is a prescription to end economic and technical development.
Armchair internet experts saying “the scientists don’t know nuthin'” are wrong 99.9% of the time whenever I have taken the time to give their claims some skeptical questioning. You do a good job of not making any claims though. 🙂
I’m sure that imagining you are more of an expert has a certain enjoyment to it.
I don’t “imagine” anything, Geoff. I have an engineering and scientific education and had work experiences in electric power systems’ development and O&M, environmental analyses and remediation, manufacture of nuclear weapons and the shoveling of rabbit shit. I’ve held increasingly responsible positions, and wound up as CEO/GM of an electric power utility.
I participated in the development of many and various technical and financial studies. I have critically reviewed many more of such studies, and decided upon and directed significant and costly activities based on those studies.
What do you have, Geoff?
The only objective measurement of our understanding of any physical system are the uses that we make of that understanding. This is undeniably true. If, for all your study of a physical system, you can’t use that knowledge to make something that works as intended (like a vaccine, a drug, a microprocessor, a nuclear bomb, etc.) or predict something dependably (like the time, place, or length of a solar eclipse) you can’t claim to truly understand that system at all. In other words, the practical application of your asserted knowledge of a system is what separates what you actually know about the system from what you only think you know about the system.
So when these “armchair Internet experts” that you denigrate say “‘the [climate] scientists don’t know nuthin,'” it seems to me that they are absolutely right. Climate scientists don’t really know anything at all – they just think they know it. Climate scientists have no actual, reliable performance to demonstrate – unless you think publishing mere words in the dusty pages of some peer-reviewed journal counts as performance. And I suppose for an academic, that does count as performance since it’s what brings the grant money in and pays the bills. But outside the ivory towers of academia, words are cheap. It’s time they stopped telling the public what they think they know, and instead concentrate on showing us what they can do.
““Operationalized logic” presupposes one’s evidence is not verifiable (measurable), hence by default that “evidence” is not empirical and therefore, the two methods contradict each other”
You seem to be misinterpreting my phrase, or otherwise are confused. My comment was just meant to say – scientific method is building a logical procedure for describing what is true or false. Overall, your argument is logically circular – you assert that climate science is not rooted in empirical validation and use that to prove that climate science is non-scientific, because it is not rooted in empirical validation. You overlook the fact that “evidentiary results seem to be going out of style in favor of computer modeling” is just your repetition of anti-science lore, not a meaningful truth.
““agreement” isn’t central to science at all, rather it’s anathema to real science”
And here you are again playing semantic games, redefining “agreement” between empirical observations as agreement between opinions.
“Without verifiable evidence”
Independent reproducibility is *exactly* what verifying evidence is! My God.
“For a great primer on consensus”
Learn to read in context.
Learn to read in context.
There, there, Geoff, no need to get all “ad hominally” testy and such. I appreciate you confirming my criticism of your position, but you really didn’t have to.
So you made a logical mess with a False Equivalence, no biggie! Happens to everyone.
Or at least . . . you. 🙂
Take care!
You simply mistook “agreement” about observations as meaning “agreement” among opinions (consensus). Misunderstanding happens (though perhaps more frequently if you are preoccupied with certain lines of argument.)
Thanks for the response.
“And here you are again playing semantic games, redefining “agreement” between empirical observations as agreement between opinions.”
No, you’re the one playing semantic games. Here’s the original quote from Denning: “Their calculations do not agree with the vast bulk of data from real thermometers, towers, aircraft, balloons, and satellites.”
First, note the phrase “vast bulk of” and ask yourself what he means by that. This seems to imply that there is at least some data that UAH agrees with, and it sure as hell means that he’s inserting his opinion into the statement, unless you think “vast bulk of” is a scientifically defined unit in the Handbook of Chemistry and Physics. And what does he mean by a “real” thermometer? Why are air temperatures measured by the expansion of mercury in a tube placed on an asphalt parking lot, or next to an air conditioner for example, inherently more reliable than measuring air temperatures by EM signals bounced off air layers from a satellite? All these data sets have to be massaged to get a set of numbers that the data collectors merely think is an accurate representation of a temperature series.
In truth, none of these temperature sets agree with each other, and they would not be expected to since all of them measure different things, using different procedures. Since they are all expressed in anomalies, any “agreement” has to be an agreement in the trends, thus the degree to which one data set “agrees” or “disagrees” with another will change depending on which period of time you look at, and how loose your definition of “agreement” is. In fact, as the post says, from January 2003 through December 2017 GISSTEMP and AIRS were the outliers and UAH was in the middle of the remaining pack. And as Spencer also points out, the UAH temperatures match more closely with the balloon set than the other satellite data sets. So don’t pretend that Denning’s statement is somehow purified of opinion; to the contrary, it reflected only his opinion.
In defense of that pure opinion, to try to represent it as somehow scientific, you pull a bait-and-switch. You first describe a scenario where someone performs a controlled experiment, publishes the procedures and results, and others repeatedly try to reproduce those results by using the exact same procedures. You then say that, because the scientific method relies upon this type of reproducibility, that “agreement” is “central to science.” You finally take the word “agreement” completely out of the context in which you just described it, to conclude that Denning’s arbitrary conclusion – that one temperature data set, among many others, should be ignored because in his opinion it didn’t sufficiently “agree” with the ones he preferred – was somehow scientific.
“No, you’re the one playing semantic games. Here’s the original quote from Denning … the UAH temperatures match more closely with the balloon set than the other satellite data sets”
Obviously you are not actually disagreeing with my general point – that agreement in results is important. Here you are arguing that it is relevant (“match closely”), just as Spencer does. You just disagree with Denning about what comparisons among the data sets indicate.
The question is whether Spencer makes his case. Reading his paper more closely, I see he refers to an adjusted version of the IGRA data set. My error in missing that before. So the open question would boil down to comparisons of this adjusted IGRA data and RATPAC which is otherwise “the balloon set” recommended for climatological (multi-decade) comparisons (UAHv6 shows a growing divergence from RATPAC, i.e. does NOT match more closely with it, whereas RSS and the other data sets do not.)
What do they do with AMSU data when they disagree with MSU data? Discard them?
They adjust the AMSU data, according to the implications of Dr. Spencer’s discussion, icisl: “Since NOAA-14 [MSU] was warming significantly relative to NOAA-15 [AMSU], this puts a stronger warming trend into their [the other 3] satellite datasets [that refuse to delete NOAA-14’s erroneous readings], raising the temperature of all subsequent satellites’ measurements after about 2000.”
The same as for ARGO adjustments.
So they homogenize AMSU data with MSU data? How can any rational scientist consider two data sets that disagree with each to be equally accurate?
“… RSS, NOAA, and UW continue to use all of the NOAA-14 data through its entire lifetime and treat it as just as accurate as NOAA-15 AMSU data.”
“… raising the temperature of all subsequent satellites’ measurements after about 2000.” sounds like a lot more than homogenization to me, icisil.
Roy or CTM
“is too short to say much of anything much of value about global warming trends, “….Too much much’s ?
It’s much of a muchness…
Muchly.
Based on the forgoing, for mitigation planning purposes, we should expect that in the next 50 years we’ll experience 1 deg.C plus or minus 0.25 C. of warming. In 2022, or so, if we stop contaminating our landscapes with ugly worthless wind towers and solar panels and instead begin phasing in NuScale SMR’s we can significantly reduce the “fossil fuel” component of warming. In 2042, or so, when Molten Salt Reactors finally receive regulatory approval we can deploy and operate the perfected and proven technology. Achieving full zero carbon energy use by 2100 is economically and technically doable. The key step forward is to stop the economic destruction from solar, wind and bio-fuels and move onto a sensible, sustainable nuclear future. (fifty years later than we should have…I don’t know where we’ll get the beneficial CO2 increases from but let future generations worry about that)!
Dennis – I agree with you that grid-connected wind and solar power schemes are costly and counterproductive, primarily because of intermittency and the absence of practical grid-scale storage.
You wrote above:
“Based on the forgoing, for mitigation planning purposes, we should expect that in the next 50 years we’ll experience 1 deg.C plus or minus 0.25 C. of warming.”
I wrote in an article published 1Sept2002 in the Calgary Herald:
“If [as we believe] solar activity is the main driver of surface temperature rather than CO2, we should begin the next cooling period by 2020 to 2030.”
My (our) now-imminent global cooling prediction predates Theodor Landscheidt’s 2003 paper. I’d be happy to be wrong about that cooling prediction, but it’s looking pretty good, based on the crash in solar activity in Solar Cycle 24 – the lowest since the Dalton Minimum (circa 1800).
NEW LITTLE ICE AGE INSTEAD OF GLOBAL WARMING?
Theodor Landscheidt, First Published May 1, 2003
https://doi.org/10.1260/095830503765184646
I will stand with this prediction – for moderate, natural cooling, similar to that which occurred from ~1940 to the Great Pacific Climate Shift of 1977, despite increasing atmospheric CO2. As stated previously, I hope to be wrong, because humanity and the environment suffer during cold periods.
I suspect the proponents of AGW are doing everything they can do to drag this out long enough to take credit for reversing the “warming” trend when temps reverse course.
Allen Macrae, Thanks for reading my posting and commenting. A note worthy addendum to my 1 deg C plus or minus 0.25 deg C would be “or the same amount of cooling.” Wringing our hands about a 1.5 deg C temperature change by 2100 is pointless. The environment and economic problem is that everything we’ve done (USA) since the 1973 & 1978 crude oil price increases has been wrong. The proper response would have been to incentivize domestic hydrocarbon fuel production and nuclear. Instead we’ve given our energy intensive industries to China, sent $trillions to the Middle East for oil, over-regulated nuclear to death, and ravaged our countryside with endless corn fields for ethanol and ugly worthless wind towers and solar panels for virtue signaling. Thanks for nothing liberals and RHINO’s. Let’s finally get together on a plan of action that actually is good for the environment and the economy. Why not? We’ve tried everything else!
Agreed Dennis, and more:
My recent article explains why this is happening:
“Hypothesis: Radical Greens are the Great Killers of Our Age” is published at
https://wattsupwiththat.com/2019/04/14/hypothesis-radical-greens-are-the-great-killers-of-our-age/
Allan Macrae,
Nice to see someone else on the same page about how economically and environmentally damaging bio-fuels, wind and solar have been these past 30 years. The good news is Germany, in 2019, is finally experiencing what renewable provides after about 30% grid penetration (5% substitution factor for conventional power). Germany with their brilliant and talented engineers may get this factor up to 10% considering the availability of nuclear power from France and hydro power from Norway/Sweden. But why? I’m most likely wrong, but I still maintain that Germany will be restarting their nukes in about three years (instead of installing turbines powered with Russian gas). Doing so would earn Germany the recognition they already have as leading the way to the future of power generation.
Allan Macrae
The fact is that, according to Roy Spencer’s UAH LT data set, global temperatures have *increased* at a rate of +0.3 deg C per decade since solar cycle 24 ‘crashed’ onto the scene in Dec 2008. Doesn’t that give you pause for thought?
You ‘stand by’ this prediction but continually ignore requests for your thoughts on why your previous prediction failed. Writing in ICECAP in 2008, after rashly proclaiming that “[s]ince just January 2007, the world has cooled so much that ALL the global warming over the past three decades has disappeared!” on the basis of 18 months La Nina cooling and the questionable use of a high order polynomial trend, you went on to say:
http://icecap.us/index.php/go/joes-blog/is_this_the_beginning_of_global_cooling/
Well, here we are into the second decade of that “several decades” period and the global temperature trend since 2007 is, according to UAH LT, +0.37 C per decade *warming*.
With you, Allan, it seems it’s not so much the old clairvoyants’ trick of ‘make them count the hits and not the misses’; it’s more a case of ‘make them ignore the misses and count the (future possible) hits’.
Hi DWR54 the “Slippery One”:
We’ve been over this before – it did get colder for several years starting in the early 2000s, but then the PDO returned to warm mode circa 2014.’
https://wattsupwiththat.com/2018/04/15/getting-the-publics-attention-on-global-warming-the-final-challenge/comment-page-1/#comment-2792396
DWR54 aka WD40:
Our 2002 prediction was for global cooling to commence by ~2020-2030 – that is still looking good.
NASA called the shift into a PDO cool phase in 2008. It was cold for a few years and then the PDO turned positive again.
If a global cooling period does materialize as we predicted in 2002, people will be arguing for decades as to when it started, based on the evidence. Some are already saying that cooling started circa 2005.
http://ds.data.jma.go.jp/tcc/tcc/products/elnino/decadal/pdo.html
“The Pacific Decadal Oscillation (PDO) index value for 2016 (annual mean) was +1.3. Negative values were generally observed from around 2000 to the early 2010s, and positive values have been recorded since 2014.”
Hi Allan,
If the PDO can apparently ‘turn on a dime’ like that then would you agree that it’s a little incautious to predict “several decades” of climatic change based upon its moods? Seems it’s a pretty unreliable metric for forecasting long term trends.
Following the logic of your second statement quoted above, how will you *know* whether a cool period has started ~2020-2030 or not? It leaves you breathing space to say ‘well, it has already started but we just aren’t seeing it yet’, etc…
What evidence would dis-confirm your hypothesis, in your view?
Thanks.
DWR you asked: “What evidence would dis-confirm your hypothesis, in your view?”
Preamble:
First, I assume atmospheric CO2 concentrations will continue to increase, albeit more slowly in a cooling world, and there may be the occasional year-over-year decline, as has happened before.
Annualized Mauna Loa dCO2/dt has “gone negative” a few times in the past (calculating dCO2/dt from monthly data, by taking CO2MonthX (year n+1) minus CO2MonthX (year n) to minimize the seasonal CO2 “sawtooth”.)
These 12-month periods when CO2 decreased are (Year and Month ending in):
1959-8
1963-9
1964-5
1965-1
1965-5
1965-6
1971-4
1974-6
1974-8
1974-9
My answer to your question:
1. If Earth resumes significant global warming, as measured by the UAH Lower Troposphere global temperature average through the decade of the 2020’s then my hypo will be disproved.
2. If Earth resumes significant global cooling, as measured by the UAH Lower Troposphere global temperature average through the decade of the 2020’s then my hypo will be strongly supported.
3. If Earth resumes the global temperature “Pause”, as measured by the UAH Lower Troposphere global temperature average through the decade of the 2020’s then my hypo will be neutral.
Note, however, that in all Cases 1, 2 and 3, unless climate sensitivity exhibits much greater values than the historic MAXIMUM observed value of ~1C/doubling. the catastrophic global warming hypo will continue to be disproved – as it has been disproved to date by all the credible data observations since ~1850 (ref. Christy and McNider 2017, Lewis and Curry 2018).
Climate computer models cited by the IPCC etc employ climate sensitivities that are much higher than 1C/doubling to create false alarm. All the credible data to date strongly disproves the alleged catastrophic global warming crisis. We can conclude now, with a high degree of confidence, that catastrophic global warming is a false crisis.
Allan,
Thanks for your response.
Your 3 points all need a reference start year. There is wide variation in monthly temperatures in the satellite data (both UAH and RSS), much bigger than in the surface data, and this inherent volatility makes it very unlikely that statistically significant warming, or cooling, would occur within the narrow time frame of 2020-2030 *if* the start year also falls within that period.
If you start counting at 2020, say, then by far the most likely outcome would be no statistically significant trend between 2020-2030. Importantly, that would be the case whether there actually was a strong ‘best estimate’ warming or cooling trend within that period. The satellite data sets are simply too variable to make any statistically significant trend within such a short period mathematically likely.
You mentioned previously that some people believed the ‘cooling’ began in 2005. So would you agree to 2005 as the reference start year for this experiment? If a statistically significant warming trend starting at 2005 develops in UAH LT some time within the 2020-2030 period, would you accept that your hypothesis was wrong?
To make it fair, I would be prepared to say that if a statistically significant cooling trend starting at 2005 develops in UAH LT some time within the 2020-2030 period then I would accept that your hypothesis might well be right and that I am wrong.
What do you say?
Allan MacRae wrote:
I don’t think that’s correct, Allan. According to my arithmetic, there’ve been no 12-month periods when the averaged CO2 level measured at Mauna Loa was not greater than over the preceding 12-month period.
My graph of CO2 at Mauna Loa just uses calendar-year averages, but it’s clearly monotonic:
https://sealevel.info/co2.html
Here’s a spreadsheet with the Mauna Loa monthly CO2 measurements (3/1958 thru 2/2019), plus additional columns calculating the year-over-year change for each month, and the 12-month average of those year-over-year changes:
https://sealevel.info/co2_mm_mlo_calcs.xlsx
This is the same thing, exported as a web page:
https://sealevel.info/co2_mm_mlo_calcs.htm
You can see that the final column is always positive.
Note that there are a few missing months in the measurement data (“-99.99” in column D in the spreadsheet). That might be messing up your calculations. Column E interpolates to fill in those missing values, so that’s what I used for my calculations.
It’s noteworthy that all of the year-over-year decreases in CO2 occurred when the global temperature cooling during the third quarter of the last century was well under way. Another sign of CO2 lagging T, not leading it.
1sky1 wrote, “It’s noteworthy that all of the year-over-year decreases in CO2 occurred when the global temperature cooling during the third quarter of the last century was well under way. Another sign of CO2 lagging T, not leading it.”
Not by my calculations. There were eight individual months (out of 708) which recorded lower CO2 levels than the same month in the previous year. (And additional five months had no reported data.)
8/1959 was 0.13 ppmv lower than 8/1958 (can’t compare 12mo averages because measurements only began 3/1958).
9/1963 was 0.05 ppmv lower than 9/1962, but the 12mo ending 9/1963 averaged 0.52 ppmv higher than the 12mo ending 9/1962.
1/1965 was 0.13 ppmv lower than 1/1964, but the 12mo ending 1/1965 averaged 0.54 ppmv higher than the 12mo ending 1/1964.
5/1965 was 0.09 ppmv lower than 5/1964, but the 12mo ending 5/1965 averaged 0.42 ppmv higher than the 12mo ending 5/1964.
6/1965 was 0.02 ppmv lower than 6/1964, but the 12mo ending 6/1965 averaged 0.39 ppmv higher than the 12mo ending 6/1964.
4/1971 was 0.35 ppmv lower than 4/1970, but the 12mo ending 4/1971 averaged 0.76 ppmv higher than the 12mo ending 4/1970.
8/1974 was 0.19 ppmv lower than 8/1973, but the 12mo ending 8/1974 averaged 1.05 ppmv higher than the 12mo ending 8/1973.
9/1974 was 0.19 ppmv lower than 9/1973, but the 12mo ending 9/1974 averaged 0.82 ppmv higher than the 12mo ending 9/1973.
Of the eight, two each were August and September (3rd quarter), one was January (1st quarter), and one each was April, May & June (2nd quarter).
There was no case in which a 12mo average CO2 level was not higher than the preceding 12mo average CO2 level.
Year-over-changes in monthly data, by definition, are the variations of the ACTUAL difference in monthly values. They don’t involve any smoothing, which can obliterate the intra-annual variability. While reflecting the fact that negative differences have not persisted, Burton’s calculation are off the point made by MacRea and commented by me.
DWR: You asked me to be more precise.
My hypo will be confirmed if there is average global cooling as measured by UAH LT average global temperatures for a decade or more, starting between 2020 and 2030.
If I had to guess, I think global cooling will start close to 2020, but start time is very difficult to predict correctly.
Dave Burton:
I’ve defined what I meant in my above post and my numbers are correct as defined. I did it this way to allow for the seasonal “sawtooth”in the monthly data, also called the Keeling Curve.
You have changed my definition and then objected to my numbers.
Regards, Allan
Allan,
Thanks. That’s just ‘average’ cooling, meaning ‘best estimate’. I see you have dropped the term ‘significant’.
Rgds
DWR:
For global cooling or a Pause to occur, the PDO Index generally must go negative and stay negative for a significant period of time – in the order of a decade or so.
A definition, data and plot of the PDO Index is here.
http://ds.data.jma.go.jp/tcc/tcc/products/elnino/decadal/pdo.html
[excerpt – CAPS are mine]
“Focusing on the decadal variability of the PDO index, values were generally positive (corresponding to a pattern in which SSTs in the central part of the North Pacific are lower than their normals) from the late 1920s to the early 1940s and from the late 1970s to around 2000, and GENERALLY NEGATIVE FROM THE LATE 1940S TO THE MID-1970S AND FROM AROUND 2000 TO THE EARLY 2010S. The annual mean PDO index value has been positive since 2014, while the value approached zero in 2018. Based on suggestions from recent studies that PDO may be a key factor in the global climate system (including Japan’s climate and the acceleration/hiatus of global warming), continuous monitoring of its variability is needed.”
DWR:
As I said above, “If I had to guess, I think global cooling will start close to 2020…”
This plot explains why.
http://woodfortrees.org/plot/pmod/offset:-1360/scale:0.2/plot/hadsst3gl/from:1980/plot/uah6/from:1980
Allan MacRae wrote, “You have changed my definition and then objected to my numbers.”
Not intentionally, I assure you.
You wrote, “These 12-month periods when CO2 decreased are (Year and Month ending in)…”
I think you must have meant the one-month periods (rather than 12-month periods), which had lower Mauna Loa CO2 levels than the corresponding one-month period in the previous year.
My understanding of what you wrote was that the entire “12-month period,” ending with the named date (i.e., CO2 levels averaged over 12 months instead of averaged over one month), was lower than the preceding 12-month period.
That’s not the case for any of the ten months you named.
However, the single month (rather than 12-month) levels were lower then the corresponding month of the previous year, for eight of the ten cases that you cited. (Even that wasn’t the case for 6/1974 and 5/1964.)
Because local ground-level CO2 levels fluctuate considerably, I don’t think a slight dip of only a month or two, at a single location, means anything important.
No worries Dave – no harm.
It is a 12-month period difference, not a 1-month period, as I defined.
Just run the numbers as defined and you will get the same results.
Sorry I don’t have time to worked example for you.
Best, Allan
Zero-carbon electrical power generation. Still not sure we’ll be able to do away with fossil fuels for aircraft.
How about a really long extension cord?
I’m just in awe of your polite and scientific response to an emotional Twitter outburst.
Well done Roy. A lesson we all might learn.
We’ll let Roy be polite first
When he’s done, we’ll beat the climate scaremongers with hockey stick (charts) !
+1000
Hear, hear!
Exactly. I find it is best to never take anything personally especially when it is intended that way …. it just makes them more upset that you can stay reasonable and reply to all their points calmly.
LMAO. Well done Roy!!!
IPCC & WMO define “surface” temperature as 1.5 m above the ground.
Some USCRN sites have actual soil/ground temperatures at several depths.
SURFRAD uses 10′ above ground. (recall it was different, details fuzzy).
What is “surface skin?”
Can’t there be some standard?
BTW USCRN data shows the soil/ground as warmer than “surface” most of the time.
Ground heats/cools slowly. “Surface” air heats/cool rapidly. Air cooler than ground in pm and during the night.
That’s counter to GHE theory.
I found this article difficult to understand. So many different sets of figures
so making it possible to cherry pick.
I would think that the nearest figure to the radio send balloons would be
the one to work with.
MJE VK5ELL
Congress needs to hear about this. They are appropriated money for better technology that they then ignore? I think they need to justify that before Congress.
LOL.
Congress is too stupid to understand there is no Russian collusion, let alone climate modeling errors.
Trying to teach a pig to sing will simply irritate the pig.
Did Russians benefit more form Trump getting elected, or from Hillary greasing the skids to allow the Russians access to US uranium? Which exercise did the Russians spend the most money on? Which event required the direct participation (collusion) of Donald or Hillary? The answers should be obvious. What is less obvious is why Hillary hasn’t been tried for “high crimes!”
Russian meddling began far earlier than Donald Trump’s emergence. Its goal was (still is) to disrupt the U.S. society and political systems, not to elect any particular person. It succeeded grandly and directly led, abetted by Federal Deep State actors and the Democrat Party, to an attempted coup of an elected President. “Resist” is nothing more than attempt to overturn a Federal election.
https://pbs.twimg.com/media/D427CTLUwAAMJ-l?format=jpg
What is this shit, sir?
The tone of Denning’s comment is very similar to a cadre of commenters on Yahoo that attack me every time I post a comment. They are obviously familiar with the literature, but can’t seem to resist the temptation of trying to make it personal. I have come to suspect that there is one (or maybe two) individual using different aliases to make it look like several people disagreeing with me. It is interesting how much he/she/they are emotionally invested in being right and proving skeptics wrong, or at least ‘deplorables.’ I think that there is plenty of material there for the basis of a dissertation for some new PhD in psychiatry.
” It is interesting how much he/she/they are emotionally invested in being right and proving skeptics wrong,”
In order to prove a skeptic wrong one would have to present at least one bit of evidence demonstrating that CAGW is real. I bet none of those Yahoo alarmists can do that, so they can;t be proving skeptics are wrong.
The Yahoo alarmist’s definition of evidence is probably different from ours. It would have to be, otherwise they would be skeptics. 🙂
The tweet makes sense when UAH is viewed in light of society’s need of scapegoats. The search for the guilty in the age of political correctness. Climate science is by no means unique.
https://www.roger-scruton.com/about/radio/559-bbc-radio-4-point-of-view-the-witch-hunt-culture-2-december-19
As an engineer, it is just bizarre that the whole future of the world is apparently wrapped up in what I would call measurement error. 0.07 degrees? There is no way that we are that accurate.
AIRS: +0.24
GISTEMP: +0.22
ECMWF: +0.20
Cowtan & Way: +0.19
UAH LT: +0.18
HadCRUT4: +0.17
Of course, the different values from the different data sets shows that we are not that accurate.
We are talking about something that varies from one day to the next by more than 500 times even at the exact same time of day. Also, the value can differ by over 50 times that error between places just a few yards away or a few minutes in time.
It is truly amazing that we can even measure with a 0.7degree error between data sets.
(Or does everyone just decide to agree with each other?)
No, SocietalNorm, that’s 0.07 degrees; seven-hundredths! A tenth, maybe. A hundredth? There has to be a joke somewhere in here. Significant digits, anyone?
?
I was pointing out it was 7 hundredths (0.07) of a degree difference from the maximum to minimum trends, not the 7 tenths (0.7) you (mistakenly?) wrote.
I meant to also convey the fact that one might reasonably calculate differences to a tenth of a degree, but not to a hundredth of a degree over 10-year periods. I also suggested I believe that everyone involved was ignoring the application of the rule of significant digits when doing statistical manipulations.
If CliSci CAGW depends on measurements/statistical calculations to the 7 hundredths of a degree over a 10-year period, then I suggest that humanity has nothing to worry about for any foreseeable future. Additionally, I especially gag when temperature differences and statistical manipulations (in the vast oceans, no less) are cited to the thousandths of a degree.
Well played Dr. Spencer, rise above the pettiness of social media and come back with science.
I think what Scott Denning and the other former scientists forget is that as science moves forward so do new answers and as always, more questions. Denning and his clan have glued themselves to a political quasi science platform that is stuck in the 90’s and 00’s.
This will be their legacy and when you have the egos of these charlatans their legacy and reputations are all they care about. They did this to themselves when they abandoned the scientific method for their 15 minutes of fame.
What’s going to happen to the alarmists’ datasets when NOAA 14 de-orbits?
They lost contact with it in 2007. The overlap period was 1998-2004. I had the same question about the effect of its loss.
What a professional way to handle this. Present the facts and the reasoning. I thought this method had died long ago.
By the way, your data is the only temperature data I trust anymore.
Does anyone think if the older satellite had a cooling bias in more recent years, that they would be including it?
Thank you!
This is the essence of “climate” pseudo-science. It’s confirmation bias all the way, every day. Every excuse in the book is dreamed up to “adjust” temperatures in a manner that props up the propaganda, and to NOT make adjustments that would run counter to “the cause.”
“Does anyone think if the older satellite had a cooling bias in more recent years, that they would be including it?”
One might ask the same question about the volume of the ocean basins. If it had been shrinking rather than increasing, would the U. of Colo. have adjusted the rate of sea level rise downward to compensate? To ask the question is to know the answer.
Has Scott Denning apologized to Roy yet?
the one that explains why JAXA says that, as of right now, we are gaining sea ice in the arcitc?
Denning… Denning… did someone named Kruger name an “effect” after him?“Hush, Dave! Try to behave!”
-what my mom would have said
Those tweets seem to be gone, now.
Here’s the Zeke Hausfather tweet:
https://twitter.com/hausfath/status/1118604503983374336
But the replies seem to be gone. So perhaps Denning (and @adoolan34) deleted their tweets? Or maybe they’re shadowbanned.
Oops, my bad. Only the @adoolan24 tweet is completely gone. Denning’s is still there, if you click on the link that Dr. Spencer provided:
https://mobile.twitter.com/airscottdenning/status/1118628870641594370
Saved here:
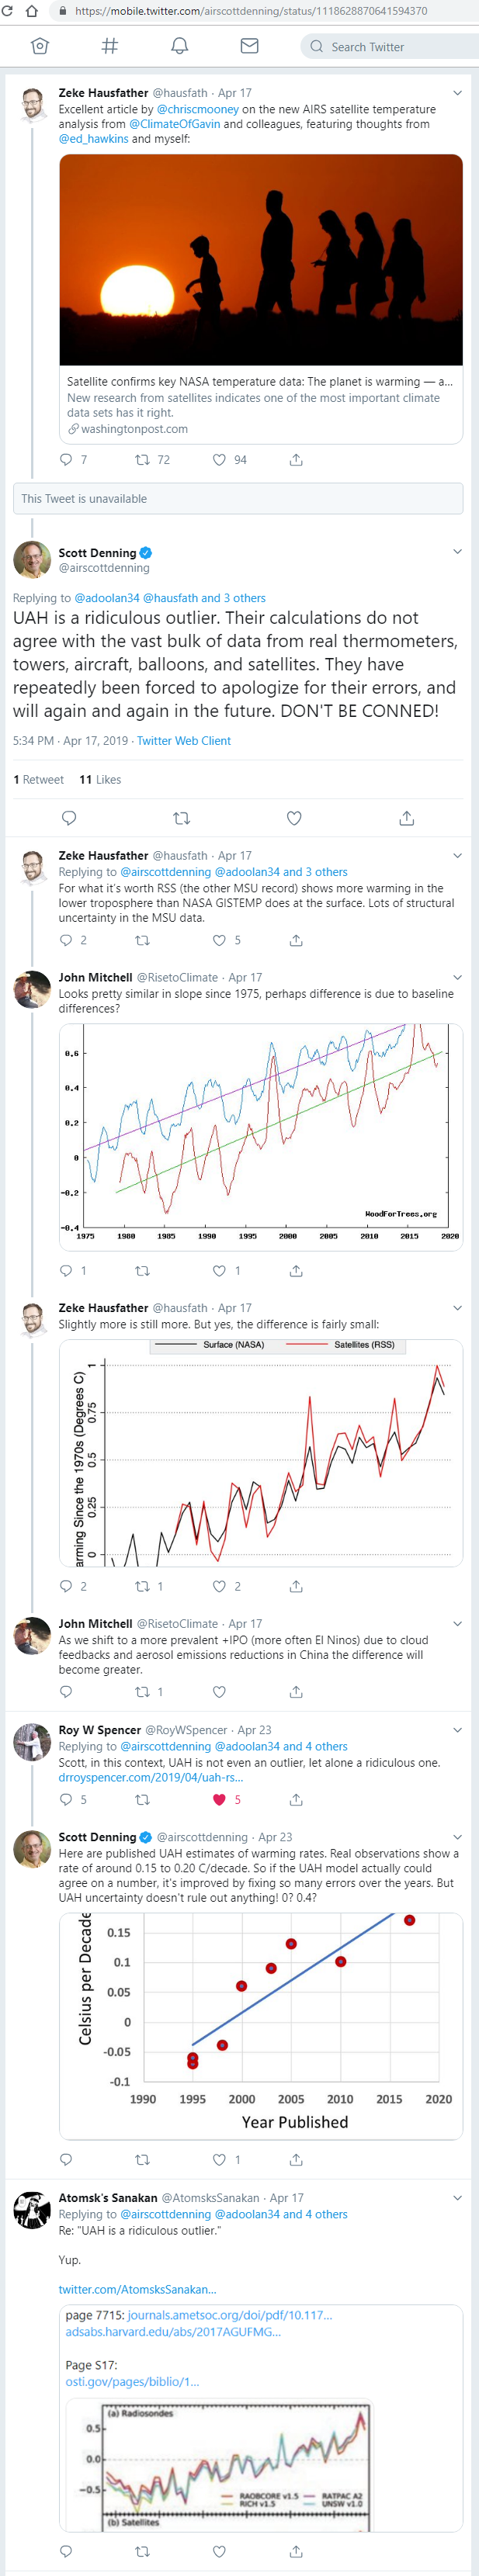
https://sealevel.info/mobile_twitter_com_airscottdenning_status_1118628870641594370_screenshot.pdf
I think any “scientist” who posts on Twitter should be exiled from the scientific community. After enduring so much sanctimony about “peer review” from these numb skulls, I really can’t brook their taking to a propaganda platform to issue “scientific” opinions.
But luckily you don’t think any “president” who posts on Twitter should be impeached.
It is a method to bypass the approximately 90% of the media that viscerally hates him.
Thank you Dr. Spencer for another informative and timely post. I feel compelled to offer a word of advice on your use of the phrase “wander off the reservation”.
The origins of this phrase are quite dark, referring of course to Indian Reservations, and a time when it was illegal to leave without permission, in some cases shot when found.
You are of course free to use whatever phrases you choose in your own posts, I realize the meaning has morphed now into referencing departure from the party line not an actual reservation, and I am generally not one for pandering political correctness, but wanted to let you know how deep this still cuts for some people.
Claiming to eschew PC while facilitating PC. Lame
My ancestry is Cherokee, and I don’t take offense at ‘off the reservation.’ PC should be changed to PS; Professional Scold.
Elizabeth Warren has taken the bloom off claiming Cherokee ancestry. My great grandmother, however, registered herself, white husband and my grandfather at the turn of the 19th – 20th Centuries. Official BIA records of what led to their eventual divorce are hilarious.
Denning’s nasty tweet is a sign his feedbag is running low.
This whole thing reminds me of the sun spot data. It takes leadership to form a group willing to put bias aside and work together to clean up a record filled with this person’s adjustment and that person’s adjustment to the count. Was it controversial? You bet. Still is. But at least it was done, collegially or not. And they put their names out there for all to see that they participated. That said, I would imagine they trucked in whole boxes of antacid whenever they met.
Testing IPCC’s Tropospheric Tropical Temperature anthropogenic signature prediction against data see:
McKitrick, R. and Christy, J., 2018. A Test of the Tropical 200‐to 300‐hPa Warming Rate in Climate Models. Earth and Space Science, 5(9), pp.529-536. https://bit.ly/2wFXtRN
Varotsos, C.A. and Efstathiou, M.N., 2019. Has global warming already arrived? Journal of Atmospheric and Solar-Terrestrial Physics, 182, pp.31-38. https://bit.ly/2CQBAT8
Popular summary: “Nature is NOT obeying the models.
Scientific summary: the models failed the validation against radiosonde and satellite data.
Dr Spencer says:
The wording here isn’t strictly accurate. The best estimate warming trend in UAH LT between 2003 and 2017 may be similar to that in HadCRUT4, but when error margins are taken into account only the HadCRUT4 trend is ‘significant’ (in a statistical sense).
HadCRUT4: 0.17 ±0.15 °C/decade (2σ)
UAH LT: 0.18 ±0.24 °C/decade (2σ)
http://www.ysbl.york.ac.uk/~cowtan/applets/trend/trend.html
The 2σ margin of error in UAH is wider than the best estimate trend, so not ‘statistically significant’; whereas the warming trend in HadCRUT4 is statistically significant.
Dr Spencer may be right to say that 15 years is too short a period to say much of value about global warming trends (though some folks around here seem to think that ~ 3 is plenty – so long as the trend is in a cooling direction!); nevertheless, it’s still possible to get a statistically significant trend (i.e. one with a less than 1 in 20 chance of occurring by chance, all other things being equal) over such a relatively short period.
In the absence of another big El Nino, the mid-2020’s should tell the trick. Otherwise, the only trend of interest would be a trend over at least 100 years. The multi-millennial trend shows cooling.
DWR54, using a super El Nino to create a trend is going to come back to haunt folks like you. Right now the trend over the past 3 years is -1.2 C / decade. That means in around 7 more years all the warming of the past 150 years will disappear … right?
Richard M
That was the logic used by Allan Macrae back in 2008 in his ICECAP article linked to above. That a short period of recent below average temperatures (again, following and El Nino high) could be used to claim that past warming had “disappeared!”.
Needless to say it is not a line of reasoning I agree with, because it covers such a short period over the total data set and because it ignores the enormous trend uncertainty that such a limited amount of data generates. (In your example, over the past ~3 years (since Jan 2016) the trend in UAH is -1.12 °C/decade, but the uncertainty is ±1.8 °C/decade (2σ). The uncertainty is greater than the estimate, so the trend is not significant.)
I hope I have been consistent in using the 30-year trend as my guiding metric, whether in satellite or surface data. In that case the 30-year trend in UAH up to 2016 (1986-2015 inc.) was 0.10 ±0.09 °C/decade (2σ); whereas in the 30-year trend in UAH to the latest month, Apr 1989-Mar 2019, is 0.13 ±0.09 °C/decade (2σ). So although the past few years show strong ‘best estimate’ cooling in UAH, overall the 30-year period ended March 2019 is considerably warmer than the 30-year period ended Dec 2015; although both periods show statistically significant warming.
DWR 54, Richard M
While I clearly disagree about DWR’s pedantic attitude (the REAL significance of 0.17 ±0.15 is imho by no means higher than that of 0.18 ±0.24), I think it is necessary to reply to Richard M’s comment as well.
Here is a chart showing, for UAH6.0 LT, the running 3 year trend, of course starting 3 years after begin:
https://drive.google.com/file/d/10va8z2uyS1kn-Wj3az_aTDukLsA1EHwt/view
As you easily can see, this trend time series shows four periods with a 3 year trend even below -1.38 °C / decade (i.e. a good bit below these -1.2 Richard M wrote about).
Rien de nouveau à l’Ouest!
So what…
Thus yes, Richard M: this superficial view over such a small period indeed “is going to come back to haunt you”.
The point was that trends are often the result of ENSO. I guess that went right over your head.
Richard M
What period do you use as your metric for adjudging temperature trends? 30-years is the WMO one.
Even 30 years is too short given the ocean cycles. Since we don’t have reasonable data that far back we are essentially in the situation where we must look for ways of removing noise from the data.
When I did this to the satellite data (removed the effect of ENSO, the AMO/PDO and volcanoes) I ended up with about .06 C / decade. However, that ignores the fact there was either cooling or at least no warming for the 40 prior years. No warming then halves this trend over the last 80 years.
The results are .03 C / decade which fits very well with the warming from the depths of the LIA which must have been natural. Hence, there is zero evidence of any warming which isn’t natural.
Bindidon
Well, the significance cut-off has to come somewhere. 2σ, or >95% confidence is the generally accepted scientific norm. I didn’t just make it up.
A trend of 0.17 ±0.15 tells us that even if we take into account the mathematical uncertainty inherent in the time series, we would *still* end up with a warming trend and that the chances of that happening in such a time series, all other things being equal, is less than 1 in 20.
A trend of 0.18 ±0.24 fails that test, so by the normal scientific standard (which may indeed be pedantic) there is a ‘significant’ difference between the two trends.
P.S. Perhaps the term ‘statistically detectable’ might be more appropriate than ‘statistically significant’, since the warming fraction remaining after deduction of the error range is very small (+0.02 C per decade); whereas ‘significant’ makes it sound more pronounced than it actually is. However, I don’t make the terminology up either!
The fact that there are differing data sets at all is interesting. If we were measuring reality by each set, the values would differ only by the instrumentation errors. So the difference between the sets (the maximum difference) shows the total instrumental measurement error, which is sufficient to invalidate ALL the data sets! I don’t think that the marked error bands show anything very useful, the real ones are huge compared with the claimed changes in temperature. Remember the scientific method demands that repeated experimental results are identical within the experimental errors, and that differing experimental techniques are expected to give the same results. Climate “science” does not display any of these characteristics, so must be invalid. The statistics are not relevant to this argument, it is all about repeatable results.
Ok, Ok… now, why do they stop at 2003? It’s because that is when the “Pause” began with no net warming over the period. Let’s look at THOSE years!