Alternate title:
No… “The biggest Saudi oil field is [NOT] fading faster than anyone guessed”… Part Trois: Why Peak Oil Is Irrelevant and the Perpetually Refilling Abiotic Oil Field Is Abject Nonsense
Guest reservoir geology by David Middleton
Saudi Aramco’s recent bond prospectus has generated a lot of media buzz, particularly regarding the production from Ghawar, the largest oil field in the world. Reaction has ranged from “The biggest Saudi oil field is fading faster than anyone guessed,” (not even wrong) to more subdued reactions from Ellen Wald and Robert Rapier, that the prospectus doesn’t really tell us much Ghawar’s decline rate. One thing that the bond prospectus did do, is to paint a picture of the most profitable company in the world and one that is serious when it says it will produce the last barrel of oil ever produced on Earth.
How big is Ghawar? Has it peaked? Is it “fading faster than anyone guessed”? The answer to the first question is: FRACKING YUGE. The answer to the second question was not easily answerable before Saudi Aramco began the process of becoming a publicly traded company. The answer to the third question is: Of course not.
As Saudi Aramco proceeds towards a 2021 IPO, it has had to embrace transparency. This involved an audit of the proved reserves in their largest fields, comprising about 80% of the company’s value. The audit was conducted by the highly respected DeGolyer and MacNaughton firm (D&M). The audit actually determined that the proved reserves are slightly larger than Aramco’s internal estimate.
This is from D&M’s certification letter (Appendix-C in the bond prospectus):
Reserves estimated herein are expressed as net reserves. Gross reserves are defined as the total estimated petroleum remaining to be produced from these properties after December 31, 2017, but before December 31, 2077 (license limit). Net reserves are defined as that portion of the gross reserves attributable to the interests held by Saudi Arabian Oil Company after deducting interests held by others. Saudi Arabian Oil Company has represented that it holds 100 percent of the interests evaluated herein; therefore, net reserves are equivalent to gross reserves for the purposes of this report.
Saudi Arabian Oil Company has represented that it holds interests in certain properties onshore and offshore the Kingdom of Saudi Arabia. Proved reserves have been estimated for 77 reservoirs in 29 fields in this report.
[…]
Definition of Reserves
Estimates of proved reserves presented in this report have been prepared in accordance with the PRMS approved in March 2007 by the Society of Petroleum Engineers, the World Petroleum Council, the American Association of Petroleum Geologists, and the Society of Petroleum Evaluation Engineers. Only proved reserves have been evaluated for this report. The petroleum reserves are defined as follows:Reserves are those quantities of petroleum anticipated to be commercially recoverable by application of development projects to known accumulations from a given date forward under defined conditions. Reserves must further satisfy four criteria: they must be discovered, recoverable, commercial, and remaining (as of the evaluation date) based on the development project(s) applied. Reserves are further categorized in accordance with the level of certainty associated with the estimates and may be sub-classified based on project maturity and/or characterized by development and production status.
Proved Reserves – Proved Reserves are those quantities of petroleum which, by analysis of geoscience and engineering data, can be estimated with reasonable certainty to be commercially recoverable, from a given date forward, from known reservoirs and under defined economic conditions, operating methods, and government regulations. If deterministic methods are used, the term reasonable certainty is intended to express a high degree of confidence that the quantities will be recovered. If probabilistic methods are used, there should be at least a 90-percent probability that the quantities actually recovered will equal or exceed the estimate.
[…]
Aramco bond prospectus, pages C-1 and C-3
A couple of important clues to Ghawar’s current production rate:
- Gross reserves are defined as the total estimated petroleum remaining to be produced from these properties after December 31, 2017, but before December 31, 2077.
- Proved Reserves are those quantities of petroleum which, by analysis of geoscience and engineering data, can be estimated with reasonable certainty to be commercially recoverable, from a given date forward… If probabilistic methods are used, there should be at least a 90-percent probability that the quantities actually recovered will equal or exceed the estimate.
D&M’s proved reserve number for Ghawar was 48,254 million barrels of liquids (crude oil, condensate and natural gas liquids). That’s just a shade under 50 billion barrels to be produced from 2018-2077.
Ghawar: “The King of Giant Fields”
Discovered in 1948 and located some 200 km east of Riyadh, Ghawar has produced about five million barrels of oil per day in the past three decades. Last year, output from Ghawar accounted for 62.5% of Saudi Arabia’s crude production (about 8 MMbopd) and 6.25% of the world’s total oil production (about 80 MMbopd).
Sorkhabi 2010, “Ghawar: The King of Giant Fields”
Ghawar is “big”…

Dr. Abdulkader Afifi described the geologic setting in his 2004 AAPG Distinguished Lecture…
Aramco initially discovered oil in Ghawar in 1948, based on surface mapping and shallow structure drilling. Ghawar is a large north-trending anticlinal structure, some 250 kilometers long and 30 kilometers wide. It is a drape fold over a basement horst, which grew initially during the Carboniferous Hercynian deformation and was reactivated episodically, particularly during the Late Cretaceous. In detail, the deep structure consists of several en echelon horst blocks that probably formed in response to right-lateral transpression. The bounding faults have throws exceeding 3000 feet at the Silurian level but terminate within the Triassic section. The episodic structural growth influenced sedimentation of the Permo-Carboniferous sandstone reservoirs, which onlap the structure and the Jurassic and Permian carbonate reservoirs, which accumulated in shoals above structural culminations.
The main oil reservoir is the Upper Jurassic Arab-D limestone, which improves upward from mudstone to skeletal-oolitic grainstone, reflecting successive upward-shoaling cycles. The excellent reservoir quality is due to the preservation of the primary porosity, the enhancement of permeability, and the presence of fractures in the deeper and tighter parts. The oil was sourced exclusively from Jurassic organic-rich mudstones and is effectively sealed beneath massive anhydrite. The general absence of faults at the Arab-D level maintained seal integrity. Current production is almost 5 million barrels per day under peripheral water injection. The southernmost part of the field remains under development, with a final increment of 300,000 barrels per day on stream in 2006.
Afifi, 2005
The structural/stratigraphic setting couldn’t have been better if it was designed for the purpose of becoming a super-giant oil field. The presence of a positive paleo-structure, episodic reactivation of uplift and buried fault system provided for a high-energy depostional environment, critical to the formation and preservation of carbonate porosity and provided pathways from the underlying prolific Silurian source rocks. The Jurassic Arab-D formation is covered by a thick sequence of anhydrite, forming a very effective seal.


The Arab-D carbonate is an incredible reservoir, particularly the skeletal-oolitic grainstone.
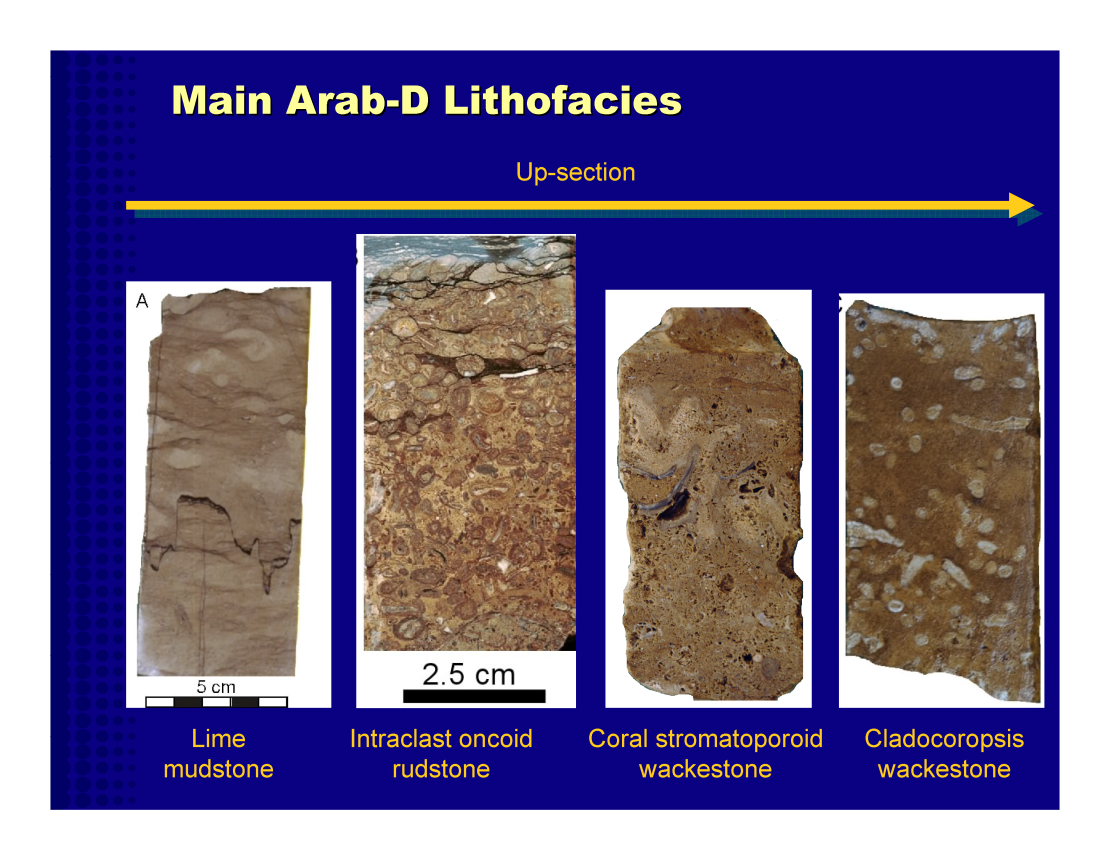

Ghawar is subdivided into five segments: Ain Dar, Shedgum, Uthmaniyah, Hawiyah and Haradh.

The 1954 structure map holds up pretty well today.

In 1980, Aramco published all of the data anyone would ever need to calculate the original oil in place (OOIP) for Ghawar:

I planimetered the areas of the five segments and then calculated to OOIP using this equation:

This is what I came up with:

About 183 billion barrels of oil. I also estimated approximate recoverable volumes:
| OOIP | 182,773,625,918 | bbl |
| Primary Water Drive 40% | 73,109,450,367 | bbl |
| Secondary Waterflood EOR 50% | 91,386,812,959 | bbl |
| Tertiary CO2 injection EOR 60% | 109,664,175,551 | bbl |
In order to estimate Ghawar’s current production rate, I needed three numbers:
- Original oil in place.
- Current proved reserves.
- Cumulative production
We have estimates of OOIP and proved reserves, but the cumulative production is a bit “fuzzy”.
Beydoun in his book (The Middle East, 1988) reports that Ghawar had produced 19 Bbo by 1979. According to an article on Ghawar in the AAPG Explorer (January 2005), the cumulative production from the field was 55 Bbo. The International Energy Agency in its 2008 World Energy Outlook states that the oil production from Ghawar reached 66 Bbo in 2007 and that the remaining reserves are 74 Bbo.
Data on Ghawar reported in the past issues of Oil & Gas Journal indicate that when Ghawar came on stream in 1951 it produced 126,000 bopd but production steadily rose with a major boost soon after the 1973 oil shock so that the field’s 1975 output was 4.2 MMbopd; this reached a maximum production of 5.7 MMbopd in 1981. From 1982-1990, the Saudis lowered their oil production for market considerations (most notably the oil crash of 1985) and thus Ghawar’s production was 2.5 to 3 MMbopd during that decade. A senior geologist with Saudi Aramco, A. M. Afifi, in his 2004 AAPG Distinguished Lecture, reported production values of 4.6-5.2 MMbopd for Ghawar from 1993 through 2003. These data indicate that 50-65% of Saudi Aramco’s oil production has traditionally come from Ghawar. Apparently, one half of Ghawar’s production (2.0 to 2.7 MMbopd) comes from the Ain Dar and Shedgum areas, while Uthmaniyah provides 1 MMbopd, and another million barrels or so comes from Hawiyah and Haradh combined.
Sorkhabi (2010)
For my estimate, I used the AAPG number of 55 billion bbl as the cumulative production through 2004. I then used the production data cited in Afifi (2005) as a starting point for a decline curve.

The Aramco bond prospectus noted that Ghawar’s MSC (maximum sustained capacity) was 3.8 million barrels per day (bbl/d) in 2018. Based on Aramco’s definition of MSC, it’s difficult to determine if that is a current value or an average value over the Saudi planning period (which appears to be 50 years). A 2% decline rate, typical of giant oil fields (Höök et al, 2009), fits a current MCS of 3.8 million bbl/d. A 1% decline rate fits a long-term average MCS of 3.8 million bbl/d. Based on the cumulative production and proved reserves, a 2% decline rate seems likely.

A 2% decline rate would lead to Ghawar producing just over 100% of its proved reserves (1p) from 2018-2077 (50.7 billion bbl). Recall that proved reserves (1p) is a >90% probability volume. Proved + probable reserves (2p) is the most likely volume (>50%). 2p is always a little (or a lot) bigger than 1p. As far as I know, Aramco has not published a 2p volume.
A 2% decline rate would lead to a recovery of approximately 65% of the OOIP from 1951-2077.

People have often asked, “How could Saudi Arabia ever replace Ghawar, the largest oil field in the world?” They already have replaced it… and Ghawar is not “fading faster than anyone guessed.” It’s declining as gracefully as befits the world’s super-giant oil field. Aramco plans on being able to produce 12 million bbl/d as for more than 50 years and they have the capacity to do so.

The Peak Oiler’s Nightmare
Almost all petroleum reservoirs exhibit exponential decline curves. They don’t fall off of a Seneca Cliff into the Olduvai Gorge. In aggregate, regional and global oil production has and/or will follow the same pattern, because it is just the sum of the individual reservoirs. Hubbert’s logistic function is an approximation of this basic principle of reservoir depletion.
Reality…

Peak Oiler Fantasy…

About the author
David Middleton has 38 years of experience as a geophysicist and geologist in the oil & gas industry, including a six-year exile into management. The vast majority of his career has been spent working the Gulf of Mexico. He has been a member of the Society of Exploration Geophysicists since 1981 and the American Association of Petroleum Geologists since 2004.
A note on comments: Abiotic oil aficionados are more than welcome to waste their time posting gibberish, but they won’t waste any of mine. Peak Oiler’s are also welcome to babble about Seneca Cliffs and Olduvai Gorges… And that might just merit wasting some of my time.
References
Abdulbaqi, Mahmoud, M. & Nansen G. Saleri. Fifty-Year Crude Oil Supply Scenarios: Saudi Aramco’s Perspective. CSIS, Washington D.C. February 24, 2004.
Afifi, Abdulkader. (2005). Ghawar: The Anatomy of the World’s Largest Oil Field. Search and Discovery Article #20026 (2005). Adapted from AAPG Distinguished Lecture, 2004.
Bardi, Ugo. “The Seneca Effect.” The Seneca Effect, thesenecatrap.blogspot.com/.
Blas, Javier. “The Biggest Saudi Oil Field Is Fading Faster Than Anyone Guessed.” Yahoo! Finance, 3 Apr. 2019, finance.yahoo.com/news/biggest-saudi-oil-field-fading-113434887.html.
Croft, Greg. The Ghawar Oil Field, Saudi Arabia. Greg Croft Inc.
http://www.gregcroft.com/ghawar.ivnu
DiChristopher, Tom. “Saudi Arabia’s Massive Oil Reserves Total 268.5 Billion Barrels, Even Bigger than Previously Known.” CNBC, 9 Jan. 2019, www.cnbc.com/2019/01/09/saudi-arabias-massive-oil-reserves-grow-by-2point2-billion-barrels.html.
Höök, Mikael & Hirsch, Robert & Aleklett, Kjell. (2009). Giant oil field decline rates and their influence on world oil production. Energy Policy. 37. 2262-2272. 10.1016/j.enpol.2009.02.020.
Hubbert, M. King. “Nuclear Energy and the Fossil Fuels. Presented before the Spring Meeting of the Southern District, Division of Production, American Petroleum Institute, San Antonio, Texas, March 7-8-9, 1956.” Nuclear Energy and the Fossil Fuels. Presented before the Spring Meeting of the Southern District, Division of Production, American Petroleum Institute, San Antonio, Texas, March 7-8-9, 1956, 1956. https://debunkhouse.files.wordpress.com/2017/03/1956_hubbert.pdf
Levorsen, A. I. Geology of Petroleum. Freeman, 1954.
Middleton, David H. “No… ‘The Biggest Saudi Oil Field Is [NOT] Fading Faster than Anyone Guessed’…” Watts Up With That?, 5 Apr. 2019, wattsupwiththat.com/2019/04/04/no-the-biggest-saudi-oil-field-is-not-fading-faster-than-anyone-guessed/.
Middleton, David H. “Demand for Aramco Bond Offering Breaks Records… Tops $85B.” Watts Up With That?, 9 Apr. 2019, wattsupwiththat.com/2019/04/09/demand-for-aramco-bond-offering-break-records-tops-85b/.
Paraskova, Tsvetana. “Saudi Arabia: We’ll Pump The World’s Very Last Barrel Of Oil.” OilPrice.com, 23 Jan. 2019, oilprice.com/Energy/Crude-Oil/Saudi-Arabia-Well-Pump-The-Worlds-Very-Last-Barrel-Of-Oil.html.
Peak Oil. “The Seneca Cliff of Oil Production”. Exploring Hydrocarbon Depletion. June 7, 2016. https://peakoil.com/production/the-seneca-cliff-of-oil-production
Rapier, Robert. “The Permian Basin Is Now The World’s Top Oil Producer.” Forbes Magazine, 5 Apr. 2019, www.forbes.com/sites/rrapier/2019/04/05/the-permian-basin-is-now-the-worlds-top-oil-producer/.
Saudi Arabian Oil Company (Aramco). Global Medium Term Note Programme. Base Prospectus dated 1 April 2019.
Sorkhabi, Rasoul (2010) The King of Giant Fields. GeoExpro, vol. 7, no. 4 (January-February 2010), pp. 24-29). Published, 09/2010.
Wald, Ellen R. Investing.com. “What Saudi Aramco’s Bond Prospectus Reveals About Its Oil Reserves.” Investing.com, 4 Apr. 2019, www.investing.com/analysis/saudi-aramco-bond-prospectus-200403775.
As always, David, That was a very informative read. Thanks.
+ Agreed.
But abiotic oil is such a warm fuzzy. Can’t I believe in it anyway? Or should I shift my fantasies to what we know is remaining and the fact that we’re still finding more oil? What about my great grandchildren? Will they be left with only a few hundred years of fossil fuels?
The idea of rapidly re-filling oil fields is likely a fantasy based on the evidence.
However…
Given the abundance of hydrocarbons throughout the solar system (and the measured abundance of hydrocarbons in the spectra of distant nebulae), it is madness to believe that Earth is somehow uniquely the only place where hydrocarbons are primarily biogenic. Non-biogenic hydrocarbons are just not where we would expect them to be based on assumptions about biogenic hydrocarbon formation.I would not be the least surprised if relatively abundant oil eventually ends up being found just about everywhere.
They aren’t “biogenic”…
Apart from biogenic methane, oil and most natural gas are thermogenic. They aren’t formed by biological processes. They are formed by thermogenic processes from material of biological origin.
Abiotic methane is common on Earth and elsewhere in the Solar System and Galaxy. Methane isn’t oil.
One of the primary abiotic oil fallacies is that they flat-out don’t understand the conventional theory of oil & gas formation.
What a simple revealing statement. I wished I had this in mind for countless replies over the years…
You win a “Subduction leads to Orogeny” T-Shirt.
Gwahar is small compared to Louisiana.
Pick on Delaware, everybody does.
If the Chesapeake Bay impact had just occurred a little to the west, there might not be a Delaware… 😉
I do tend to mix up biotic and biogenic. Dyslexia.
I understand the conventional theory just fine, I simply find it unbelievable that earth alone is somehow exempt from the otherwise universal formation of primordial hydrocarbons. As tampatom pointed out, complex organics and hydrocarbons have been observed forming in deep space. They’re everywhere. But apparently just not here for some reason.
The phraseology is clumsy. They do “form” here. Lost City is an example.
They did form here. However once plants started producing oxygen, whatever was left from the formation quickly oxidized.
What does J. F. Kenney flat-out not understand about the conventional theory, especially of oil formation?
Forget about abiotic origin for the moment. The question is by what thermal process do straight-chain alkanes form from whatever biological source material under conditions of the crust. His claim is that this major constituent of oil cannot form by an equilibrium thermodynamic process for the same reason diamonds don’t form there.
He nor me are claiming that the Fischer-Tropsch process takes place geologically. But, Fischer-Tropsch which takes place under conditions of pressure and temperature not representative of where Kenney claims oil forms, these are non-equilibrium processes as they are not run to completion if the more commercially synthetic #2 Diesel is what you want into instead of the less valuable methane.
Oil can still form from organics through the plate-tectonic conveyor, but the claim is that molecular weights greater than CH4 require mantle conditions for formation, just as diamonds do.
Yes, I know about the argument “how does the oil squeeze through the rocks up from the mantle”? But this doesn’t settle the argument as to from what source material (Kenney uses carbohydrates as a “straw-man” source, petroleum geo-chemists claim certain algae constituents as the source) and by what thermodynamic process does oil form in the crustal oil window?
Yes, I heard your argument that it “has to” come from the crustal oil window, but if we don’t know the chemical pathways, this is a major gap in human understanding. It also undermines the claim that the people who don’t accept this are unscientific cranks.
I rather people admit to the uncertainty in the science rather than make broad claims that the science is known, especially when it isn’t.
Kenney failed to grasp the geothermal gradient… That’s an epic fail.
Kenney knows as much about the geothermal gradient as anyone else.
He claims, based on equilibrium thermodynamics that any heavier alkane than methane can only form under the extreme temperature and pressure of the mantle, much for the same reason that diamonds can only form there. There is that now semi-famous paper of how someone formed methane and higher alkanes in a diamond-anvil cell simulating mantle conditions, starting with water, iron ore and limestone. Calcium carbonate has an organic origin, doesn’t it?
If straight-chain hydrocarbons are found anywhere else than in the mantle, such as in crustal deposits in the “oil window” portion of the geothermal gradient or in the gas tank of my car, they are “metastable” there, just like the diamond in a ring someone is wearing.
The migration problem for diamonds is “solved” by the kimberlite “diamond pipe”, hypothesized to be a type of explosive eruption that no human has witnessed.
I get that there is a problem, a whole bunch of problems, of how mantle oil could migrate to the oil window where it won’t get cracked into methane and petcoke. But how did it form in the oil window when the thermodynamics say that it cannot by an equilibrium process?
One way to refute Kenney is his assertion that the conventional theory of oil formation starts with cellulose — material from vascular plants — from which he claims that under crustal conditions you can only form methane. Or coal. The most current version of conventional theory of oil formation is that you have to start with algae. There are papers suggesting that some algae, or organelles in algae, are much closer to oil than any tree or vegetable is. There is also what is called a serpentinization reaction involving some manner of fluid transport that facilitates non-equilibrium chemical reactions.
But tell me that his grasp of chemical thermodynamics is wrong?
Producible oil doesn’t exist below the oil window, only gas. And the hotter it gets, the drier the gas. This isn’t based on a theory. It’s based on over 100 years of drilling.
Crude oil cracks if exposed to temperatures above about 300°F for an extended period of time. It generally can’t exist at depths anywhere close to the mantle.
Walker Ridge 758 Chevron #1 is the deepest active oil producer in the Gulf of Mexico; drilled to a true vertical depth (TVD) of 28,497’ (8.7 km) in a water depth of 6,959’. It was completed in a Lower Tertiary Wilcox sandstone (26,831’ – 27,385’). The bottom hole temperature was 226 °F. The oil migrated upward from deeper Mesozoic and Lower Tertiary source rocks. Even deeper oil reservoirs have been discovered in the oil window, many of these will be coming on production over the next few years.
There are no oil wells in the Gulf of Mexico with bottom hole temperatures outside of the oil window. The ultra-deepwater Lower Tertiary oil discoveries are well within the oil window. The shallow water Lower Tertiary gas discovery at Davy Jones is well out of the oil window, but in the gas window…
The depths on the chart are approximations based on a generalized geothermal gradient. The geothermal gradient is highly variable. Water and halite (salt) are less dense than most rocks. When the overburden consists of 8,000’ of seawater and 2,000’ of halite, 30,000’ of overburden weighs a lot less than it does when it’s all composed of more dense rocks.
The ultra-deepwater Lower Tertiary play in the Gulf of Mexico and the deep subsalt plays offshore Brazil are often cited as examples of abiotic oil because the reservoirs are supposedly too deep, too hot and/or too highly pressured to be in the oil window. This is simply wrong.
Tabular salt acts like a radiator. It conducts heat away from the substrata toward the surface. The combination of thick layers of salt and deep water depths enable oil to exist at depths previously unexpected. Salt and water are also less dense than most other overburden. This enables reservoir quality rocks to exist at deeper depths than previously expected.
I’ve drilled wells deeper than 20,000’ in the Gulf of Mexico. The bottom hole temperatures were in the range of 215°F (100°C). Ten wells in the Gulf of Mexico, drilled to true vertical depths greater than 20,000’ have each produced more than 20 million barrels of oil. The maximum bottom hole temperature (213°F) was encountered in the Mississippi Canyon (MC) 777 TF001 well, drilled by BP. The average bottom hole temperature of those ten 20 million barrel producers was 197°F.
It’s possible that crude oil-like substances can form at higher temperatures… however, producible volumes of oil haven’t been found below the oil window.
Archer, I agree. In the link below is an image of a complex carbon based organic molecule — found in DEEP INTERSTELLAR SPACE.
Here is link to the research:
http://newatlas.com/organic-stardust-discovered/20310
The researchers have found that:
“not only are stars producing this complex matter on extremely short time scales of weeks, but they are also ejecting it into the general interstellar space in between stars.”
I am not an “abiotic” fan in the sense that oil is produced in the deep earth, but rather I am an “abiotic” fan in the sense that the supernovae stars produced massive amounts of unreduced complex carbon molecules and flung them into space when they exploded. The earth was blessed with huge quantities of this “molecular dust” in its original formation. I highly recommend to you the book The Deep Hot Biosphere by Thomas Gold,
http://www.amazon.com/s/ref=nb_sb_ss_i_1_13?url=search-alias%3Dstripbooks&field-keywords=the+deep+hot+biosphere+the+myth+of+fossil+fuels+by+thomas+gold&sprefix=the+deep+hot+
It is Gold’s premise that the vast, vast majority of hydrocarbon deposits of oil and gas and hard coal on earth are from hydrocarbons present in the original stellar accretions of space dust which amalgamated to become the earth. As such, these reserves are NOT biological in origin, the reserves are much more abundant than thought, are fully renewable, and virtually inexhaustible.
Thomas Gold is no dummy:
Thomas Gold is a member of the National Academy of Sciences, a Fellow of the Royal Society, and an Emeritus Professor of Physics at Cornell University. Regarded as one of the most creative and wide-ranging scientists of his generation, he has taught at Cambridge University and Harvard, and for 20 years was the Director of the Cornell Center for Radiophysics and Space Research.
I imagine it will take some time to get rid of the belief that oil and gas are “fossil” fuels and non-renewable.
It’ll take a couple of million uears
David you are a national treasure!
Aramco’s proposed $10 billion bond issue is 10 times oversubscribed.
David: Re “I planimetered the areas of the five segments and then calculated to OOIP using this equation:” Was that a K&E compensating polar planimeter or equivalent, or have you gone over to the dark side with one of those battery-powered rolling things? Three traverses and divide the cumulative by three? Did you adjust for the tooth (roughness) of the paper and account for grease spots from the donut?
NeuraMap… http://www.neuralog.com/pages/NeuraMap.html
Thank you. Bookmarked. But I still miss the coffee and donut while planimetering.
I learned to planimeter in 1966 when I started working for the Gas Department in the Alberta Oil and Gas Conservation Board. The next year they hired a young fellow that used to party on the weekend and often spent his noon hour lunch in the nearby hotel bar. One day I went by the work room and he was planimetering and he was shaking so bad he had trouble staying on the line. I informed the Chief Reservoir Engineer and after watching the fellow work he laughed and said not to worry, that the trainee was shaking on both sides of the thickness pay line and it should all even out. That was the last time he was assigned that job. He only lasted another couple of months since he had trouble coming getting to work on Mondays.
I love working on weekends… Alcohol is great for smoothing out contours… 😎
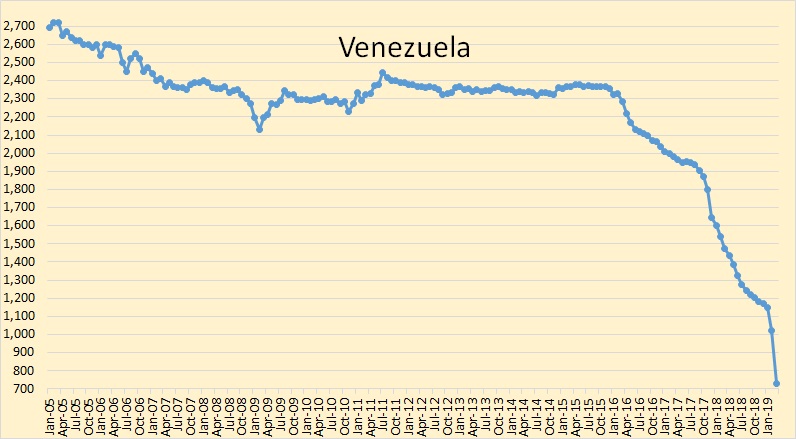
A Seneca cliff in oil is no longer fantasy.
Venezuela is displaying one for all to see.
http://peakoilbarrel.com/wp-content/uploads/2019/04/Venezuela.jpg
How to go from 2.4 million barrels per day to 700,000 bpd in just three years.
In your mind, the incompetence of those running the oil company has nothing to do with the drop off in production?
Seneca did not specify a required cause in his letter to Lucilius. He just said that the road to ruin is much faster. When things start to go wrong problems mount an a Seneca cliff often results. There is nothing mysterious about it, and ruling out the cause for one Seneca cliff does not mean that another cannot take place from different causes.
Let me see if I have this right. Any sudden drop, regardless of cause, is a Seneca Cliff.
Really?
To be a Seneca Cliff, recovery is not possible as the resource is exhausted.
A production drop because of the incompetence of the operators can be reversed by bringing in competent operators. Therefor such a drop cannot be a Seneca Cliff.
No, you don’t have it right. Seneca’s example was the fire that destroyed Lyon the previous summer. Lyon was reconstructed. The lesson is that what takes a lot of effort to build can collapse in a moment.
Venezuela’s oil production is a perfect example of a Seneca cliff. Another typical example is North Atlantic cod captures that peaked in 1980 and collapsed afterwards. The resource is not exhausted as cods are renewable but it might take a long time to increase their population to previous levels.
You just repeated the nonsense from earlier, using different words.
Every sharp drop off is proof of Seneca. No matter what happens, it’s proof that the theory is right.
It’s the Malthusian version of catnip. Every transient drop in something is instantly an irreversible jump off Seneca Cliff into Olduvai Gorge.
You just have the wrong idea about what a Seneca cliff is, and I am trying to explain politely.
The Seneca cliff is not a theory. It is an observation. As such it cannot be right or wrong, as observations simply are. It is the observation that many things that take a long time to became, collapse in a much faster way.
Whether post-Peak Oil production would suffer a Seneca cliff is anybody’s guess, but it is certainly a possibility. If the economy suffers badly from post-Peak Oil consequences oil might become unaffordable to most, and demand could crater.
Mexican Cantarell oil field also shows a Seneca cliff in oil production.
http://www.energycrisis.com/mx/images/cantarell.png
Seneca’s observation is valid 2000 years later because these sort of things happen.
Another Seneca Cliff collapses…
[…]
https://www.hartenergy.com/exclusives/meteoric-history-cantarell-field-continues-pemex-175129
Every sudden drop is a Seneca cliff.
Got it.
Bjorn Lomborg has a great explanation of this in The Skeptical Environmentalist.
Could you post this as an image? Links are just not convincing.
He can’t but I can and did in this comment… https://wattsupwiththat.com/2019/04/10/peak-ghawar/#comment-2676923
Javier’s link is to a jpg, so it is an image – just one you have to click on the link to see. Unfortunately only those with special permissions can post a link to an image and have it show up as an image.
I’m happy to post images for people. I posted Javier’s image in one of my comments (Peak Oiler Seneca Cliff).
Venezuela’s recent decline has nothing to do with the crude oil reservoirs. Hurricanes shut down production in the Gulf of Mexico. Wars shut down production in entire regions. Venezuela’s recent decline is largely due to economic sanctions and their failed status as a nation.
[…]
Peak Oiler Seneca Cliff…
A dead Seneca Cliff bounce…

The BP data only go back to 1965; however I was able to find data from 1910-1922 with a quick search…
A Hubbert-like curve…

Looks a lot more like a Hubbert curve than a Seneca Cliff, even with the sanctions-driven short-term decline. For that matter, the sanctions-driven decline looks a lot like the nationalization-driven decline in the 1970’s.
Rystad has it wrong. It is 2019 and Venezuela’s oil production is already lower than their low case. Predictions about oil production or oil price aren’t worth much. Venezuela’s decline is not due to sanctions. The decline in Venezuela’s oil production won’t be short term, since due to neglect a lot of the infrastructure is damaged and replacing it will take time and money.
Rystad is correct…
There are three months of 2019 production data:
Jan 1.216 mmbbl/d
Feb 1.086 mmbbl/d
Mar 0.841 mmbbl/d
Rystad’s low case had the annual average dropping to about 800,000 bbl/d this year and falling below 700,000 bbl/d next year.
https://www.rystadenergy.com/newsevents/news/press-releases/Venezuela-update-Production-could-fall-below-700000-bpd-by-2020/
The collapse over the past year is driven by US sanctions. Recovery will be a slow process, even with regime change.
The failure of PDVSA started in the late 1990’s when Chavez fired most of the staff and replaced them with cronies. It worsened in 2007 when Chavez expropriated ExxonMobil’s and ConocoPhillips’ assets and drove foreign capital out of Venezuela… Not unlike the collapse in the 1970’s when Venezuela nationalized its oil.
https://www.forbes.com/sites/rrapier/2019/01/29/charting-the-decline-of-venezuelas-oil-industry/#1be7ec664ecd
None of this is related to Peak Oil, much less a mythical version of Peak Oil.
And Cod never vanished, they just followed the AMOC line of their favoured ocean temperatures and food supplies. For some few years, they have been returning to their more southern haunts…. True Seneca curves await as David intimated, the passage of millions of years. Milankovich time in Cods’ case. Brett
I think there are two misunderstandings here. First I don’t know anyone who suggested Seneca cliff applies to oilfield decline. Gail Tverberg does apply to societal collapse which will in turn impact our ability to produce the last part of the oil. Venezuela is a temporary example. Get rid of the socialist down there, there is still an group of outsiders willing to help Venezuela recover. But if global economy were to collapse due to the high price of oil, there are no outsiders to help out. Producing oil requires a huge number of specialists who must be supported by an agricultural system which turns petroleum into food via petroleum based fertilizer and fuel. When peak oil production occurs, the agricultural system will be at risk and that in turn will risk societal collapse from starving people trying to survive.
Glenn,
I don’t personally know anyone who does either. But I have encountered this sort of nonsense on the Internet for more than a decade…
The Seneca Cliff of Oil Production
There’s also the Olduvai Gorge fantasy…
Peak Oil And The Olduvai Gorge
PEAK OIL, TOTAL COLLAPSE, AND THE ROAD TO THE OLDUVAI
Peak oil production will only put agriculture at risk if the peak is due to an inability to produce enough refinery and petrochemical feedstock to meet demand. Peak oil, when it occurs, will more likely be due to a flattening of demand growth, rather than a sudden inability to produce enough refinery and petrochemical feedstock.
Davin,
I may have missed it, but in peak energy, I have not seen natural gas
hydrates in the mix.
I know that you know the difference between natural gas and methane,
but many people use the terms interchangeably.
For the people who missed the delineation, natural gas is made up of
mostly methane, but varies by location, ethane, propane, butane, and
small percentages of other gases such as CO2.
Vast volumes of natural gas hydrates lie within the legal boundaries
of the US.
When the cheap supplies of natural gas on land diminish, hydrates
will be exploited. The Chinese are beginning to do so now.
The method of recovery is likely, in my opinion, to be simple,
but very dangerous.
Cat cracking can convert the gas to diesel, gasoline, etc.
References for suggested reading:
https://energy.mit.edu/wp-content/uploads/2011/06/MITEI-The-Future-of-Natural-Gas-Supplementary-Paper-2.4-Methane-Hydrates-and-the-Future-of-Natural-Gas.pdf
http://www.truebluenaturalgas.org/how-much-natural-gas-does-the-us-have/
There’s enough methane hydrates on the US OCS to cover about 1,000 years of consumption. However, there’s currently no economic way to produce them.
Chinese are currently producing hydrates.
https://www.chemistryworld.com/news/china-opens-up-new-energy-front-as-it-taps-gas-hydrates/3007662.article
Japan did the same thing a few years ago…
6,800 m3 = 240,140 ft 3… That’s 240 mcf/d in deepwater (1 km ~ 3,280 ft). That is about 1/100 of an economic production rate in 3,000′ of water… 240 mcf/d isn’t even a marginal onshore gas well.
As I said, it is not currently economically possible o produce methane hydrates.
Methane Hydrate Economics
David:
Should that link be: https://debunkhouse.wordpress.com/2017/07/24/methane-hydrate-economics/
It should be… I linked to a version that was open open for editing.
“there’s currently no economic way to produce them.”
3 Things will happen.
1 is that when the supply of other hydrocarbons falls below demand, prices will rise until it is economic to use other resources.
And 2, the technological problem is not in a zone forbidden by the laws of physical science and mathematics (faster than light, sunshine in the nighttime), therefore it will, when prices provide a sufficient incentive, be solved, without warning.
3. “Environmentalists” will be dead set against it.
Spot on Walter. Particularly number 3
The problem is getting a meaningful production rate. A TCF of gas in 3,000′ of water only capable of producing at a rate of 240 mcf/d per well is worthless… 24,000 mcf/d per well might work.
Is the higher rate forbidden by a law of physics or mathematics?
Mostly by a lack of reservoir pressure.
At this rate they will start to bother to look for pre-salt oil in about 20 years.
Basic question here: Does the dominant producer with the largest reserves have any incentive A) to look continuously for more reserves or B) to pursue high cost investment in production in known resources such as heavy oil, shale oil, or gas fields?
If Aramco wasn’t pursuing an aggressive exploration program, they couldn’t be doing this…
Fields “other” than their five largest cover nearly 1/4 of their MSC…
I think not. It’s all about reform.
https://www.zawya.com/uae/en/business/story/Aramco_prospectus_underscores_importance_of_reform_success-ZAWYA20190410064324/
…and this is not cheap either
https://finance.yahoo.com/news/saudi-aramco-quest-become-world-124252726.html
An alternative view:
http://peakoilbarrel.com/opec-march-data-and-saudi-report/
David, excellent.
The IEA published a WEO 2008 survey of all of the worlds significant oil fields—all supergiants and giants, many majors—794 in total accounting for about 2/3 IIRC) of world production at that time. They were primarily seeking two pieces of information: estimated total recovery, and decline rate. They found that the best oilfields (like Ghawar or Samotlar) have estimated ultimate total recovery (primary plus water flood plus tertiary) averaging about 65% just as you calculate. But the average ultimate recovery for all 794 was 35% (higher viscosity, less favorable porosity and permeability). The average decline rate for all was 5.1%. Shows how the best compares to the average.
Wrote it up in one ov several oil focused energy essays in ebook Blowing Smoke.
The average decline rate for all mature fields is around 5%… For giant fields (>1 Bbbl) it’s closer to 2%.
Ghawar’s very high recovery factor is due to reservoir rock properties and very strong water drive.
David,
Peak Oil is implicit in what you wrote about. i.e.
“A 2% decline rate would lead to Ghawar producing just over 100% of its proved reserves (1p) from 2018-2077 (50.7 billion bbl).”
Any decline rate in production implies “peak oil”. Unless there is an infinite
supply which seems unlikely on a finite planet oil reserves are finite and will
decline to zero at some point in the future. You would appear to be placing
peak oil a some point in the relatively near future. Possibly around 2040 like Mike Jonas suggested recently.
Peak oil for one field, would not be evidence that peak oil for the earth is at hand, or even close at hand.
It is odd that everyone forgets about ‘conventional’ hydrocarbons.
The Saudi oil reservoir is small compared to the Canadian high viscosity ‘heavy’ oil reservoir.
It is interesting when a person tries to explain why there are super large deposits of hydrocarbons, on the surface of the planet.
The Canadian Athabasca heavy oil deposit contains 1.7 trillion barrels of oil which is more than the entire world’s estimated 1.5 trillion barrels estimate of ‘conventional’ oil.
The unconventional heavy oil all contains massive amounts of heavy metals. The amount of heavy metals in oil increases as the oil viscosity increases.
The Canadian heavy crude is solid at room temperature. It must be melted and then diluent added to enable it to be shipped. The metals in the Canadian heavy crude are so high that a special catalyst is required for oil refining.
https://en.wikipedia.org/wiki/Athabasca_oil_sands
The Athabasca sticky (high viscosity) oil sands deposit contain roughly 1.7 trillion barrels of heavy oil.
https://en.wikipedia.org/wiki/Oil_reserves
This compares to the total oil reserves of the top 17 countries of 1.5 trillion barrels of oil and Venezuela’s heavy oil deposit of 1.2 trillion barrels.
The Orinoco Belt consists of large deposits of extra heavy crude. Venezuela’s heavy oil deposits of about 1,200 billion barrels (1.9×10¹¹ m3), found primarily in the Orinoco Petroleum Belt, are estimated to approximately equal the world’s reserves of lighter oil.[1]
The Athabasca oil sands (or tar sands) are large deposits of bitumen or extremely heavy crude oil, located in northeastern Alberta, Canada – roughly centred on the boomtown of Fort McMurray. These oil sands, hosted primarily in the McMurray Formation, consist of a mixture of crude bitumen (a semi-solid rock-like form of crude oil), silica sand, clay minerals, and water. The Athabasca deposit is the largest known reservoir of crude bitumen in the world and the largest of three major oil sands deposits in Alberta, along with the nearby Peace River and Cold Lake deposits (the latter stretching into Saskatchewan).[3]
Together, these oil sand deposits lie under 141,000 square kilometres (54,000 sq mi) of boreal forest and muskeg (peat bogs) and contain about 1.7 trillion barrels (270×109 m3) of bitumen in-place, comparable in magnitude to the world’s total proven reserves of conventional petroleum.
Firstly, you’re comparing entire basins to an individual oil field.
Secondly, there is a huge difference between oil in place, technically recoverable oil and economically recoverable oil.
There’s well over a trillion barrels of oil in the Green River Oil Shale in Colorado… About 100% of it is technically recoverable. None of it is currently economically recoverable.
The Canadian heavy oil is found primarily three very large deposits, not basins.
When a deposit of oil is very large it does not change from a deposit to a basin.
‘Basin’ the word, as used in the oil industry, is a region where the oil deposits are found.
The Canadian heavy oil is oil, just oil with less hydrogen and lots of heavy metals.
I missed adding a quote from my link.
“This map shows the extent of the oil sands in Alberta, Canada. The three oil sand deposits are known as the Athabasca Oil Sands, the Cold Lake Oil Sands, and the Peace River Oil Sands/”
William,
You are comparing basin-wide resource plays to individual conventional oil fields…
There isn’t a direct comparison. The fact that the most prolific resource play, the Permian Basin, only barely tops Ghawar’s most likely current production rate ought to be a clue.
The volume of oil in place or even the volume technically recoverable is irrelevant if it’s uneconomic.
William,
You will find the official numbers for Alberta Bitumen on Page 7 at link below
1.8 Trillion Bbl Initial in Place Resources
315 Billion Bbl Ultimate Potential (Recoverable)
177 Billion Bbl Initial Established Reserves
164 Billion Bbl Remaining Established Reserves
ST98: 2018ALBERTA’S ENERGY RESERVES& SUPPLY/DEMAND OUTLOOK
https://www.aer.ca/documents/sts/ST98/ST98-2018_Executive_Summary.pdf
Page 7
Most metals get rejected with PetCoke when one feeds the Bitumen to a Coker
I have no idea when global peak oil production will occur… It’s possible that it’s already occurred. There’s just no way to know until it’s already happened.
The relative inelasticity of demand means rapid upward price movement for petroleum when there is a significant shortfall relative to demand. Substantial long term price increases (inflation adjusted) over historical prices seem to me a strong indicator of resource limitation; that strong signal seems lacking at present. Of course, any rapid price increase will, in both the long and short term, lead to greater economically recoverable petroleum resource. It is probably impossible to define the inventory of “recoverable” petroleum, since the answer depends on how much marginal petroleum production is valued in the market. My guess is that the potential price is very high.
The inelasticty works both ways. Supply can’t quickly adjust to demand either. The inelasticity is probably one of main drivers of boom & bust cycles.
It’s debatable whether or not inflation-adjusted prices have a clear trend… But, the resource is absolutely limited… And I agree the total inventory of recoverable resource is unknowable.
Has Saudi Aramco done any exploration drilling in the huge Rub Al Khali area between the south end of Ghawar and the “new” Shayba field?
Saudi Arabia is pumping less today than it was 1979. It is probably fair to say that the Kingdom is near the top of its production capacity. While it may stay there for some time, it is unlikely to cover much growth in demand.
Indeed, since 2005, US shales have provided 65% of oil supply growth by themselves, 77% with Canada’s oil sands. That is a remarkable degree of dependence on really a single source of supply — US shales. When shales falter, we’ll be right back in a high oil price environment.
Saudi Arabia may be near their peak production capacity, but they are producing more now than they were in 1979…
For details see the excellent graphs of 2005-2019 by Ron Patterson at PeakOilBarrel.com eg
“OPEC March Data and Saudi Report” April 10, 2019
http://peakoilbarrel.com/opec-march-data-and-saudi-report/#more-21710
Note Patterson’s very detailed discussion of Saudi reserves and depletion rates.
Patterson is wrong in every way possibly imagineable.
If Saudi Arabian oil fileds had an average depletion rate of 29%, they would have been gone in the 1960’s.
Thanks, David, extremely informative, clear, well written, well referenced.
The part I liked most was the part that “formed in response to right-lateral transpression”. I keep looking to see where that combination of words goes off my mental rails and I can’t find the exact spot. English is a wonderful language.
Much appreciated,
w.
Thanks Willis!
I’m glad I work the Gulf of Mexico… our faults generally don’t exhibit transpression or transtension… mostly just up and down.
Quick clarification. I presume the following:
“The field averaged 820 bbl/d in 2018” in reference to the Eugene Island 330 field meant 820,000 bbl/d based on the y-axis on the plot above the caption.
Did I interpret that correctly? Surely, we would not be discussing 820 bbl/day.
820 was a typo. It should have been 8,200.
The x-axis is cumulative production. The y-axis is the average daily rate.
Conclusion: Ghawar is running out of oil, and we are very unlikely to ever find anything close to what that field has left today.
Did you ever wonder what all those Saudis are going to do when their population is 50 million and their oil production drops below 4 million BOPD? I think they will be heading north.
Ghawar has been “running out of oil” since the first well went online in 1951. Ghawar’s proved reserves are sufficient to keep production above 2 million bbl/d until 2050 and Aramco’s overall proved reserves are sufficient to keep Saudi oil production above 10 million bbl/d for 70 years.
Cool! I’m going to go ahead and put a blower on the Camaro. 😉
Thank you for another informative post.
★★★★★
Thank you!!
Dave:
Minor quibbles to an informative read (where IS Marcus????):
Corrections(?) bolded:
” . . . that the prospectus doesn’t really tell us much about(?) Ghawar’s decline rate.”
” . . . The presence of a positive paleo-structure, episodic reactivation of uplift and buried fault system provided for a high-energy depostional environment . . . ”
“Aramco plans on being able to produce 12 million bbl/d as for more than 50 years and they have the capacity to do so.”
Marcus is falling down on the job again… 😉
I still need to fix those.
David Middleton – Thanks for your details and calculations.
Please expand on your the basis for recovery, especially
“Secondary Waterflood EOR 50%” vs “Tertiary CO2 injection EOR 60%”.
“OOIP 182,773,625,918 bbl
Primary Water Drive 40% 73,109,450,367 bbl
Secondary Waterflood EOR 50% 91,386,812,959 bbl
Tertiary CO2 injection EOR 60% 109,664,175,551 bbl”
i.e., how do you get more oil out than the Oil Originally In Place (OOIP).
1) What are the assumptions for Original Oil In Place OOIP?
2) How does Secondary Waterflood achieve 90% recovery of OOIP?
3) What are the assumptions for Tertiary CO2 EOR 60%? e.g.,
Is this Residual Oil Zones (ROZ) recovering oil below the conventional OOIP?
And/Or in separate along side recovery zones?
Has any of such tertiary CO2 EOR evidence been published for KSA?
E.g., see: Godec, M., Carpenter, S. and Coddington, K., 2017. Evaluation of technology and policy issues associated with the storage of carbon dioxide via enhanced oil recovery in determining the potential for carbon negative oil. Energy Procedia, 114, pp.6563-6578. https://www.sciencedirect.com/science/article/pii/S1876610217319975
PS Do any of those include the 500 ft thick “tar matt” layer mentioned by Matt Simmons in Twilight in the Desert p 174.
(I consider each of the CO2-EOR below conventional OOIP, separate EOR fairways, and this 500 ft thick tar mat, to be a different hydrocarbon resources from the OOIP, each of which could be modeled under a “Multi-Hubbert” analysis. e.g., see:
Höök, M., Tang, X. (2013) “Depletion of fossil fuels and anthropogenic climate change: a review” Energy Policy, 52: 797-809 URL: http://dx.doi.org/10.1016/j.enpol.2012.10.046
http://www.diva-portal.org/smash/get/diva2:561259/FULLTEXT06 )
The recovery rates were ballpark figures.
A 40% primary recovery rate is roughly the historical average for high-porosity, high-permeability, strong water-drive reservoirs, like Ghawar’s Arab-D. I’ve seen >50% primary recovery rates in the Gulf of Mexico.
The uplift from secondary and tertiary recovery methods is quite variable.
Waterfloods can push recovery rates to 60% and CO2 can take it up to 80%. I used more conservative numbers in order to match my estimates of OOIP and cumulative production and D&M’s 1p number (the most reliable of the 3 numbers).
To give a comparison, the North Sea coal seams contain up to 23 trillion tonnes of coal. Coal is oil that just hasn’t transitioned yet.
One tonne of coal produces about 2.5 bbl of crude, so the North Sea contains up to 57 trillion bbl of what is effectively crude oil, once you put it through a CTL plant. Ghawar is a drop in a bucket by comparison.
Crude from CTL is already pretty competitive, with a number of CTL plants in operation around the world today.
Anyone still talking about Peak Oil?
CTL and GTL are certainly Peak Oil work-arounds… But not really neccesary right now.
Newcastle
Now I fully appreciate the saying, “that’s like carrying coal to Newcastle”. I had no idea of the quantity of coal. Amazing. Hope I can find something online about the geology.
Abiotic is very reasonable to consider. Just look at Titan!
Methane is not oil.
Beyond that, methane in the atmosphere doesn’t mean that there are also huge amounts of methane in the crust.
The thing about Titan, is that just about everything appears to be made of methane and/or other hydrocarbon molecules.
If oxygen producing plants had evolved on Titan, there wouldn’t be any methane left in it’s atmosphere either.
I read about the immanent and drastic production decline of the Ghawar field back in 2005 or 2006, back when the US was producing about 5 or 6 million barrels per day ( and going down). Well, if I remember correctly, that didn’t happen 🙂
Nice work David, thanks very much for your time in posting this.
I’ve been tinkering with this for a couple of years. The D&M audit and bond prospectus provided the information I needed to finish up.
I did a couple of weeks consulting on the Hawiyah segment about 20 years ago. It’s a fascinating oil field to work on, incredibly complex at the pore scale and seemingly simple on the macro scale. Phenomenal geology in that part of the world.
It’s taken me three years to “unpack” a 30-year old 20 million bbl field in Ewing Bank with only about 30 wells and a dozen or so producing horizons. Fortunately it was an old Conoco field, so there was a systematic nomenclature…. I can’t even begin to think about what it took D&M to audit Ghawar. I think they had 60+ engineers and geo’s working on it. Ghawar is 100 times the size of Eugene Island 330, which was the largest oil field (BOE) in the Gulf of Mexico before the deepwater Mars field topped it… And Ghawar is 50 times the size of Mars.
I think D&M definitely earned their stripes on that study 🙂
David,
Excellent work. One of the best I’ve seen about Ghawar, and I’ve seen many!
David
Fascinating stuff, My thin belief in the power of solar renewables further diminishes.
A genuine, slightly off topic question spawned by your brilliant diagrams. I “get” tectonic plate movement and volcanoes spewing materials from the core. I get the layering of biological materials on land and sea turning into rocks and fossil fuels over time. I get the water cycle and nutrients on the surface tending to be washed down.
But my dumb question is how did all that solid material get on top of what is already there? The earth crust is 30-45km deep and we have drilled down for oil 10km. That implies there is 10km worth of biologial material on top. How does it get there and where did it all come from? Basically just volcanic activity?
The biological material for oil and most natural gas is mostly plankton and algae.
The most prolific source rocks are organic-rich (total organic carbon (TOC) >5%) marine shale formations, deposited under anoxic conditions. The conditions for source rock formation were most prevalent in the Jurassic and Cretaceous Periods…
Ghawar’s source rocks are an organic-rich Silurian shale formation.
David
Sincere thanks for the prompt reply and the new graph which prompts an extra question.
I was thinking in terms of the volume of basic molecules forcing the original biological materials 10km undergound through sedimentation. Over the last 200m years essentially the top third layer of the crust has been replaced with molecules that came from somewhere. Tectonic movements and surface activity spawning erosion I get but once that organic layer has settled into sediment where does the new organic matter get its molecules from? Nitrogen fixing and co2 from the atmosphere is what grows plants but where do those molecules come from?
Extra question-Given that temperatures and CO2 was higher in the Jurassic period when most oil source rock was formed, are we in effect refertilising the atmosphere by using fossil fuels? There is 11% more greenery on the earth over the last 40 years after all.
The answer to your first question would be like teaching a semester of sedimentary geology… I didn’t go into teaching for a reason… Well, several reasons.
The answer to your second question is yes. Does it mean that higher CO2 concentrations are entirely beneficial? Insufficient data.
Silly question. Why do they say “proved” instead of “proven”?
The reserves are proved by drilling and production…
https://grammarist.com/usage/proved-proven/
That said, people do also refer to reserves as proven… I use proved because that’s what the SPE and SEC call them.
David,
Part of my argument for abiotic hydrocarbons is the Horsehead Nebular.
How does the fossil theory explain this phenomena?
http://annesastronomynews.com/the-horsehead-nebula-is-a-cosmic-petroleum-refinery/
Jerry,
Just because you are very thoughtfull and considerate…
The Horsehead Nebula isn’t Earth. Setting aside, the speculative nature of such an analysis… it’s irrelevant to Earth.
Methane appears to be everywhere on Titan because Titan appears to be largely composed of methane and other relatively simple hydrocarbons… Earth isn’t.
David,
You think that botany, biology, chemistry, physics, and history
are different on earth than elsewhere in the universe? I
do not.
The atmosphere of every exoplanet that I have seen analyzed shows
hydrocarbons.
None of which is oil. Methane is abundant everywhere. Other simple hydrocarbons also appear to be present in at least trace quantities. Traces of octane have been detected at the Lost City hydrothermal vent. It’s not a matter whether it’s possible or not.
Oil is a mixture of several complex hydrocarbons and has to be produced from economically viable accumulations.
The Horsehead Nebulae is said to be a star incubator. “Dust” clouds
accrete, start to swirl, form stars, and if it is not a binary, the residue
then starts to form planets, some possibly proto earths.
Actually, the numbers are soo large that there are probably nearly
exact copies of earth are out there. The hydrocarbons of the dust clouds
are included in all planets, then physics and chemistry take over.
Methane, ethene, and acetylene are detected in Saturn’s atmosphere.
As gravity concentrates the ingredients, physics and chemistry take over,
and larger molecules are formed.
Earths original atmosphere is thought to include methane and carbon
oxides. Hydrocarbons were always here.
http://planetfacts.org/the-atmosphere-of-saturn/
https://www.bing.com/search?q=earth%27s+original+atmosphere+was+made+of&form=EDGEAR&qs=SC&cvid=45376093e3814d8f8f100448ef7f7af7&cc=US&setlang=en-US&elv=AQj93OAhDTi*HzTv1paQdnh5hUnG0l2BUXDSl3j7teLkzBXHBGG%21F%21kFJ7cYdZtAbbg05ecR8P98QFp6P1aHsXGhzjDFI4LWQ4414gQrs34J&PC=HCTS
http://planetfacts.org/the-atmosphere-of-saturn/