A new study has revealed how clouds are modifying the warming created by human-caused climate change in some parts of the world
Swansea University

A new study has revealed how clouds are modifying the warming created by human-caused climate change in some parts of the world.
Led by Swansea University’s Tree Ring Research Group, researchers from Sweden, Finland and Norway analysed information contained in the rings of ancient pine trees from northern Scandinavia to reveal how clouds have reduced the impact of natural phases of warmth in the past and are doing so again now to moderate the warming caused by anthropogenic climate change.
Even though northern Scandinavia should be strongly affected by global warming, the area has experienced little summer warming over recent decades – in stark contrast to the hemispheric trend of warming temperatures, which is strongly linked to rising greenhouse gas emissions. According to the study, temperature changes have been accompanied by an increase in cloudiness over northern Scandinavia, which in turn has reduced the impact of warming.
Mary Gagen, Professor of Geography at Swansea University, said: “The surface warming caused by rising greenhouse gases is modified by many complicated feedbacks – one thing changing in response to another – meaning that there are large geographical variations in the temperature of a particular place at a particular time, as the global average temperature rises. One of the most important, and most poorly understood, climate feedbacks is the relationship between temperature and clouds. We might think that, simply, when it is cool it is cloudy, and when it is warm it is sunny, but that is not always the case.”
The research team analysed tree ring records to find out what summer temperatures were like in the past, and how cloudy it was. Using their collected data, the team produced a new reconstruction of summer cloud cover for northern Scandinavia and compared it to existing temperature reconstructions to establish the relationship between temperature and cloud cover.
Professor Mary Gagen said: “Most people know that the width of a tree ring can tell us what the temperature was like in the summer that ring grew, but we can also measure other things in tree rings such as the isotopes of carbon and water that the wood is made from. Isotopes are just different types of an element, the amount of the different isotopes of carbon in the wood tells us how cloudy it was in the summer the tree ring grew. By combining the tree ring width and tree ring carbon measurements we built a record of both past summer temperatures and past summer cloud cover. Summer temperatures in Scandinavia have increased by less than the global average in recent decades because it also got cloudier at the same time, and that modified and reduced the warming. That turns out to also be the case back through time.”
Author Professor Danny McCarroll explained: “We found that over short timescales, increased cloud cover lead to cooler temperatures and vice versa in the past. However, over longer timescales -decades to centuries-we found that in warmer times, such as the medieval, there was increased cloud cover in this part of the world, which reduced local temperatures. The opposite being true in cool periods, such as the Little Ice Age.
“These finding are important as they help to explain the feedback relationship between cloud cover and temperature, which is one of the major uncertainties in modelling future climate. Understanding the past relationship between temperature and cloud cover in this part of the world means we can now predict that, as the global temperature continues to rise, that warming will be moderated in northern Scandinavia by increasing cloud cover. The next step is to find out whether the same is true for other parts of the world.”
Professor Mary Gagen added: “One of the main sources of uncertainty about future climate change is the way that clouds are going to respond to warming, cloud cover has a really big influence on temperature at the surface of the Earth.
“Clouds are going to be critical in modify warming of the climate. In some places, like Scandinavia, it turns out that the summer climate gets cloudier as the planet warms, in other places though it is likely that warming will be enhanced by a reduction in cloudiness which will make the surface of the Earth even warmer. What is really worrying is that climate models have shown that, if greenhouse gas emissions are allowed to continue until there is double or even triple the pre industrial amount of carbon dioxide in the atmosphere, then some of the most important clouds for cooling our planet, the big banks of oceanic clouds that reflect a lot of sunlight back to space, could stop forming altogether and this would really accelerate warming.”
###
The study, Cloud Cover Feedback Moderates Fennoscandian Summer Temperature Changes Over the Past 1,000 Years, is published in Geophysical Research Letters.
Public Release: 25-Mar-2019
In all countries without a doctored climate record, there is no observable warming. This is called regional variation. That is why they call it “global warming” and not “sometimes regional warming”.
Didn’t the vaunted Haruspex Keith Briffa already prove how unreliable Tree Ring Proxies are for divining temperature?
Yeah, the headline needs changed from
“Experts reveal that clouds have moderated warming triggered by climate change”
to
Pseudoscientists use imagination to prepare next excuse for less observed warming relative to forecasts
Donald Kasper
“In all countries without a doctored climate record, there is no observable warming. ”
Which countries in the world do you mean? Does, for example, Norway in Northern Europe, have a ‘doctored’ climate record?
Linear estimates out of the average of all GHCN daily data for Norway, in °C / decade:
– 1880-2018: 0.29 ± 0.01
– 1979-2018: 0.53 ± 0.06
Or did you rather think the inverse, namely that all countries showing warming have by definition ‘doctored’ climate data?
Bindidon,
Thank you for paying proper attention to significant digits and uncertainty. Too many — even published researchers — do not.
James Schrumpf
You’re welcome. But… I think you misunderstand the problem.
If you generate data to be processed by others combining it with plenty of their own and possibly even other sources, and keep only 2 digits after the decimal point, your users soon will run into significance problems.
Your request would in fine mean that each researcher has to think of rounding its own data before publishing.
This is the reason why e.g. UAH’s Roy Spencer keeps a 3-digit version of his data near the ‘official’ 2-digit stream.
Bindidon,
I don’t see the problem. A researcher should publish to the significant digits that his data allows, not just to two decimal places all the time. NOAA’s daily temps are in tenths of a degree, so in this case that limits the published results to one decimal point, according to everything I’ve read lately on dealing with significant digits and uncertainty propagation. I’ve found references from multiple physics, chemistry, etc., departments at universities from all over, and they all make the same point: the precision of the result is limited by the least precise measurement in the calculation. In this case, it’s temperatures to one decimal point.
If more precision is needed, then more precise instruments should be put in place. I don’t know the resolution of the UAH’s satellites, but I imagine they are better than tenths of a degree, so his precision is probably warranted.
With an average high temperature year-round of 8 C degrees and an average minimum temperature year-round of -1 C degrees, the good folks in Umeå, Sweden must be counting the days until Global warming arrives.
We might think that, simply, when it is cool it is cloudy, and when it is warm it is sunny, but that is not always the case.”
===========
Nope, that only holds in daytime. At nightime it is reversed.
Tree rings are like reading tea leaves. They can deliver any answer you want to believe.
What they are inadvertently admitting is that water universally regulates this planet’s various and many regional climates by changing states appropriately to avoid extremes of atmospheric temperature, and because of its sheer volume and dominance of the world’s surface, provides a solar-heated hydronic circulation system to further regulate the atmosphere, with its heat content ratio of around 1000/1 over the atmosphere.
During the winter it is usually warmer when cloudy than when clear.
nicholas tesdorf
You seem to know by far less about temperatures around you than about architecture and design. Here is some info concerning your Umeå, processed out the GHCN daily data for the station
SWE00140174 63.7900 20.2900 14.0 UMEA_FLYGPLATS (1965-present)
“With an average high temperature year-round of 8 C degrees and an average minimum temperature year-round of -1 C degrees…”
Here at least you are right. Averages for 1965-2019:
– TMIN: -1.3 °C
– TMAX: 7.4 °C.
But when writing
“… the good folks in Umeå, Sweden must be counting the days until Global warming arrives.”
it becomes evident that like many people you confound ‘average temperature’ and ‘trend’.
Linear estimates in °C / decade for TMIN:
– 1965-2018: 0.33 ± 0.07
– 1979-2018: 0.36 ± 0.11
… for TMAX:
– 1965-2018: 0.41 ± 0.06
– 1979-2018: 0.59 ± 0.09
https://drive.google.com/file/d/1Il8EjV4tuFBz1Vzxl0CMv1vaBtgSfU6N/view
Top 10 list for absolute temperatures since 1965:
TMIN
1988 7 13.72
2018 7 13.02
1973 7 12.82
2003 7 12.58
2010 7 12.47
1997 7 12.39
1972 7 12.32
2011 7 11.98
2014 7 11.95
1991 7 11.69
TMAX
2018 7 25.45
2014 7 25.14
1973 7 24.24
2003 7 24.09
1997 7 23.64
1972 7 23.63
2006 8 23.38
1994 7 23.28
2002 8 23.12
2005 7 22.24
And let me guess that Umeå isn’t the place in Sweden where this nice little warming is the highest…
±
You folks need to take your heads out of the snow. Your biggest concerns will not be warming or cooling into the future. It will be the Balkanization your globalist politicians created. Asks those in Serbia, Syria, etc… how that worked out for them.
You’d be better off spending all the GW monies on figuring out a way to keep your next generations safe from being enslaved. Just my opinion of course and like always, use your time wisely.
It is interesting that the paper attributes the cloud cover to anthropogenic global warming. Henrik Svensmark might be inclined to attribute cloud cover to extraterrestrial factors: the sun’s magnetosphere and the density of the flow of cosmic rays which seed lower atmosphere clouds. The paper bases its conclusions on un-examined assumptions, while Svensmark has done solid research to support his position. It took Svensmark 10 years to get published. It took this paper no time at all, because it echoes the CAGW narrative in its assumptions.
I think you are right on, Edward. They start with a false CAUSE, then jump to EFFECT, then link them together via FEEDBACK. That is , they start with CAGW via increasing CO2, then interpret isotope data in the trees to show increased cloudiness, then use feedback to relate cause and effect. Wait a minute, don’t clouds sometimes, like often, produce rain or snow? What about increased soil moisture?
How does CO2 ratio record “cloudiness” , that’s a new one me. What’s the story behind that?
I was wondering that as well.
‘Most people know that the width of a tree ring can tell us what the temperature was like in the summer that ring grew’
Except that this is not true which is why Mann grafted on the instrument records at the end of the hookey stick as the tree rings showed cooling. Tree rings are a better proxy for the amount of moisture available.
Tree ring widths are primarily affected by both humidity and temperature, so it is a pretty useless as a proxy for either one. This whole thing is pseudo-science. The fact that the authors confidently state “most people know” means they are either sadly uniformed or deliberately playing along with Mann and Jones’ scientific forgeries.
Tropical wood often shows two rings per year.
…researchers from Sweden, Finland and Norway analysed… the rings of ancient trees… to reveal how clouds have reduced the impact of natural phases of warmth…
These people can deduce information on clouds from tree rings? Really?
They might just as well analyze goat entrails.
Or why don’t they just analyze their own stools?
They truly are witch doctors.
I am a little surprised that “The Team” allowed this to be published. I gives credence to the existence of both the Medieval Warm Period and the Little Ice Age, something that “The Mann” has tried so desperately to scrub from existence
Ron Long
You are on the right path. Consider any given temperature. Keeping the energy content (enthalpy) the same, then increasing the water vapour content, reduces the temperature. The entire conversation about “temperature” is an arrow off the mark from the start.
If the temperature remained constant and the humidity went up or down, the enthalpy goes up or down. If the air sheds rain, the temperature rises because of the heat released when the water vapour condenses. This is the basic physics of gases.
Right from the get-go they are using the wrong metric to establish “warming”. Temperature alone has no real meaning – it has to be combined with humidity to get the enthalpy. Temperature is an indicator metric, not the fundamental quantity sought. There is an awful lot of time wasted on this matter.
From the article above “…strongly linked…”
…only in their minds.
It´s much easier get funding when this anthrofactor is mentioned. There´s been many researchs where CAGW is mentioned, but in many of them it´s very difficult to find any connections, or there is maybe some irrelevant sentence which includes the magic words.
Researchers are not stupid. They find ways to funding and maybe the easy way is to mention GW – the most popular issue on the table.
There is another hypothesis that predicts increases in cloud cover due to increased CO2. Put forward by Dr. William Gray it essentially predicts an increase in the hydrology cycle. More evaporation, heat transport by convection, condensation and therefore more cloud creation.
This is a natural negative feedback to warming. It isn’t a temporary situation which is what most warmers want to believe. It essentially negates warming during the day and during summer when we would see the warmest temperatures. That leaves only warming at night and during winter which would be completely beneficial.
Indeed, one of the problems with CAGW models is that they treat water vapor as a purely positive feedback. At low levels, it probably is a net positive, but as water vapor levels rise, so do cloud cover and the incidence of thunderstorms and tropical storms that transport heat rapidly from near ground level to the tropopause, making water vapor a net negative feedback at higher levels.
They had to use H2O to amplify the tiny effect of CO2, so they can’t admit they were wrong about this, or the whole thing falls apart.
As Willis Eschenbach has pointed out here on this blog, water vapor in the atmosphere tends to act as a self regulating thermostat that keeps the Earth not too hot, and not too cold, but just right:
https://wattsupwiththat.com/2010/07/24/willis-publishes-his-thermostat-hypothesis-paper/
Richard M
“It essentially negates warming during the day and during summer when we would see the warmest temperatures. That leaves only warming at night and during winter which would be completely beneficial.”
I agree – with the exception of all places above 60N, these people there have increased problems with whichever kind of warming, be it at night or not. Permafrost thawing isn’t for joke.
Evaluating temperature minima and maxima shows here and there minima trends recently crossing those for maxima.
I note they inserted the first two paragraphs & the last sentence to get published; If you remove them, the paper confirms what we’ve known for century’s …
“We found that over short timescales, increased cloud cover lead to cooler temperatures and vice versa in the past. However, over longer timescales -decades to centuries-we found that in warmer times, such as the medieval, there was increased cloud cover in this part of the world, which reduced local temperatures. The opposite being true in cool periods, such as the Little Ice Age.”
“as the global temperature continues to rise, that warming will be moderated by increasing cloud cover.”
So true. As I sit on the beach in Grace Bay. I feel the short term cooling everytime a cloud rolls by.
Its as if the average person can understand that more clouds = cooler day.
Yes. And in winter = warmer day.
No, it won’t! The problem is that clouds are HEATING THE PLANET, so it would a positive feedback.
Of course it does not matter, since the “GHE” is due to clouds in the first place, which means CO2 will not cause any significant warming..
Leitwolf,
technically, the GHE is considered to be due to radiative gases such as CO2 and H2O in the IR transparent N2 and O2 atmosphere. But a square meter of cloud reflects about 500 watts of sunlight, and a square meter of pre-industrial vs. present day CO2 laden air only causes a couple of watts of ground level absorption, so your observation is not without merit.
The question is not how much sun light clouds reflect, but how much LWIR. I guess this little video is quite inspiring..
How did I copy that link?!?! Anyway, it is not what I intended. Rather it was this…
Sorry … I linked a video list rather than the video. Ok .. here it is..
Leitwolf,
Clouds absorb LWIR, then reradiate it.
This is different than reflecting it. If clouds were reflective, your infrared thermometer gun aimed at the clouds would read ground temperature by reflection. Instead it reads the cloud temperature, often around 0 C at temperate latitudes.
And no, clouds don’t warm the Earth, clouds just cause the ground to be less cold than it would be with cold open sky above. Cloudy nights are statistically warmer for this reason. But, saying the clouds warm the Earth would require the clouds to be warmer than the Earth.
Sorry, seems I can not post a video here. I have no clue why that is..
I think it is definitely reflecting. Why so?
1. The optical properties of water are very similar with regard to visible light and LWIR respectively. I know that because I had to study Fresnel equations to calculate the hemispheric emissivity of water. So while clouds will absorb some LWIR, most of it will be reflected, just like with visible light.
2. In the info to the video I have linked there is time and location. So I looked up weather data for this too, and I can tell you that temperatures were hardly above 5°C, almost the temperature these clouds have according to the camera. Up in the air however temperatures have to be lower, so the clouds appear way “too hot”. Except if they reflect surface IR..
Letwolf, you are partially correct. “Observations of Cloud infrred Effective Emissivity” by Cox shows effective cloud emissivities of between .5 to .65. Reflection + Emission + Transmission = 1 so there is room for some reflection……
Sheep entrails have nothing on tree rings. You can divine almost anything from tree rings these days if you hire the right haruspex, er, “climate scientist”. From the paper, this gem:
“It has become possible to produce reliable reconstructions of regional cloud cover, using stable carbon iso- topes (δ13C) from tree rings”.
Uh huh, suuure.
They conclude that the reason scandinavian countries aren’t experiencing warming is because of cloud cover, because they are absolutely certain that humans are warming the planet. Just not scandinavia.
“haruspex”. I learned a new word today! Now to go use it in a sentence.
You’ll have ample opportunity. Anytime an extraordinary claim is made based on climate models (virtually all of them are derived from climate models), which are reported almost daily now by the gullible and unquestioning media, you can call the “scientist” making the claim a haruspex. The massive corpus of studies relying on the CMIP models are the 21st century equivalent of haruspicy. And—you guessed it—the models themselves are the entrails. The religious fervor with which their proclamations are received by the acolytes of anthropogenic global warming alarmism is real and invincible to facts and data, but we must keep trying.
Exactly.
Pfft.. Not possible even if they use pixie-dust isotopes and Mannian AlGoreithms. The whole paper sounds like a desperate plea for more slush funding to feather their nests before they get fired, tarred and feathered.
Yes, exactly! To first order, plant growth is dependent on available energy ( sunlight, ambient temperature), available nutrition sources (bioavailable minerals in the soil, CO2 and O2, water/humidity, and absence of disease.
I’m really wondering how the listed researchers were able to isolate “atmospheric cloudiness” to the exclusion of all of these other primary factors.
Besides this, how were the researchers able to distinguish—on a given sample containing tree rings dating back decades to hundreds of years ago— how the growth rings were affected by “cloudy skies” versus shading from nearby trees that were competing for the same sunlight.
“Clouds moderate warming” – well, I always knew that! I noticed as a child.
I’ve noticed that the absence of clouds at night lead to cold temperatures. I wonder what tree rings say.
It’s complicated. Clouds at night help trap heat, but clouds during the day block sunlight. So just knowing there are a lot of clouds doesn’t tell us much.
It helps explain why the record shows more warm anomalies among nighttime low temps than daytime high temps of recent.
But the AGW conjecture is nothing but science fiction. Added H2O to the atmosphere has a net cooling effect as evidenced by the fact that the wet lapse rate is significantly less than the dry lapse rate. This is all well known.
What does this mean? “meaning that there are large geographical variations in the temperature of a particular place at a particular time”
By the way, I thought that tree rings was crappy at measuring temperatures, so how can they in any usefull way measure clouds?
Since 2C is catastrophic warming it obviously means that if you are in Stockholm you shouldn’t travel to Gothenburg where it could be 2C coolers as this would bring about all manner of catastrophes. (Don’t tell the Swedes though)
The article has open access here:
https://agupubs.onlinelibrary.wiley.com/doi/full/10.1029/2018GL081046
What is valuable is their δ¹³C reconstruction regional dataset.
IF it truly reflects cloud cover, then it leads to a trivial observation. Cold periods have a less active hydrological cycle with reduced cloud cover and reduced precipitations, and warm periods have a more active hydrological cycle with increased cloud cover and increased precipitations. This has been known for centuries and no other mysterious processes need to be invoked.
Thanks for the link. Don’t know why Eureka could bust their AAAS and provide that.
There is an SI but you have to dig into the text to find it.
From the SI:
I love it. To do something you use a method and reporting it produces a methodology ( a study of the method ). We have now come full circle. The method you use is incorrectly called a methodology and is reported in the “methods section” ( aka the methodology ).
The methods used to invoke C-13 isotope’s reflection on climate is:
“offset-pool plus Join-Point” and “Regional curve standardization” – AKA lying with statistics. Basically if you look at the details of the method you see that the data don’t agree so they devised a statistical torture in order for them to conform.
They had me until I saw the name of the research group. Cool = cloudy means they have never been to a dry climate.
I cannae immediately recall, what is the game where ‘critter things’ keep jumping/popping up and you’re tasked with slapping them back down?
Is it a kiddies game of fun-fair ‘thing’ Like muppets but not at all like muppets
Along those lines *and* though it hurts deeply to whack down these sensitive, caring, intelligent, educated, studious, conscientious and hard working scientists who bear Completely No Resemblance to Muppets, even I cannae resist this one..
https://www.nationalgeographic.com/environment/2019/03/trees-release-methane-what-it-means-climate-change/
No no no, I DO NOT have a “Bercow Smirk” on my face right now.
😀
Peta of Newark: The game is “Whack-A-Mole,” and you’re exactly right.
Peta;
You are thinking of the game, “Wack-A-Mole”. That is the original, I believe. Other critters have been used to suit different themes.
A child will tell you that if you stand outside in the sunny warmth of a spring day or the heat of summer – as soon as a cloud goes across the sun, the temperature drops noticeably.
Of course, clouds are ‘reducing anthropogenic global warming’ – you have to laugh, don’t you?
Professor Mary Gagen claims that ‘most people know that the width of a tree ring can tell us what the temperature was like in the summer that ring grew’ – exactly the same failing as Mann’s tree ring paper – no mention or discussion of the biochemistry of a tree and what factors affect ring width.
Enzymes for example work best at whatever temperature is optimal for a given enzyme, but anyone who’s worked with them knows that there is a limited range either side of the optimum when the enzyme will still work. The notion that temperatures of years ago can be accurately determined to within a fraction of a degree (and it’s these claimed fractions which are used to drive the global warming scare) by measuring tree ring width makes no sense whatsoever.
Do any of these ‘climate change’ academics ever think beyond their own blinkered world view?
to me this is just an admission that clouds play a larger role than any human emitted CO2 driven forcing.
It’s all wrapped up in arm waving and is utterly dependent on an assumption.
They set out with the idea first, how to attack natural variability. Clouds are a large part of natural variability.
So it works like this, what natural variability you can disappear or deny (eg solar activity is far more than TSI) then the effects of all this natural variability can be blamed on humans.
The solar influence for example is far more than TSI, or the sum of TSI in effects on earth, from atmosphere to crust, all of the influence on earth’s climate these things have, those effects are currently being blamed on human emissions of CO2.
A few years ago I collected all the yearly rainfall records and all the yearly temperature records I could find for Alice Springs, Central Australia, which unfortunately “officially” only go back to 1942. My collection went as far as 2011. The two wettest years on record, 1974 and 2010, were also the two coolest. The average rainfall for the two years respectively was 782.5 and 769.6, and the average temperatures 26.6 C in both years — remarkably close. This was interesting because we have a very dry climate with a big temperature range on any given day and the minimums were higher than usual in these very cloudy years. Obviously, though, the maximums were also clipped, and this appeared to have a more significant effect on the average than the higher minimums. Conversely, this summer, in which there has been almost no cloud or rain, has been very hot. 2010 was recognised as a La Nina year and 1974 was also possibly one, so there may have been a greater prevalence of cooler southerly winds. But there was no year between 1942 and 2011 with more than 350 mm of rainfall that had a temperature greater than 28.9, while there were 15 years with maximums of 29 deg or over in which the rainfall was less than 350 mm.
The relationship between tree ring width and temperature seems to be accepted science. Many people have observed that many other factors influence tree ring width, even more than temperature.
It was noticed that plant growth had been enhanced in the vicinity of Mt. Etna before the 2002 eruption.
You can’t just assume that tree ring width is an indicator of temperature. Tree ring proxies seemed to indicate that the 20th century was cooling which is why Dr. Mann had to splice instrumental temperatures onto the proxy record in order to produce his hockey stick.
Don’t most volcanoes start emitting more CO2 shortly before erupting?
Not only that but there is a natural piezoelectric effect which causes things including apparitions and UFO sightings. link Ionized air stimulates plant growth. link
It’s entirely possible that pre-volcanic activity causes ions that stimulate plant growth. The possibilities are endless. Plants are pretty crazy and simplistic explanations like temperature vs. ring width, are way past dangerous.
The idiotic title made me suppose that this nonsense came from EurekAlert! so I scrolled to the bottom and …
bingo !
EurekAlert is indeed a plentiful supplier of crap.
link People have noticed.
The alarmist, activist AAAS American Assoc. for the Advancement of Science, NEVER provide a valid link, reference or citation to the papers they claim to be reporting. I wonder why.
Wouldn’t the “advancement of science” indicate the need for proper citations and allowing interested readers to get the full story from the academic paper , rather than some media studies undergrad, climate activist who probably has no scientific training whatsoever but is a student of spin and “communication”.
Thanks for the link. Read it.
It’s actually much worse than I thought (and I’m serious).
What number of excuse for all their failed predictions/projections/seance findings are they up to now? I lost count a while back, not that it really matters.
I have always understood that clouds, their formation etc. is the Earths automatic thermostat. A warmer Earth, thus more evaporation, thus more clouds, result a cooler Earth.
True cosmic rays may well play a part too.
MJE VK5ELL
No, because CLOUDS ARE WARMING THE PLANET, not cooling it. Just look at the image below to understand, that clouds have a much stronger positive forcing than the 30W/m2 the IPCC claims..
With about 80-100W/m2 in cloud forcing plus another 35W/m2 due to surface emissivity ~0.91 this explains most of the wrongly assumed “GHE” o 150W/m2.
With clouds, generally, comes rain. Rain brings down cooling. Reaction: ground heat rises, thus more susceptible to being transmitted to the “cosmos”. No?
Public Warning: This is a press release from … Geographers (not scientists), a catch-all word for anyone wanting sciency street-cred for their mostly left wing propaganda. Proper scientists would have simply reconstructed temperature (yeah-right) and cloudiness (even more yeah-right), gone on at length about uncertainties and the divergence problem, issued stern disclaimers, and left if that for the “theoreticians” to make fools of themselves.
So, despite their study claiming to have found a negative cloud feedback, having stated that clouds are poorly understood ( and thus necessarily poorly modelled ) , they end up with a little citation of the thermagedon mantra to ensure getting published in GRL.
BTW , their study , based of the flawed assumption that tree ring width is a function of a single variable is probably best ignored. Ask Keith Briffa about why his colleges had to “hide the decline”.
We lost a very large white oak during the last hurricane and decided to count the rings at the base to see how old it was (168 yrs). The rings were very tightly packed up until 1923, when they instantly became much wider and remained so to the time it fell.
Our neighborhood was developed in 1923.
Which probably meant the white oak suddenly had more sunlight, water, and soil nutrients, plus the available CO2 was being “shared” less – all due to competing trees being removed. So, nothing to do with temperature at all. But we can’t let that stand in the way of a good climate scare “story.”
Woods really do suck up a lot of water. I have a creek that goes dry sometimes in summer during the day, but is flowing again at dawn. I’m sure if I cut down most of the trees it would not go dry like that.
I think Rush described that scenario, but I can’t remember if it was the oaks or the maples that won.
No summer warming? Sounds like GH gases doing their thing, warming the cold periods, not the warm. CO2 leads to a reduction in extremes of temperature. Oh, and that hemisphere average is probably doctored. ..
So are they claiming they now know how to include the effect of clouds in their climate models? Or are they just making another excuse for the poor quality of their model’s output?
No shyt Sherlock ! Hands up those who have never experienced a cold sunny day. Jeez, who do they thing they are talking down to ?
“clouds have moderated warming” … period!
Clouds have an overall warming effect on the planet. It is the basic mistake over the “GHE”, that we look at clouds just as “sun blockers” and largely ignore their reflection of LWIR back to the surface. This is a far more effecient process to contain heat than absorption and re-emission like GHGs do.
https://de.scribd.com/document/369953233/The-Net-Effect-of-Clouds-on-the-Radiation-Balance-of-Earth-2
A simple glance at LWIR emissions should make obvious how clouds are massively reducing emissivity..
In the tropics morning cloud formation EMERGES when water surface temperatures rise sufficiently. These clouds curtail the surface warming RATE significantly when they form. Thunderstorm cells and lines of storms frequently form thereafter leaving the surface temperatures LOWER than the temperatures that caused the storms to emerge. By nighttime, the cloud cover has usually dissipated…so relatively little positive feedback overnight. IN THE TROPICS, clouds are massively negative feedback elements. It has several degrees of negative effect that’s easily seen in the daily surface water temperature rise charts. Then at night, the usual absence of clouds has a relative cooling effect also. Intertropical diurnal temperature plots show clouds to be MASSIVELY negative…when and where temperatures get high enough to trigger cloud formation. This is all driven by water temperatures…hardly responsive at all to CO2 concentrations. Higher temperatures = more negative feedback. Lower temperatures = less negative feedback. This is active temperature regulation in the region where the sun’s radiation impacts earth the most. And it’s got next to nothing to do with CO2.
Clouds ARE both positive and negative feedback elements. Mostly negative during the day and only positive during the night. So the complex “when and where” of clouds (including altitude – higher clouds are mostly sun reflectors to space) makes all the difference. Daytime clouds frequently do not persist overnight. Nighttime cloud cover frequently “burns off” through the morning hours.
Further, daytime clouds reflect sunlight back into space across nearly the entire spectrum. Clouds reradiate back to earth only in the IR.
In this study, they appear to describe regions where negative feedbacks predominate.
The jury us still out on the entire earth cloud effect balance…as in the science is not settled on ONE OF THE MAJOR earth energy budget elements.
“IN THE TROPICS, clouds are massively negative feedback elements”
Obviously not, as IN THE TROPICS clouds are positively correlated with temperatures. And that is not a theory, it is an observation.
It may be an observation, but the question is which is “cause” and which is “effect.”
Sure, correlation does not mean causation. Yet it will be very difficult to explain why it is warmer with clouds, if they were “MASSIVELY negative”. I mean that is next to rain, which actually cools the surface and is falling from clouds. But that is not radiative forcing.
If you actually look at average temperature of many places on the equator it is the DRY SEASON that is cooler and the WET SEASON that is WARMER, i.e. Galapagos Islands.
Leitwolf is correct, and the most visible example is in the net Ceres radiation measurements. Where the descending legs of the Hadley cells create dominant high pressure which leads to cloudless skies, the planet loses more heat into space than it receives.
Leitwolf,
Thank you for the link to the “scribd” article.
I am going to download that and will need to go over it several times. It makes a lot of sense after the first reading.
I will be installing a heavy rusty steel plate in the ground in my yard alongside a bare dirt spot along with a small steel tube to insert a thermocouple for temp measurements of soil @ 2″ depth. Along with an IR ‘thermometer’ I will be checking the temp of lower level clouds as well as the plate/ground and surrounding grass.
Any suggestions as to an inexpensive ‘data logger’ for the ‘thermocouple’ would be appreciated.
I, like the author of the scribd link, just can’t get my head around the consensus view.
Further to my comment above, those interested in the greenhouse effect should read the Weekly Climate and Energy News Roundup #353 here on WUWT posted ~ March 25, 2019. There is a nice summary early in the publication that goes a long way for an initial understanding of greenhouse gases.
Water in all its forms IS THE ELEPHANT in the room. Mix that with phase changes, the lapse rate and atmospheric pressure, and its interaction with LWIR as well as shortwave and visible radiation and you gotta really want to know to really dig in! It’s worth the journey for the intellectually curious.
Leitwolf ,
The time is coming that the radiative aspects concerning clouds will be a hot topic here on WUWT. It will most likely be a cat fight. I hope it will be moderated and using averages, global, diurnal, or any other blending and obfuscation of the processes involved is going to called out. On another note, I would like to question the author of the link you provided on several aspects of his paper but a sub-thread is not the place for it.
Stay tuned as the day is coming for this discussion. That one size fits all with regards to clouds is misleading, to say the least.
“I would like to question the author of the link you provided on several aspects of his paper but a sub-thread is not the place for it”
Well, since it is me, just ask and tell how and where..
Any “expert” would know that clouds ARE a response to any attempt to warm the planet.
Has the cloud cover gone up?
@Leitwolf and they reduce penetration of illumination more, not to mention they’re basically made of heat and water and emit that heat in all directions as well.
Err, is that not what Eschenbach said?
Read his Thunderstorm Thermostat Theory, it is on the web.
Ralph
In a previous article, I summed up current climate change science with one simple equation:
change = increasing CO2
After reading this article, I realized that there is another equation that I overlooked:
no change = increasing CO2
Modern climate change science in two simple equations. Or perhaps there is another equation:
good ≠ increasing CO2
Perfect! All the math you need to be an official climate scientist!
After reviewing fungal growth on my foot, I was able to determine the cause of the big bang. Do not ask me how I was able to correlate the two events, I just did.
How the hell do you use tree rings to determine cloudiness?
You could be on to something. Whenever I stub a toe I let out a big ouch.
In the tropics morning cloud formation EMERGES when water surface temperatures rise sufficiently. These clouds curtail the surface warming RATE significantly when they form. Thunderstorm cells and lines of storms frequently form thereafter leaving the surface temperatures LOWER than the temperatures that caused the storms to emerge. By nighttime, the cloud cover has usually dissipated…so relatively little positive feedback overnight. IN THE TROPICS, clouds are massively negative feedback elements. It has several degrees of negative effect that’s easily seen in the daily surface water temperature rise charts. Then at night, the usual absence of clouds has a relative cooling effect also. Intertropical diurnal temperature plots show clouds to be MASSIVELY negative…when and where temperatures get high enough to trigger cloud formation. This is all driven by water temperatures…hardly responsive at all to CO2 concentrations. Higher temperatures = more negative feedback. Lower temperatures = less negative feedback. This is active temperature regulation in the region where the sun’s radiation impacts earth the most. And it’s got next to nothing to do with CO2.
Clouds ARE both positive and negative feedback elements. Mostly negative during the day and only positive during the night. So the complex “when and where” of clouds (including altitude – higher clouds are mostly sun reflectors to space) makes all the difference. Daytime clouds frequently do not persist overnight. Nighttime cloud cover frequently “burns off” through the morning hours.
Further, daytime clouds reflect sunlight back into space across nearly the entire spectrum. Clouds reradiate back to earth only in the IR.
In this study, they appear to describe regions where negative feedbacks predominate.
The jury us still out on the entire earth cloud effect balance…as in the science is not settled on ONE OF THE MAJOR earth energy budget elements.
“Mostly negative during the day and only positive during the night.”
High Cirrus cloud is +ve 24/7.
More LWIR is back-radiated than SW is reflected …..
http://www.aos.wisc.edu/uwaosjournal/Volume28/Hang_MS.pdf
“Cirrus clouds exert a net warming effect in both hemispheres, but
especially in the mid latitudes where the radiative effect reaches 7 W m-2”
Well as a contradiction to this latest years cloudiness and warming goes hand in hand.
I do not contradict the paper but see another cause this time-SO2
We have reduced SO2 since 1980. Now it is less than 10% of what we used to emit -thanks to clean air act.
No doubt true in the US and Europe. Just the opposite in China, India and Africa.
Of course it does, as clouds are WARMING the planet. We actually cause some global warming by seeding the atmosphere with contrails.
Leitwolf: bear in mind that those contrails are typically at around 35,000 feet – near enough to just discern the aeroplane at the front – and the temperature up there is around -40 to -50 degrees Celsius.
Contrails are warming the planet ? Yet another scary story!
@Leitwolf, I can’t take you serious if you don’t provide any information as to how you get to your conclusions. My alarm bells go off when some one uses random caps-lock in a sentence and replies on almost everyones comment. This comes across as activisme and not trying to use arguments and have a civil conversation on a topic. Most people are here to learn and not to be mislead.
Don’t take it personal and use this feedback I gave you to your advantage.
I posted it already above..
https://de.scribd.com/document/369953233/The-Net-Effect-of-Clouds-on-the-Radiation-Balance-of-Earth-2
Clouds moderate temperature swings instead of enhancing them as all the models assume.
Interesting.
I wonder how long until the models are adjusted to add in this new data?
“Using their collected data, the team produced a new reconstruction of summer cloud cover ” ?
Tree rings can tell what the cloud cover was in the past ?
ROTFLMAO…..
Maybe the reason Scandanavia has less warming is they have more dense, more complete temperature records that are resistant to in-filling compared to places like Siberia, Alaska, and No. Canada?
I’ve looked at clouds from both side now:
So – H20 – the most plentiful greenhouse gas, is in fact, a moderating influence.
PREVENTING extremes.
I seem to remember saying this before.
Climate “Whack-a-Mole” continues.
It makes sense that warmer temperatures lead to more cloudiness. This will have the effect of moderating temperature extremes throughout the day. It will generally be cooler during the day, and warmer night. Now they just have to explain why this is bad.
clouds have moderated warming triggered by climate change
That has a familiar ring. Where have I read it before? I wonder.
“…triggered by ‘climate change’…”
WARNING! WARNING! ASSUMPTIONS AND BULLSHIT DETECTED!
AGW is not Science: “…triggered by ‘climate change’…”
WARNING! WARNING! ASSUMPTIONS AND BULLSHIT DETECTED!
The wording could be improved. The “warming” is the “climate change”. Climate changes in the past, the focus of the paper, have included alternations of warming and cooling.
This is concordant with other results showing that (a) rainfalll increases with warming (O’Gorman et al); and (b) lightning increases with warming (Romps et al — the lightning change representing a tiny fraction of the increase in net transfer of energy from the surface.)
So, the shorter version is, “The function of clouds as an aspect of climate continues to befuddle Warmists and their models.”?
Ferd wrote:
We might think that, simply, when it is cool it is cloudy, and when it is warm it is sunny, but that is not always the case.”
===========
“Nope, that only holds in daytime. At nightime it is reversed.”
I have felt like a stuck record saying exactly this on this site. Even obviously intelligent contributors here continue to ignore it. I have learnt it through working outdoors over the last 50 years. One man’s observations don’t count for much.
Crazy that one simple fact has to be repeated: At any one time half the world is in shade. Clear skies cool rapidly at night. Cloudy skies hold heat at night. So many intellectuals are blinded by detail.
Cheers
M
Sigh.
So once again, tree rings tell us temperature? NO, They don’t. Tree rings tell us how much that specific tree grew over that specific year in that specific place, and many things impact this growth such as sunshine, ground water, minerals, humidity/wind-speed, and yes – temperature.
And now an alarmist has discovered that cloud cover varies, and this affects temperature? Great, welcome to the 5th grade science level.
And their conclusion is that man-produced CO2 is causing increasing cloudiness in their specific country, but that the models tell us that clouds will stop forming if we don’t do something now? This is not even rationale, let alone scientific. Lots of things could be causing the increase in cloudiness (assuming they got that measurement right) – so let’s start by going through this list and ruling them out before jumping to a conclusion.
Models can’t predict cloud formation 1 year into the future, let alone 50 years. Why would anyone then jump to the conclusion that because the models say cloud formations will decrease it is suddenly going to warm in this place that isn’t warming now. Perhaps, just perhaps the Sun’s activity is driving increased cloud formation? Perhaps low level clouds will help to warm this area? Perhaps in 50 years they may finally have the models producing useful predictions?
This thing call CO2 can do just about anything. Just ask a climate alarmist. Amazing indeed.
Joel O’Bryan
“Maybe the reason Scandinavia has less warming is they have more dense, more complete temperature records that are resistant to in-filling compared to places like Siberia, Alaska, and Canada?”
I’m wondering how a person manages to inform us so accurately about solar irradiance facts while believing in such a nonsense like above.
Linear estimates OUT OF ghcn DAILY, for Denmark, Iceland, Sweden, Finland and Norway, in °C / decade, for 1949-present and 1979-present (Iceland had no valuable data before 1949)
Denmark
– 1949-2018: 0.07 ± 0.02
– 1979-2018: 0.28 ± 0.05
Iceland
– 1949-2018: 0.18 ± 0.02
– 1979-2018: 0.56 ± 0.05
Sweden
– 1949-2018: 0.24 ± 0.03
– 1979-2018: 0.50 ± 0.08
Finland
– 1949-2018: 0.30 ± 0.04
– 1979-2018: 0.58 ± 0.09
Norway
– 1949-2018: 0.32 ± 0.03
– 1979-2018: 0.58 ± 0.05
A good supplement to this data would be: how many stations per km² land surface were active in which years!
That might pretty good explain why Denmark keeps so ‘cool’…
Bindidon,
I’m curious as to what s/w you use for your trends and uncertainties. Excel? R? Something else entirely? I use both of the former, with some Oracle database-ing added in.
James Schrumpf
It depends on which source I process. Some of them can be directly entered into spreadsheets; some require huge preprocessing (especially GHCN daily with about 30 GB data). In that case I use sometimes GNU’s scilib.
It was a question, not a statement. Note the “?”.
I admitted no knowledge about the nature of the Scandanavian surface records.
And last time I checked, Iceland is not considered part of Scandanavia, nor is Greenland, even though Denmark administers it I think.
Joel O’Bryan
Each European knows that Iceland doesn’t belong to Scandinavia. I added it because so many Americans think so.
Scandinavia = Sweden + Norway
To include all the nordic countries the term “Norden” (literally “the North”) is used locally. This includes Finland, Sweden, Denmark, Norway, the Faeroes and Iceland (but not Greenland)
it looks like 3 of the 5 records would have negative values for the periods of 1949 – 1979.
Curious what the same records would indicate for the period of 1919 – 1949 and how that rate of warming compares to the 1979 – 2019 period
Bryan A
With the exception of Norway (+0.15 °C), all have for 1949-1978 a slightly negative trend between -0.09 and -0.14 °C / decade.
When I have some time to spend I’ll generate a graph comparing 4 of the 5 for their entire common period.
Bindidon,
Have you used the ODBC features of Excel to directly connect to databases such as MySQL, Oracle, Access, or SQLServer?
James Schrumpf
No. When processing temperature or sea ice or sea level time series, I do not really need database access.
https://drive.google.com/file/d/11asr5iVMPl_PhGsiwW5MYRQvmpyUO2-k/view
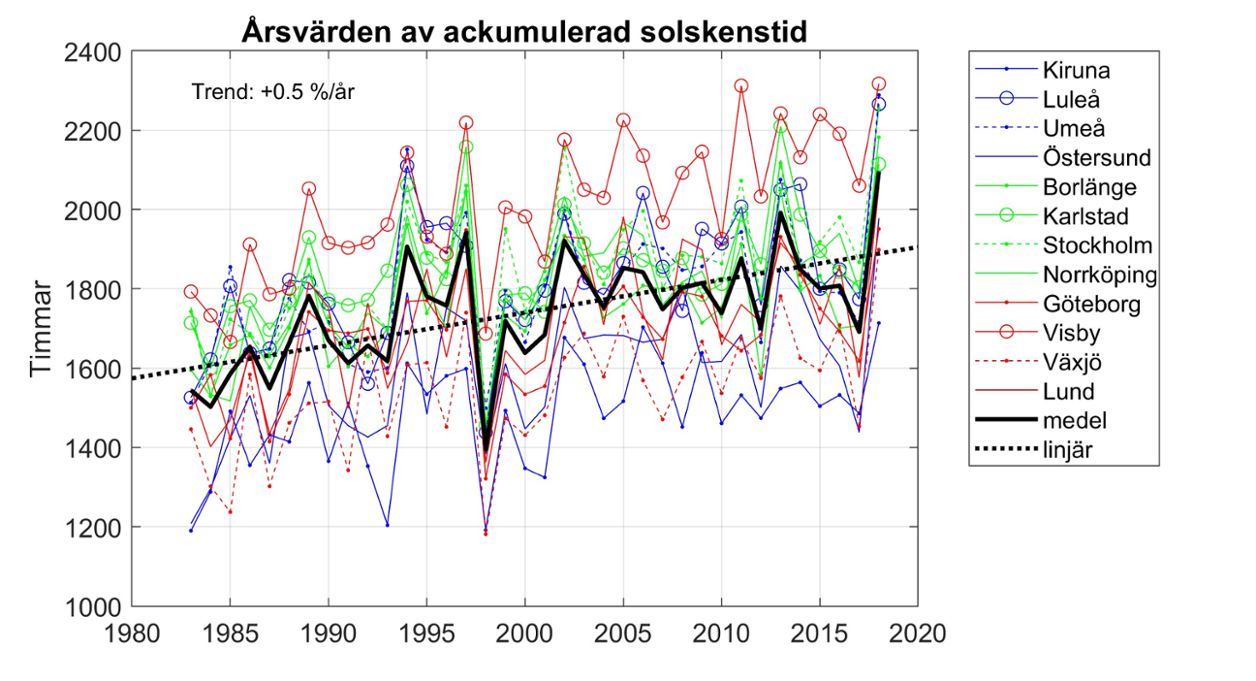
“According to the study, temperature changes have been accompanied by an increase in cloudiness over northern Scandinavia, which in turn has reduced the impact of warming.”
However the amount of solar radiation reaching the surface in Northern Scandinavia has been increasing by an average 0.3 % per year since 1980, not decreasing:
More fake science to save “the narrative”.
Is it global temperature increases that cause the increased cloud formation?
Or solar changes (indicated by solar flares and geo-solar magnetism changes) ?
Is this a “Svensmark Moment”?
Read the post above. Cloud cover has decreased