Guest essay by Larry Hamlin
NOAA tide gauge data measurements exist for 17 locations along the California coast with 8 of these locations having actual measured sea level rise data covering periods for more than 70 to 120 years in duration.
This measured data shows that none of these California locations are experiencing coastal sea level rise acceleration since climate alarmist first made such erroneous and flawed sea level acceleration claims before the U.S. Senate in 1988.
Climate alarmists and their supporting media conveniently conceal the fact that their flawed claims have been hyped for the last 30 years as they continue to try again and again to make the same repeated but flawed claims apparently hoping that the public will forget their long track record of failure and exaggeration.
NOAA measured tide gauge data shows that coastal sea level rise at Ca. locations varies between 3 to 12 inches per century and have remained at those levels during the long measurement periods during which actual measured data have been recorded with a sample of that measured data shown below for San Diego, La Jolla, Los Angeles and San Francisco.

The recent climate alarmist propaganda study hyped by the media speculating that CA coastal sea level rise levels of 1 to 2 meters (about 3 to 6 feet) by 2100 “could” occur along with associated grossly exaggerated damage estimates are based solely on invalid “computer models” which ignore the extensive measured NOAA tide gauge data which shows that 30 year old climate alarmist claims of accelerating coastal sea level rise are unsupported by actual measured data.

The UN IPCC clearly established in its 3rd Annual Climate Report in 2001 that it is impossible to develop computer models that represent the earth’s climate because climate behavior is too difficult and complex for such models.
Specifically the UN IPCC concluded the following with respect to the ability to develop valid climate models:
“In climate research and modeling, we should recognize that we are dealing with a coupled non-linear chaotic system, and therefore that the long term prediction of future climate states is not possible.”
The politically driven world of climate alarmism propaganda claims such as those represented in this most recent hyped CA alarmist study always rely upon the speculation and conjecture derived from invalid “computer models” with their results cloaked with words like “could” and “might” to avoid having to specifically address the huge limitations of such models.
Greenpeace co-founder and former President of Greenpeace Canada Patrick Moore noted in a recent article addressing the hidden political drivers behind the global campaign of climate alarmist propaganda claims which he characterized as follows:
“And so you’ve got the green movement creating stories that instill fear in the public. You’ve got the media echo chamber — fake news — repeating it over and over and over again to everybody that they’re killing their children. And then you’ve got the green politicians who are buying scientists with government money to produce fear for them in the form of scientific-looking materials. And then you’ve got the green businesses, the rent-seekers, and the crony capitalists who are taking advantage of massive subsidies, huge tax write-offs, and government mandates requiring their technologies to make a fortune on this. And then, of course, you’ve got the scientists who are willingly, they’re basically hooked on government grants.”

CA has a long and tarnished track record of pushing politically contrived climate alarmist hype to promote more government mandated control of our state’s business enterprise including the ridiculous law requiring that the state’s electricity be 100% renewable by 2045.
Until CA citizens wake up and stop allowing themselves to be herded into supporting these scientifically unsupported climate alarmist propaganda claims the state will only become more and more government controlled and dominated with loss of power and influence residing within its citizenry.
But … but … but the models that have all my assumptions about how sea level rise is accelerating show that sea levels are accelerating and will inundate CA in the near future! Send more money so I can set up more model runs with new assumptions showing that SLR will be worse than I thought this time around!
Early attempts at modeling the climate by Edward Norton Lorenz led to the discovery of what a chaotic system really is. In a chaotic system, if you change the tiniest thing, the overall result is completely different. That’s called the butterfly effect because the flapping of a butterfly’s wings in the South American jungle would be enough to change the weather in Detroit some years later.
Rather than forthrightly dealing with the chaos problem, climate modelers prefer to ignore it. Ignoring it doesn’t make it go away. Bigger, faster, computers don’t make the problem go away. A finer grid doesn’t make the problem go away. A better understanding of clouds doesn’t make the problem go away.
Chaotic systems have attractors. Those are output values that the system sees most often. In that regard, a simple model is best, as long as you have enough data to understand where the attractors are.
If I want to know the electric current in a simple linear circuit, I will use Ohm’s Law. I won’t try to model the positions of all the electrons. That would be a complete waste of time and resources and would give me worse results. Similarly, the correct climate model will look something like Monckton et al’s irreducibly simple climate model … no super computers required.
Dead right commieBob. All it takes is the basic application of the thermodynamic laws, the gas laws and knowledge of the properties of water to nail the greenhouse effect into the deck as irrelevant.
Indeed Monckton got it right, albeit from a different perspective from mine.
Lorenz clearly spelt out the stupidity of attempts to predict the future behaviour of chaotic systems.
The political nature of the IPCC has done immense damage to the reputation of the scientific community.
“The political nature of the IPCC has done immense damage to the reputation of the scientific community.”
Methinks ,Alasdair, that the community has done that itself. After all, who makes up Working Group I?.
By all reasonable deduction, the Jury is now IN.
There should be no fervered discussion for another decade, because sea level changes of the types being discussed are gradual and capable of useful, low risk prediction for the next decade at least.
So, use this topic as an indicator of which alarmists have this non-scientific property, an inability to let sound numbers speak. Plus, an ability to connect people by using non-science negligently.
Why not spend some thought on how to recover some of the past costs of alarmism about sea level change. There are some large $$$ sums that equity demands be recovered and returned fairly to those who were knowingly fleeced.
IIRC, this is the first major significant instance in the climate change wars where the outcome is firm enough to bank. This is the first big chance to start construction of formal legal, criminal and civil proceedings to reverse the moneys involved in well-documented, fraudulent climate change claims. Geoff
Who cares about a couple of billions to build unnecessary sea walls? Let’s finish the high speed train line from Merced to Bakersfield. People from all over the world will come to marvel at this hi-tech wonder. Does anybody know how many passengers will use it, and how much would a ticket cost?
The answer: 3 (but each way!)
The ticket price is unknowable since it will be 95% subsidized no matter what.
An even bigger question is: can the human body withstand the blistering, 100 MPH speeds that this High Speed Train operate at? It’s mind-bendingly fast, over the vast, high-density corridor of Bakersfield to Merced!
When REAL scientists can explain how 5-10 degrees F warming can melt the Antarctic Continents Ice Sheet that has an AVERAGE DAILY TEMPERATURE of 59 degrees BELOW ZERO, then I might “give a dam” as Scarlet Ohara said. In the ,mean time, here is what is really happening, and SCIENCE has NOTHING to do with it.
2Jan2015
At a news conference [22Jan2015] in Brussels, Christiana Figueres, executive secretary of U.N.’s Framework be adopted Convention on Climate Change, admitted that the goal of environmental activists is not to save the world from ecological calamity, but to DESTROY CAPITALISM. “This is the first time in the history of mankind that we are setting ourselves the task of intentionally, within a defined period of time, to change the economic development model that has been reigning for at least 150 years, since the Industrial Revolution,” she said . Referring to a new international treaty environmentalists hope will at change conference later this year, she added: “This is probably the most difficult task we have ever given ourselves, which is to intentionally transform the economic development model for the first time in human history.”
Investor’s Business Daily: http://news.investors DOTcom/ibd-editorials/021015the Paris climate
-738779-climate-change-scare-tool-to-destroy-capitalism.htm#ixzz3RXh5Tujn
From my daily search on Sea Level in the news:
Study: Destruction from sea level rise in California could exceed worst wildfires and earthquakes
My comment:
When these beach front communities start voluntarily paying double or triple their current interest rates on municipal bonds because they acknowledge that they are at very high risk of climate change induced floods and other weather disasters, maybe I’ll take their vocal concerns a bit more seriously.
They love their self proclaimed victim status. But unlike other victim claims based on past experiences, these are all future abuses. If they truly feared these impacts, they would sell off whatever property they own and leave. They would be one of the missing 50 million climate refugees predicted by the UN.
It’s not just the bonds.
When a property owner applies for a change to the FEMA flood maps they (the maps) generally can’t be changed without the local jurisdiction signing off on the Federal application, and stating that “the property will be reasonably safe from flooding”.
There have been numerous map changes in the bay area over the last five years; as such the local jurisdictions have signed the Federal form saying that the property is “reasonably safe from flooding”, even when the properties are not 6 feet above current modeled flooding elevations.
If they believe in 6 feet of SLR, and they have proof, as responsible flood plain managers they should be changing the FIRM’s themselves and moving 10,000’s of properties into the requirement of paying flood insurance.
They either don’t have proof, or they are irresponsible. No other option.
Those who think we should observe slr trends for 10 years and then revisit have my vote. This is what North Carolina regulators decided. An alarmist “science panel” concluded we should anticipate 3 meters of slr by 2100. The legislature balked and commissioned a new study’, which said continue the current slr rate until 2060, then revisit.
I think this was a smart result but I hope we’ll revisit sooner if it becomes necessary. If it continues to warm I would not be comfortable with assuming that the slr rate would remain the same.
When I was much younger I had to drive long distances to go home during college breaks. I would pass the time by mentally computing how fast I would need to go to get home by a certain time. I would start off by assuming I could average 75 mph, putting me home in about ten hours. Of course, my average speed was less than that (but not much).
Periodically, I would recalculate the speed I needed to average to stay on schedule. Obviously, as time passed and I continued to go under that average, the average future speed required to arrive on schedule increased. As the tenth hour of my trip approached, I needed to have a speed of hundreds on miles an hour, and it quickly approached infinite speeds as the seconds ticked off.
This predicted sea level rise will suffer the same fate. We need a chart showing how fast the sea level must rise to meet their predicted rise, side-side-by-side with actually measurements. It should be updated yearly. Eventually, the line showing the acceleration required for their prediction will look like a hyperbolic curve, and the graph of actual data, a slow, miniscule linear increase. Make sure their names are prominently displayed on their prediction, and send them a copy every year. Don’t let them forget their alarmist predictions. Don’t let anyone forget.
jtom ,
I put together a little Excel spreadsheet with simple input parameters to demonstrate exactly that, and sent it to my son to play with.
Basically, you just put in a baseline rate of sea level rise and a start year, and it calculates a baseline SLR to the year 2100. Then you input a projected SLR (e.g., 2 feet) and an end year, and it calculates the required increase in SLR under three scenarios to achieve the projected SLR.
The great thing is that it clearly demonstrates that the longer the SLR rate does not change, the greater the increase needed to achieve the projected “alarmist” SLR.
Now that’s a hockey stick!
“Until CA citizens wake up and stop allowing themselves to be herded into supporting these scientifically unsupported climate alarmist propaganda claims the state will only become more and more government controlled and dominated with loss of power and influence residing within its citizenry.”
Who cares.
California is currently flirting with Puerto Rico style bankruptcy, with Venezuela on the horizon. It does not matter how they got there. Whether it was the greed and arrogance of the elites running the show or the stupidity and complacency of the voters, the results are in.
In ten years, sea level rise will be the least of their problems.
Tony, I’d really appreciate how you’re arriving at that. I live here, drive by Facebook and Apple a lot, work in the rapidly expanding IT/Biotech corridor that extends up to San Francisco now, and see huge numbers of new apartment buildings being built everywhere around here, and I don’t see it at all. Plus I read, and assume it’s not fake news, that there’s a big government budget surplus too. Looks like boom times to me:
https://www.kpbs.org/news/2019/jan/10/california-gov-newsom-release-his-1st-state-budget/
So I don’t know why you think that, and I hear statements like that a lot. Let me know.
The scientific climate change complex appears to suffer from a variety of “the map is not the territory” issue. The scientists seem lost in their complex yet inevitably incomplete models, and patchy, manipulated, often third-hand and unreliable data, with a gaping disconnect between their inner narrative of doom and catastrophe, and the real, outside world of human experience where precious little of an unusual or alarming character appears to be happening.
The late Bill Hicks had a line about this phenomenon back in the early nineties, where he talked about watching too much TV news: ‘If you ever watch CNN headline news for any length of time it’s the most depressing thing you will ever do; “War, famine, death, AIDS, homeless, recession, depression, war, famine death, AIDS…” Then you look out your window it’s just: [makes sounds of crickets chirruping] Where is all this sh*t happening man? Ted Turner is making this sh*t up!’
But climate science has rebuttals to the non-alarmist argument that sea levels are not accelerating, for example. The tide gauges around the world are unreliable, because the land is moving (i.e. there is no land-based static point of reference), the observations of millions of people who live and work on a daily basis, sometimes for entire lifetimes, next to the sea, the harbourmasters, the fishermen – are merely “anecdotal”.
Instead we should only pay heed to those scientists who publish, after careful and entirely un-biased processing and adjustments, data from satellites that, even if we accept that they are capable of reliably measuring a minuscule rate of change in a heaving ocean, shows a completely different rate of rise to the land-based data.
Or perhaps we should instead trust the output of another group of scientists who plot graphs of ensembles of tide gauge data and – whoa, look at that – wouldn’t you know it, it’s accelerating! Well, I’ve looked at the raw tide gauge graphs and can state with absolute certainty that I could stitch together an ensemble of data from graphs that go up, down, and straight along for varying lengths of time and with different start and end points, that looked as if sea level rise was accelerating. I could also make one that looked like it was decelerating, that looked like a sine wave, a sawtooth, perhaps even a seagull, or a paper hat.
But in the final analysis, even if the annual rate of change increases from the width of a coin to the width of two coins in the next couple of hundred years, what difference does it actually make in the real world? Buildings don’t last forever, they get re-developed, maybe next time a couple of feet higher. Harbour walls don’t last forever, next time rebuild with an extra course of bricks or stone. Sea defenses are continuously eroded – add an extra few centimeters next time they’re scheduled for reinforcement.
Recent papers show that islands and atolls are growing and globally land area is increasing. The increasingly shrill bleating of the alarmists is slowly becoming just an annoying background noise. Eventually, hopefully, people will just start to tune it out, and move on with their increasingly prosperous, healthy, well-fed, long lives.
If You are showing lack of acceleration You are obliged to show this;
https://tidesandcurrents.noaa.gov/sltrends/sltrends_station.shtml?plot=50yr&id=9414290
Change history shows acceleration that occurs from time to time. 😉
Correct.
You actually see this cyclical pattern across the world, with SLR rising as much as now back in the mid 20thC, and a slowing down in the 1960s to 80s (when the world was cooling)
Lasse,
That is a great link, thanks for posting. I have never seen the data plotted in that fashion.
Oh no problem: here’s one more example showing cyclic behavior and… even a decrease over time!
Out of PMSL’s station list:
126; 46.333333; -72.550000; TROIS-RIVIERES ; 970; 078; N
https://drive.google.com/file/d/1-2OcxjLuDVElTtnRn1ORIUp1Fvuc_tGa/view
But the Globe is not restricted to that location.
There are tabs above that to select various means of time/measurement.
On the right is San Francisco California’sPrevious Relative Sea Level Trends from 1895 with years 2009-2018 showing 1.93-1.96 mm/yr
https://tidesandcurrents.noaa.gov/sltrends/sltrends_station.shtml?plot=50yr&id=9414290
That’s gotta really induce FEAR and Uncertainty among the Catastrophic Climate Crowd.
So NOAA helps to save their day with the “Relative Scenarios” tab over on the left which shows a dubious observed trace and then modeled trends from 2000 out to 2100 with the y axis indicating meters. Oh, Boy! now we’re talkin’ look at that ExTrEmE trend!!
Lasse, Paul Homewood
And that you deduce from one single station? Really?
Look at PMSL’s station list, and you will see what you in reality should do:
https://www.psmsl.org/data/obtaining/nucat.dat
Over 1500 stations, out of whose you have to construct an appropriate average. Then – and not before – you begin to know about how sea level behaves in which period.
I’m working on that actually, and though a lot of stations may show cyclic behavior, their average time series doesn’t at all.
Simply because all these cycles you see on single stations do occur at different periods…
From the view of a geologist, the North, Central, and South America plates are rising in the west and being tipped down in the east. The western margin of these plates is being directly affected by subduction, the “Ring Of Fire” if you like, and the resultant magmatism/volcanism, thermal inflation, and erratic (and sometimes spectacular) tectonism. Sea level changes against this general setting might well be measurable, and even exceed the rise rate, but the coastlines of the west are straight and the coast lines of the east are irregular, and this is still in textbooks. There are Inca water supply canals in the Atacama in Peru that now have reversed gradients, with down toward the mountains.
“There are Inca water supply canals in the Atacama in Peru that now have reversed gradients, with down toward the mountains.”
As a stand alone it does not make your point.
Mebe they put somebody like Hansen in charge of policy and built them like that on purpose, ‘knowing’ that the mountains are eroding into the sea & that the canals would naturally reverse grade in the future . “It may not be the most efficient in the short term”, says Inca Hansen “but our grandchildren will thank us for our forward thinking efforts to keep our canals from getting too steep and erosive … it’s for the children and grandchildren.”
Undulating changes over a range of about 4.5 millimetre since 1880 – yes, dangerous man-made global warming in action! 🙂 Thanks for this interesting graph, Lasse.
Your NOAA website link showing relative sea level trends for the US is interesting. But if you compare the trends from multiple locations, you see that they are not uniform. That’s because the relative sea level rise at a given location is the sum of the actual sea level rise combined with the subsidence or uplift of that area. Actual sea level rise is uniform, but vertical land movement along our coasts is not. Some areas are subsiding, some are being uplifted, and some are not moving vertically at all. So in an area where relative sea level rise appears to be accelerating, the question then becomes “Is the apparent sea level rise accelerating because the actual sea level rise is accelerating, or because the rate at which the land is sinking is accelerating?”
You left out water “sloshing” back and forth. I believe there are decades-long cycles of this, so that, wasn’t it the western Pacific showed a SLR trend virtually the opposite of the rest of the world for several decades? And hasn’t that trend now reversed? I can’t remember which way it was going or is now going, but it seems to me that was due to water sloshing.
UK sea levels show the same lack of acceleration too:
https://notalotofpeopleknowthat.wordpress.com/2018/06/20/uk-sea-level-rise-in-2017/
SF tide gauge has not risen since 1980 except for spikes in El Nino. A recent Scripps study found no trend in storm surge since 1949
Here are SF sea level projections from models compared to tidal gauge.
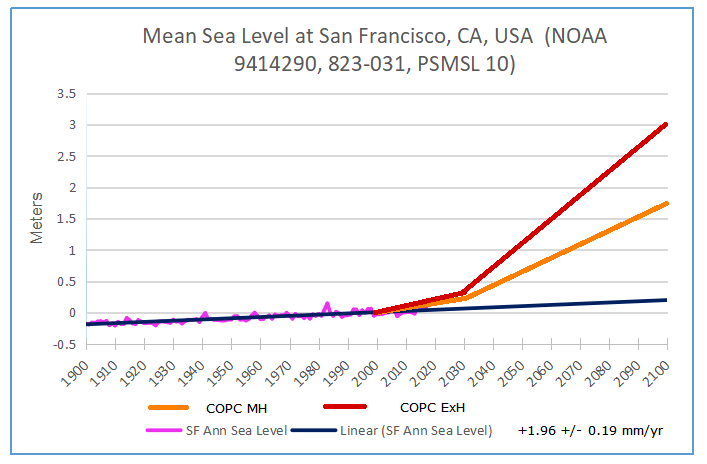
Details at https://rclutz.wordpress.com/2018/07/27/calif-dials-up-sea-level-alarm/
That’s hilarious. Thanks for the morning guffaw, Ron.
Real estate speculators in coastal California must love the COPC.
Models are great, you can get them to give you any result you ‘need ‘ by just tweaking a few numbers. None of the challenging of field work, and none of the risk of experiments where the results do not support your idea. And used ‘well ‘ you never have to worry about be asked why you got your claims so wrong.
Who can blame them , when you seat in your office all day , known you can ‘find’ the results you need, and as long as you follow the party line you will get published . And who knowns, get a new scary headline on your study, you will get lots of press coverage too.
I have long since lost interest in the projections. They have been banging on for the last 30 years claiming man impacted climate. Where is my graph for the last 30 years displaying the man induced component. They have the models, they have the data, so what is the problem. I want my graph!!
What is ‘catastrophic sea level rise’? It’s what happens when a 1/4 mile wide object hits the middle of the Pacific at 70,000 mph. Want to avoid real catastrophe? Find these things and figure out how to divert them. We know this is an inevitability; the geological record (and Comet Shoemaker-Levy 9) tell us so. In the meantime, step away from the computer and look out your friggin’ door. See a catastrophe? I didn’t think so.
Thread winner!
Theyouk nails it!
“The UN IPCC clearly established in its 3rd Annual Climate Report in 2001 that it is impossible to develop computer models that represent the earth’s climate because climate behavior is too difficult and complex for such models”
This is only true with a bottom up model of an unknown system where the hope is that the proper behavior emerges based on countless ‘educated’ guesses about how that system might behave. On the other hand, a top down model that considers the atmosphere a black box characterized by the MEASURED behavior at its boundaries with space and the surface requires nothing more complicated than Stefan=Boltzmann, COE, simple geometry and arithmetic. Of course, this doesn’t get the answer the IPCC needs, so they reject best practices modeling in favor of GIGO modeling.
We learned this important lesson in the semiconductor industry, where if you don’t have a top down model to close the loop with your bottom up model, you will likely waste millions making a mask set that will produce chips that won’t work.
Cretaceous levels are coming!
https://www.wunderground.com/cat6/Highest-Sea-Level-Rises-US-are-Texas-and-Louisiana-Annual-Report-Finds?cm_ven=cat6-widget
“…. topping the list, according to the annual sea level “report card” from researchers at William & Mary’s Virginia Institute of Marine Science. Rockport, Texas (south of Galveston) had the highest acceleration rate (0.240 mm/year2),……”
We were just having a discussion about the Rockport Navigation District who recently let a contract for expansion of harbor. Neither they nor the contractor knew about the rock. The district just built a new office (post Harvey) on the beach lower than they would have allowed a private citizen. The list goes on. Rockport is 10 miles from the Gulf inlet, sometimes has highstands and the NW gulf has exceptionally peculiar (erratic) tides and seasonal sea levels. Virginia Institute of Marine Science has its head in dead fish for Google Earth. I used to work for them back in the days of homework. This is guilt by association, but the tide gauge is on Navigation District Property, and shows about six inches of rise in the last decade with data missing. We are searching for the water.
https://www.vims.edu/research/products/slrc/localities/rotx/index.php
https://tidesandcurrents.noaa.gov/sltrends/sltrends_station.shtml?id=8774770
In case you are interested in the real problem this just came out.
https://www.fema.gov/media-library-data/1503660451124-33b33bb90d4a6fe62c89e6de2b11dd78/FEMA_p1000_Aug2017_508.pdf
Science in or about California has it genesis from key sources: Disneyland, Hollywood and Sacramento, all places of make believe.
Several years ago, the Santa Barbara city council had a proposal to paint a blue line across town. This line was the demarcation between the portions of the city which would be submerged, and not submerged, due to sea level rise. After pretty much every property owner inside the line threatened to sue, amazingly, the city backed off. Against this backdrop, I’m reminded of the house my grandfather built on the beach some 40-50 years ago. Funny thing, every time I drive by, the place is still there. Shouldn’t it be under water by now?
Your grandfather is such a denier!
Sure, but not because of sea level rise, but because California is sinking into the ocean. I heard that 40 years ago, California would break off and sink into the ocean. Get your hip boots and life preservers!
We Aussies got in early to expose the Rising Sea Levels scam, thanks to a decent bloke who was fed up with government deceit:
https://wattsupwiththat.com/2011/12/01/hiding-the-decline-down-under-inconvenient-papers-censored/
Mind you, another Aussie took us in the opposite direction. If you want a good guffaw, google Tim Flannery for his video views on rising sea levels….
https://wattsupwiththat.com/2018/06/07/disappeared-tide-gauges-showing-negative-absolute-sea-level-rise-removed-from-data-base/
It gets a lot worse than that, some tidal gauges on the West Coast show sea levels FALLING.
Climategate 2.0 Provides More Evidence of Fraud; Constants Can’t Cause Variations…That is Why they are Called Constants
https://co2islife.wordpress.com/2019/03/07/climategate-2-0-provides-more-evidence-of-fraud-constants-cant-cause-variations-that-is-why-they-are-called-constants/
Well, CO2isLife… Why don’t you compute the trends for all 1500+ tide gauges?
Maybe you suddenly detect that, like CONUS isn’t like the world’s surface (a bit more than 5 % of it), the ‘West Coast’ isn’t like the sum of all coasts on Earth…