About this time last year, I wrote a light-hearted review of New Zealand’s love affair with Wind Generation.
Since then I’ve become interested in seeing just how effective these things really are. Where I live adjacent to a string of Turbines, we get some pretty impressive winds – 150Kph is not that unusual. But we also get days of complete calm – usually at times when electricity demand is at its highest.
Nonetheless, our green-biased Government elected just over a year ago are still pushing so-called renewables as the way of the future. Interestingly New Zealand already produces more than 80% of its energy from Renewables, with Geothermal and Hydro way ahead of Wind.
Ironically, the green movement vehemently oppose any new hydro projects, and insist on visually polluting the beautiful GodZone countryside with these wind turbines.
Eventually I decided to try and discover exactly just how successful and efficient these wind turbine things really are. But finding the data seems like hard work. I’ve been unable to locate data on individual windfarms (unless someone can help me out here), but I have located data covering each of the North and South Islands.
Since July last year, I have been collecting the data via a computer script that downloads data at 5 minute intervals and stores it in a MySQL database. I needed to wait a reasonable interval before analysing just to make sure I had a representative sample.
I’ve just done my first analysis, and the results are as predicted – shocking.

The above graph shows theoretical “Plated” capacity versus actual average production by month.
Here’s the supporting data:
| Month | Plated Capacity | Generated MW | Average Production |
| July | 658 | 186.15 | 28.29% |
| August | 658 | 132.50 | 20.14% |
| September | 658 | 174.62 | 26.54% |
| October | 658 | 157.63 | 23.96% |
| November | 658 | 149.15 | 22.67% |
| December | 658 | 124.54 | 18.93% |
| January | 658 | 179.51 | 27.28% |
| February | 658 | 157.86 | 23.99% |
Clearly in 6 months, there has been no capacity added to the National Grid, and last July had a high of just 28.29% productivity yet December could only yield 18.93%.
These results are pretty damning and expose the deceit we are exposed to every time a new proposal is put forward.

Next time there’s a public meeting regarding how wonderful these visual pollutants are, at least I can now present data to refute many of the absurd claims. They’d be hard pressed to refute this data since it comes from the Government’s State-Owned Enterprise “Transpower” who manage the National Grid.
I have made my data available to anyone who wants to analyse it at http://www.andic.co.nz/windextract.csv
Andi
It’s probably because the birds have banged up the leading edges of the blades…reducing efficiency….blame it on the engineers…Sci Channels sez so…
Wind plant output is reduced when winds are too low and too high.
They turn off when winds are high to avoid being damaged.
The best wind sites have consistent decent wind speeds and dense air – places like Oklahoma.
Yes … it was sad when I drove across OK last year. Fricken wind mill farms everywhere. A lot of them weren’t even turning. Not that OK is some sort of national treasure when it comes to beauty,but there is a simple beauty about it …. errr … or at least there was
I have driven across the country 3 or 4 times in the last few years since I retired. I’m always amazed at how many of the eyesores are sitting there not turning!
The only one that I have seen working every time is at Coober Pedy.
In an effort to understand… The reason they turn-off in too high a wind. You’d think they’d be going all-out? – well, no; apparently.
It would be really hard to develop a thrust bearing that could stand having the blades downwind of the generator, so they all have the blades upwind. As the wind increases, the blade-tips bend increasingly – this is quite noticeable in pictures. Eventually there’s a danger of the blades bending inward so much, they strike the tower and chop it down. And even if the tower survives a strike, the blade-tip will shatter – and now you’ve got a huge imbalance in the rotor disk.
All really good stuff. My “home” has just been infested with the d@mn things, but my bro’s son is working fulltime and making good coin maintaining them so I’m of two minds…
“Eventually there’s a danger of the blades bending inward” The company I work for has been trying to get their Flexfoil technology on blades to reduce loading issues and extend the working envelope.
“As the wind increases, the blade-tips bend increasingly – this is quite noticeable in pictures”
I’ve never quite understood why they need to shut down in high winds (other than really extreme situations). All the large turbines have blade pitch control, so why can’t the angle be progressively reduced with increasing wind speed? Maybe it’s really that they can’t cope with gust loads when working hard – and these are invariably much stronger in high winds.
I’m of two minds—
Here is the States we define your anxiety as ambivalence, i.e.,
THE FEELING YOU GET WHEN YOU FEEL YOUR MOTHER-IN-LAW GOING OVER A CLIFF IN YOUR NEW CADILLAC.
Yet Wyoming, at high altitude and high, high wind is said to have a great wind resource. What they really mean is they can rip the place to pieces and no one can stop them. Oh, and Warren Buffet needs his his taxes lowered even more so he’s putting more turbines, err tax breaks, in.
Meiggs, looking at the environment shown in the photos you can bet there are small rodents running around and birds looking for them, so there will be dead birds underneath these wind turbines. Maybe we can get Javier up on a stepladder to see if the blade tips really cut things up when they hit?
The rotorblades will rather smash the animals and the remainders will hit the ground, becoming easy prey for scavengers. So, windturbine sites will turn out as habitats of high yield for scavengers, rent seekers, deceitful politicians and other subsidized criminals.
Non, where I walked underneath a long string of wind turbines, about ten miles NE of Casper, Wyoming (working on insitu-leach uranium potential) there was a collection of common small birds, a couple of hawks, one golden eagle, and two buzzards. So these turbines appear to create a food chain, smaller birds get chopped up and buzzards detect the corpse and get chopped up investigating.
Well observerd, I’d say. These new habitats are of course suitable for non-flying scavengers, like rats
(or Euroc- rats, Democ- rats?), politicians, greenies and so on. /sarcAccording to Sci Channel the leading edges were exfoliated by “unexpected” bits of inanimate matter in the air like sand, hail and what not…no mention of birds…but not a failure of politics, or mgmt or tax structure…a failure of a single profession…engineering! Amazing that only one profession gets credit for what appears to be a political issue….
Seems quite high for wind power. I guess NZ is a good place for wind power. I’m betting European figures are much lower.
There is one just out of Martinborough that is reputed to be the best site in the world.
It is a pity he couldn’t get the data for the individual sites as it would be interesting to compare the Martinborough site with the one between Palmerston North and Woodville.
Currently the whole of teh South Island production is sitting at zero and has done for a few hours now!
Cheers
Andi
It has been calm following the short southerly last nite. The ocean is flat, no waves all the way up the east coast from ChCh.
Nice report Andi, thanks.
I also think Western Australia should be pretty good for wind power. There are trees by the coast that actually grow horizontally!
Yes, there are several wind farms on the mid-west coast. And what actually useful about them is they produce that ‘extra top up power’ for the grid at a useful time – mid afternoon when the winds come in more strongly (due to geography, land has heated up during the day, wind blows in in the afternoon). One of the few cases where wind farms are appropriately matched with grid requirements.
Check out the AEMO Data Dashboard web site..at 1pm 8th of March producing 55MW…
WA is the only state that shows, on one page, the wind power “production”..
Gee, while you’re Thinkin’, how about posting a link? 🤔
Pop Piasa,
You never know what you’ll find if you use your fingers….
Unless you’ve worked in a saw mill…
And want to say goodnight to the foreman….
I’ve looked for a similar analysis for UK and German farms, but can’t locate any. Does anyone have any clues where to look, or for other EU countries?
Some of the info can be found for Germany here:
https://energy-charts.de/energy.htm
This consistent very low output is seriously unusual. But there does seem to be some sort of correlation between low rainfall and low wind output. In a normal year, wind capacity factor is in excess of 35%.
Long-term, wind output drops by about 9% in the autumn (may/June) – when we need it – and increases by about the same amount in the springtime (October November December).
So it is even more mysterious. If I was considering developing wind power, I would want to know a lot more.
Where do you get your data on capacity factor being 35%?
That’s usually the factor put in by the wind companies as a theoretical, for their business case.
I analysed years of data a few years ago. Chart is here ?dl=0
?dl=0
OK, nice graph, how about a link to the actual data source?
The data exists on the electricity authority website but it is very hard to disentangle it from all the other power stations.
The original analysis was based on data from a friend in the Electricity Authority who has since died.
I later analysed data provided by Meridian for the Hayes wind farm. They had denied that output dropped off in the autumn but the data they provided me with showed that it did.
The data should be easily available but, it seemed, then make it difficult because they realise that the conclusions would be seriously unfashionable.
I might have to actually download this data and take a look at it. How ragged is the production curve? Of those 5-minute intervals, how many of them show zero production? How long do those spells last? And various other questions.
Bryan
The projections for wind strength to justify installation were probably based on historical values. The number of westerlies across New Zealand appear to have reduced on average in the past 8 or so years.
I’ll believe 35% capacity factor for pinwheels when I see trustworthy evidence.
I’d just like to know how much one of the monsters costs and how much of it is subsidized. Out put is around 1,000 horsepower which is impressive but if the true cost is around a million dollars a copy it’s not.
Who rates wind turbines in horsepower?!? Anyway, that’s about 745,000 watts. The usual rule of thumb for fossil fuel plants is $1/watt, so that would equate to $745,000. Of course, that’s if you’re building a 500 MW plant with economies of scale and intending for 24/7 use. You can get a 1MW trailer mounted diesel unit for about $450,000 but they are not intended to deliver power for 40 years or so. According to the British web site renewablesfirst, a 900kW turbine is $1,834,000 installed. The trailer mount diesel is fire-it-up ready and will give you 1,000,000 watts from the get-go with a 90% or so up time. That means 900,000 kW-hr per hour vs the wind turbine with 0.35 x 900,000 = 315,000 kW-hrs per hour (being generous with capacity), at nearly 5 times the capital cost.
D.J.
Supporting your numbers: $2m per MW.
You need to figure on at least monthly oil and filter changes for the diesel genset and a yearly engine rebuild. If you have a class H generator, you might get a few years out of it. However, all the maintenance to the diesel genset can be done on the ground.
No yearly engine rebuild. Quote: “It is expected that, with TriboPack, times between overhauls can be extended to some 18,000 running hours, or about three years’ operation, compared with about two to two-and-a-half years with the previous design standard. ” From: http://www.marinetalk.com/articles-marine-companies/art/Longer-Times-Between-Overhauls-for-Sulzer-Engines-WRT00134135TU.html QED
IIRC, wind turbines get oil changes (generally synthetic because of the high load on the thrust bearings) three times a year. In the nacelle. About 100 gallons per turbine.
Fuel cost for the diesel generator is the issue, not capitol cost. I don’t know how much fuel is needed, but add that cost.
“But they are not intended to deliver power for 40 years or so”
Perhaps they are asking too much from modern, highly turbocharged engines? I can wander round any UK traveling fair and see plenty of Gardner powered gensets that are older than 40 years! The chances are these engines had already powered buses & trucks for 20+ years before being given a new life. You get what you pay for…
Yes, but I doubt they were running constantly for 40 years.
Unreliables is a better name than “renewables”.
Nice one !
Renewables = Ruinables = Intermittent, unreliable, unpredictable, undispatchable.
Activists should NEVER claim hydro as renewable as building of new dams is off the table.
Hydro is bathing in the glory of past smart decision making that is no longer available to us.
Since you have shown average MW, it would be useful to show min and max by month (easy). And P25 and P75 by month.
How about a scatter plot of all measures by time of day, or that chart by month.
I can see why you say that, but not sure that such a statistical report would be read by anybody who would absorb it – especially local and national politicians who make spot judgments without understanding the science. I think that bar chart is precisely what is needed to demonstrate the truth to anybody who would wish to understand. I continue to be staggered why the Greenies seem prepared to accept bird-and bat-kills, and the despoilation of the visual beauty of our scenery, for a miniscule benefit created at enormous subsidised cost. Of course, snouts in trough is one reason!
Mike Lowe
That’s a point I have made many times. It’s all very well baffling these people with science but that’s all it does, baffle them.
It’s the communication that matters here. Keep it simple and straightforward, have further ammunition available is some smart arse asks for it.
Scientists/engineers are brilliant people but not propagandists. Greens are as thick as mince but great propagandists. That’s why we are, where we are today.
Bullshit baffles brains every time. Science can’t hack it in the face of a wall of propaganda, it just gets lost in the noise.
To HotScot: 1000+
I am not surprised by these numbers. They are better than Germany’s, on a par with Denmark but not as good as South Australia – If I recall correctly. More telling than an average generation number is the % of days when Wind generation surpassed some practical minimum needed to justify the tie in to the grid. For example, if the system reliably provided 15% of capacity every day of the year, then it is a workable option. On the other hand if it provided 100% of capacity 15% of the time and very little the other 85% of the time, it would be a bloody disaster.
In normal years the capacity factor in New Zealand is in excess of 35%.
The very low capacity factor over the last six months or so may be associated with the fact that there was not much rain. In a power system that relies on hydro for 65% of its energy, this has serious implications.
Brian,
Is that 35% an overall capacity factor -vs nameplate rating – or is it just the windfarms or just the hydro or??
There seems to be reasonably reliable and historical information that supports a 37% capacity factor.
However, it is possible that there is an error in the calculation because wind farms that are not connected to the transmission network are not included in the output figures. But it is hard to find out how many there are. but there is no doubt that the capacity factor over the last nine months or so has been much lower than normally.
The only subsidy that windfarms in New Zealand get is free backup and, to a degree, free transmission. Some windfarms in New Zealand are struggling to cover the operation and maintenance costs. Because they generate most when the power price is least their average income/kWh is less than the average price on the electricity market.
Data in support of this claim?
35% certainly isn’t well supported anywhere else as a system capacity.
Bryan and Andi, the Transpower site has a lot more interesting info. For example the “Generation mix” page shows wind generated 350 GWhrs over the last 13 weeks which given the nameplate capacity of 658 MW gives a capacity factor of 24.3%. I believe this is fairly typical. Where did your 35% figure come from?
Great work Andi. Paul Homewood in the UK will improve.
Of course, in the UK the government has just announced another raft of offshore windmill investment that will deliver 30% of the UK’s electricity by some date or other, all for just a few hundreds of millions in taxpayer subsidies.
30% of the UK’s electricity? Yep, utter delusion. Mind you, with the intention to destroy all non-carbon capture fossil fuel power stations, and a total inability to manage a nuclear building programme, maybe they’ll be right! 30% of notalot = notalot. We’ll have to send these messages by pigeons or similar ‘cos we won’t have power for an internet.
Vote UKIP!
Overall, a 24% capacity factor. That seems just about par for the course.
It does.
Low hanging fruit? Will the next 268 Mw be as productive?
Guest essay by Andi May?
Usually the name of the guest blogger is given. I had to go to the previous article to discover that this article is written by Andy May.
It is signed by Andi.
That seems to be Andi Cockroft.
Got me !
So who’s Andi May?
No Andi May. However, there is Andy May. See https://wattsupwiththat.com/author/andymay2014
New Zealand is one region where wind generators may make economic sense because there are times when perched water for hydro is at critical level. Any wind generation can conserve perched water leaving the hydro available to meet demand as it occurs.
The capacity factors are reasonable for a wind subsidy farm.
wind subsidy farm
A farm that grows wind subsidies? 🙂
OMG … some countries already get 100% of their electricity from renewable energy. link Costa Rica, Iceland, Albania, and Paraguay are using geothermal and hydro. 🙂 Based on that, scholars conclude that the entire world could be powered by renewable energy within 20 to 40 years. “The stupid, it burns!”
The logic of saying the world can switch to renewable energy based on some countries using geothermal and hydro reminds me of a joke.
The joke goes something like this: I’m working on boiling water using mind power. I know it’s working because I can already melt ice cubes.
If you made that claim in science class i high school here you would get an A!
i = in (sorry)
What about the places that don’t have geothermal and hydro? Wind can never do it alone, nor with solar, unless you don’t mind blackouts.
Last time I was in Costa Rica, I didn’t see any electric cars. Nor electric planes. Nor electric buses. Lots of gas, diesel, and jet A though!
You should really do deeper research. Countries that get 100% of electricity from renewable energy sources are usually small, with small populations, that have some natural advantage for producing their power. Also, some claiming to have 100% renewable import energy on demand from neighboring countries to make up for when nonrenewable fail to produce enough.
Iceland has a lot of geothermal and hydro energy and a small industrial base, along with a small population. (350K population, about 400K Sq Miles)
Costa Rica, small country, small industrial base, and mostly Hydro (over 70%). (about 340K population, 20K sq miles)
Albania – ? = Where did Albania come from? Anyway, the most recent chart I could locate shows it at about 85% renewable (in theory), but most of that is hydro and it turns out that their hydro is not reliable from year to year, so they import electricity when they have a shortfall. (population about 3M, size about 11K sq Miles) I also found some charts showing their use of oil for electrical generation, but they did not have a year on the chart.
Paraguay – Paraguay? You must really be desperate for examples – It produces almost all electricity from hydro and even exports most of it, showing how tiny its energy demand is. (Pop 7M, 160K Sq miles)
U.S.A. – Population 328M, size 3.8M sq miles.
So, I guess you are suggesting that the entire world build mountains so they can store up water for hydro power? Wind and solar make up so little of the world’s power for a reason. The U.S.A. is anti-dam building (and I happen to agree on large natural scenic rivers, but build away in the plains of Texas
where all you can see anymore is endless wind-warts (wind turbines).
In 20 to 40 years you will find more and more electricity generated from the only reliable source of energy that is not fossil fuel based – nuclear. Wind turbines and solar might gt as high as 30% if we rebuild the power grid.
Yes, the Stupid does burn.
“You should really do deeper research.”
…..
“So, I guess you are suggesting that the entire world build mountains so they can store up water for hydro power?”
…..
Surely commieBob didn’t need to put a “\sarc” tag on such an explicitly sarcastic comment!?
“Countries that get 100% of electricity from renewable energy sources are usually small, with small populations, that have some natural advantage for producing their power”
And will often be used to living with intermittent & erratic power supplies…
You need high dams which implies mountain canyons to get good hydro power. A dam in the “plains of Texas” might store a lot of water but I’m not sure of the power generation capability.
Why does any sensible government still bother with wind farms?
After nigh-on 30 years now of observations that they just don’t do the job required of them, continued support for them must qualify for that classic definition of insanity – doing the same thing over and over and expecting a different outcome.
“Why does any sensible government still bother with wind farms”
Could you please be more specific and name a “sensible government?”
The Kingdom of Antarctica.
It is ruled by a very wise Emperor Penguin.
He suggests those worried about global warming try sitting on an egg all winter out in the snow and then reconsider.
Rarely do these sales pitches at the town meeting is the REAL output told. They describe the output in terms of 2,000 homes and that number is based upon name-plate max output. The attendees immediately think “That is more than double the number of homes in this county,” and go away feeling that these will provide all of their power. Also never mentioned is that each one of these wind turbines uses power 24/7/365. They need to to produce power. Associated with that never mentioned fact is that they us a significant portion of the total generated power. Typically it is in the order of 5 – 10 percent of nameplate power. That number 5% needs to be subtracted from the ~25% capacity factor listed above – leaving you with the fact that only ~20 percent of name-plate rating has been added to the grid.
“Associated with that never mentioned fact is that they us a significant portion of the total generated power.”
That’s very interesting, I’d never heard that before. What consumes this power on the wind turbine?
http://www.aweo.org/windconsumption.html
Among the wind turbine functions that use electricity are the following:†
yaw mechanism (to keep the blade assembly perpendicular to the wind; also to untwist the electrical cables in the tower when necessary) — the nacelle (turbine housing) and blades together weigh 92 tons on a GE 1.5-MW turbine
blade-pitch control (to keep the rotors spinning at a regular rate)
lights, controllers, communication, sensors, metering, data collection, etc.
heating the blades — this may require 10%-20% of the turbine’s nominal (rated) power
heating and dehumidifying the nacelle — according to Danish manufacturer Vestas, “power consumption for heating and dehumidification of the nacelle must be expected during periods with increased humidity, low temperatures and low wind speeds”
oil heater, pump, cooler, and filtering system in gearbox
hydraulic brake (to lock the blades in very high wind)
thyristors (to graduate the connection and disconnection between generator and grid) — 1%-2% of the energy passing through is lost
magnetizing the stator — the induction generators used in most large grid-connected turbines require a “large” amount of continuous electricity from the grid to actively power the magnetic coils around the asynchronous “cage rotor” that encloses the generator shaft; at the rated wind speeds, it helps keep the rotor speed constant, and as the wind starts blowing it helps start the rotor turning (see next item); in the rated wind speeds, the stator may use power equal to 10% of the turbine’s rated capacity, in slower winds possibly much more
using the generator as a motor (to help the blades start to turn when the wind speed is low or, as many suspect, to maintain the illusion that the facility is producing electricity when it is not,‡ particularly during important site tours or noise testing (keeping the blades feathered, ie, quiet)) — it seems possible that the grid-magnetized stator must work to help keep the 40-ton blade assembly spinning, along with the gears that increase the blade rpm some 50 times for the generator, not just at cut-in (or for show in even less wind) but at least some of the way up towards the full rated wind speed; it may also be spinning the blades and rotor shaft to prevent warping when there is no wind§
I long suspected that the lone wind turbine at the headquarters of a wind power company beside the M25 around London was being powered from the grid rather than generating anything. I passed it often enough to see that on still days it was only turning during the rush hour.
They also like to keep the Blades turning to prevent Brinelling the Bearings.
Also keep them turning to prevent the shaft from “drooping”, especially since they are “overhung” shafts supporting a massive weight.
Wind turbines are basically alternators. The power is used to create a magnetic field which is much lighter than creating the same magnetic field with permanent magnets. This video should answer your question.
HVAC (Heating Ventilation and Cooling) system – needed to keep the computer and all other equipment at a safe operating temperature – in the neighborhood of several tons AC per MW capacity. Hydraulic Systems – needed to position the blades and to aim the blades in the direction of the wind, Lubricating systems – needed to lubricate all of the moving parts of the turbine – bearings, gears etc., Computers, anomoters, communications, etc. all of which use power and need cooled/heated and need fans. Lights for aircraft warning. Motors to rotate the blade, shaft connecting the blade to the gears and the gear box connected to the generator and the generator itself so that they do not sit in one spot and become warped.
Days of the magnet spun by a propeller blade and aimed by a tail on the end of the wind turbine, like the old farm wind mills are long gone.
Forgot to mention; generating facilities have TWO meters, input or power consumption and output or power generation. Two obvious reasons for this. Many generating facilities are located in an area other than the owners service district an/or are not even owned by the utility receiving the electricity. Second big reason is accounting. Input power is an expense. Output power is income.
Excitation, they get theirs from the grid. Most generators supply their own and the number is usually higher than 5 or 10% with the power factor of .85 being the rule of thumb(invest 1 unit of energy and get .85 in electricity)
Yes, and the grid that it is added to is not necessarily connected to their community at all. Some are just carried to other states. And don’t forget how much higher the electric bills get.
How many windmills would it take to power a factory that makes windmills?
Sandyb, I would also like to know the answer to that query. Can some one please name one industrial size steel mill that produces all its product consistently only from solar, wind, or a combination of both.
This is the best information I’ve been able to find. It was actually posted by someone here criticizing wind and solar.
http://homepages.uc.edu/~becktl/shaka-eroi.pdf
According to those figures, un-buffered wind takes about 5 years to generate as much power as it takes to build, and buffered wind takes around one year.
There are large asterisks on the most pessimistic figure and the most optimistic, but that’s about the most reasonable assessment I’ve seen so far.
However, that was written 8 years ago, and the cost in money and energy to deploy such systems has been steadily dropping since then.
Actually, Andi, you are quite fortunate in NZ with having so much hydro power. Hydro-electric generators are usually able to spin up from standstill to maximum output in a few minutes, and that can keep the grid stable while the wind is fluctuating.
In parts of the world that aren’t so blessed with topography and water, they need to have backup generators, usually single-cycle gas plants that operate at around 30% efficiency, ready to take up the slack. So there’s not only the cost of having a whole parallel network of fossil-fuel powered generators, but there’s the waste of energy in those low-efficiency gas turbines. If they didn’t have to spin up when the wind stops blowing (or blows too hard) – i.e. in a properly managed electric grid – they could mostly be combined-cycle gas plants with efficiencies better than 50%.
When you factor in all that, your wind power in hydro-deficient regions could well end up using more fossil fuel than it saves.
The nominal reason for wind turbines is “saving the planet”. The real reason for wind turbines is to make shed loads of money for politically-connected wind-power developers.
The hydraulics on the Snowy Mountains power stations are old, and new designs may be able to do better. You say: “Hydro-electric generators are usually able to spin up from standstill to maximum output in a few minutes, and that can keep the grid stable while the wind is fluctuating.”
When my wife and I inspected the Tumut Power Station many years ago, it was apparent that the turbines were permanently turning. This meant that the alternators were constantly in phase with the AC Grid. It was reported that when “Country Practice” finished, and 5 million housewives got up to put the kettle on, this was immediately apparent in Tumut because as demand soared the valves were opened, and there was a roar with the rush of water through the turbines. Keeping the turbines turning all the time mean no problems with trying to get the phase correct before putting the alternators on line, and also meant that all the lubrication was operating correctly. Stop the turbines and you have problems with loss of lubrication and possible warping – although that is not as bad as steam turbines on a steam ship where it was the practice to warm up the turbines over a period of 8 hours before sailing to ensure the turbines were warm and the propeller shafts were not warped. A blast of steam every 15 minutes or so was the general practice – and we cadets had to sit at the stern when the ship was in Royal Albert Dock to warn lightermen that the propellers might turn any moment. Perhaps the most boring job we could do!
With no water -or hardly any – in the turbines, they could spin quite happily and do no work – just absorb a minimal bit of energy until they were needed to be on power. Then open the valves (done automatically) flood the turbines and they were at full power.
reason for wind turbines is to make shed loads of money for politically-connected wind-power developers.
And don’t forget the kick-backs for the political connections too.
Yes, nice work, Andi. Here’s more context from Transpower showing the total generation mix:
Hope the html comes through. If not, here’s the image I’m trying to display. That might make two of them, sorry.
Actually where I get my data from on a 5-minute grab is https://www.transpower.co.nz/power-system-live-data
Maybe I need to correlate the two!
Thanks for the link, always looking for live feeds.
Sub-30% is not shocking to me.
But I suspect this data will cause a nasty bout of cognitive dissonance denial though for the wind energy True Believers.
Yes, nice work, Andi. Here’s more context from Transpower showing the total generation mix:
Nuclear is the obvious future of power production. My calculations based on the estimated build costs for next generation molten salt small nuclear reactors indicates that they provide everything one could possible as for – no emissions, inherently safe, tiny geographical footprint, no need for bodies of cooling water (can be located anywhere – in towns, cities,etc) , can load follow (act as baseload and peak load generators) , can produce power for $40 per MWhr, will ommercilaize within the next 10 years, can be built in factories, require very little site preparation, etc In other words, everything one could possibly want in a power generation technology. But the greenies are pushing unreliable and costly primitive technologies like 16th century windpower.
I am also hopefully optimistic about the next generation MSR’s.
But, we still need to see a few different MSR designs in actual operation through lots of on-line refueling cycles…and surviving metal corrosion limitations over the long run. New tech hardly ever lives up to the optimistic hype of its early advocates.
On paper they look good and Thorium is plentiful and there is proven tech involved…so no reason not to proceed and lots of reasons to accelerate development.
I’m all for terminating the large investment we are still making in magnetic confinement fusion (it’s probably easier to control the global climate than to control the chaos inside a fusion magnetic confinement cell) and I’m all for moving more resources into MSR technology development.
News from Ontario, Canada.
The irony of this is that Ontario for all its money spent on subsidies for renewable energy, is not even reducing C02 emissions. We have been sold a bill of goods by our government, and by the environment movement in general. Neither wants to admit that this scheme has been a huge failure.
OSPE (Ontario Society of Professional Engineers) have written a number of reports that show the difficulty integrating intermittent wind energy into the electrical grid. For details look at the document and the comments following: https://blog.ospe.on.ca/featured/ontario-wasted-more-than-1-billion-worth-of-clean-energy-in-2016-enough-to-power-760000-homes/
Engineers’ reports are significant because they are legally bound to report success (or failure) of their projects. Reading the reports you’ll see what we have suspected all along. Engineers must follow government mandate (move to Green energy), but they cannot show a reduction in C02.
Andi,
You are fortunate in being able to count hydro as a renewable. Here in the USA and especially in the Pacific NW the bureaucrats specifically forbid counting our extensive hydro system as renewable. The anti everything good freaks were so concerned about saving all the salmon and other species their objective is to remove all the dams on the Columbia River and the greens figured that if the percentage ‘renewable’ got too high there would not be enough pressure to get the money appropriated. And without that money they could not buy off the politicians by ‘contributing’ to their campaigns.
Finding the data is near impossible, and when you do, I would bet a buck that it is not actual output but “self-reported”. Meaning the utility fills out a form and sends it to the government. Stating what the output was. I have seen non-functioning plants reported on the US government’s website.
There are no column headers. I don’t see plated capacity of 658. Must be showing average MW? I’d like to know units if you would add the headers to the CSV. There is a LOT of info there, including a ton of time that the units were giving zero or negative power. A summarized MWH figure for total energy might be interesting.
Sorry Michael
The headings are:
Date,North Island Plated,North Island Production,South Island Plated,South Island Production,Local Wind (unreliable)
The data for North Island and South Island are published separately so I record them as such. The final column is the wind measured at my home amongst a large North Island windfarm – but this is pretty unreliable with “no data available” being either 0 or -1. To get total capacity and production add the NI and SI figures together.
ie Total Plated = 564 + 94 = 658
I’ll update the .CSV reference file.
Cheers
Andi
Interesting… Only looking at the North plant, there seems to be a weak correlation to wind speed, with a huge spread. This is somewhat expected since you can pitch the blades to optimize total power. You can still get quite a lot of power, even during times when wind speed is near zero at your house (after filtering out the non-readings). The other feature is that as long as wind is very high, they almost never produce a small amount of power. But they CAN produce near the peak power (300 ish), even with a small to moderate wind. This doesn’t pass the smell test. Is there video of these things cranking along when you measure little wind? And it isn’t a small area or a few times where wind weak at your house, it is a huge feature on the chart.
There seems to be a brick wall at around 307MW. In other words, no matter what the nameplate is, there seems to be no combination that will ever go above 307 (or they just never needed that much), but that doesn’t seem likely. I would say the data shows it is impossible to get near the nameplate rating.
The turbines I see do seem to stop in zero wind, but there is a showcase single turbine (featured in my original article) that does seem to turn at impossible wind speeds.
I’ve been there when you could drop a feather and watch it fall straight down, yet the turbine turns quite energetically – this is however a sight-seeing location and was the location for the first research installation. The original turbine died, so was replaced.
Cheers
Andi
“New Zealand already produces more than 80% of its energy from Renewables” Shouldn’t that read “electricity” instead of energy?
I am as anti-AGW as is possible.
AGW is purely political. Worse than wasting $Trillions, AGW is sullying and debasing science…this is ugly and despicable beyond description. It is destroying our sacred institutions of science. I hope I live long enough to see these perpetrators convicted and pay/suffer sufficient to their crimes (somewhere…somehow)…including the lying propagandists in the press and all the cowardly scientists that remain silent in the face of this abomination.
Having said all that, I don’t hate wind generation (I think they look kind artfully graceful…sucking up energy from the wind…just NIMBY :-))…but Wind should not get more government subsidy than any other energy source. If investors can’t make money without special AGW subsidies they should lose their investment funds. Period. Then the market would justly and fairly adjudicate the viability of Wind Power.
Wind generators should only be sited where they don’t kill endangered birds. I really hate that. Nobody (including Hillary Clinton…after acquiring some “endangered” feathers illegally) should be able to skirt legitimate endangered species laws…they are laws (if you don’t agree with them…work to change the laws…or get over it). I speak out when “species” regulations are too stringent or too lax…many/most are excessive to my mind.
We still have lots of REAL environmental problems to address, which is another reason that I hate wasting all these $Trillions on non-existent AGW concerns.
If there is any justice in this world we will see these seekers of illegitimate power suffer and pay. If we see declining temperatures (as is likely over the next decade or 2) I for one will never never never stop pointing out that the lying liars were lying all along.
The Wind Power advocates were lying (even when leaving out the significant issue of inconsistency of power production…so “double fail”). The proof is now in. It’s time to pull the plug on Base Production Wind.
Engineering and technology may eventually bring wind “back”…but that should only be on the basis of a legitimate niche established in the free market.
Ontario Power has a website which posts hourly generation for each generator at each station plus wind, solar, biomass power and the current prices.
I am pretty sure you can go back in time for earlier records.
The Southwest Power Pool has real time which is moderately interesting. They also have csv files of historical data by generator type in 5 minute increments.
Great reading there Andi. I live on the Manawatu plains west of Palmerston North so I am more than familiar with the impact of wind farms on a region. I was a little surprised to see the percentage for Nov 2018 so low. Normally the windiest month on average in NZ period, last Nov here in Palmy North saw a daily mean wind-run of 324 km, about 11% above the long term mean. I am not a fan of the wind turbines in our area, and certainly don’t believe that we need to blot our landscape with them.
Another windfarm is currently being rushed into construction directly behind the city because its resource consent is about to expire. Those who stand to make copious amounts of money from these machines are very keen on selling the idea, or should I say myth, of their benefits. Those of us how are not enamoured of them find our ranks growing, hence the rush for this latest one to beat the axe.
I notice that you included a picture looking along the ridge featuring the so called show case wind farm, Te Apiti, with Wharite Peak in the background, which is BTW the windiest place in New Zealand where there is an anemometer to record such. Wharite is just on 3,000 ft high (just over 900m) so there are likely more windier spots in NZ. The interesting thing about wind run is, just like other features of our weather and climate, it is variable. Despite all of the hype about the ‘windy Manawatu’ we do have lengthy calm periods. The 1950’s & 90’s were noticeably calm compared to the rest of the period since the end of WWII. My point is even here where the Roaring Westerlies are ingrained into our psyche, you can’t rely on wind!
Wind data from AEMO grid in Australia that covers Qld/NSW/Vic/Tas/SA.
Nameplate capacity 5,661 MW.
Average generation 1698 MW, so 30% capacity factor.
Variability in supply 200-4,000 MW, lowest week 870 MW average.
One example of costs is wind farm near Ararat in Victoria.
75 towers, nameplate capacity 240 MW, capital cost A$450 million.
You say that no capacity has been added to the grid by the turbine farm. What do you mean by that? Obviously all those MW produced have added something.
I mean no change to plated capacity – ie commissioned turbines.
Cheers
Andi
It is downright bizarre that this delusional obsession with wasting money is so widespread.
Every day are new reports regarding how little they actually produce, how many birds and bats they kill, how oversold they are in terms of years of useful life and failure rates, dreadfully concerning reports of the long term health consequences of the sounds they emit, and so many other problems and shortcoming.
And right at the top of the list of ridiculousness’s is that these things may not wind up making a whole lot more power than it costs to make them.
I think its funny that people are arguing for wind turbines because they might produce less than half their rated capacity – 40% – on average… but not all the time.
Nuclear plants can produce 90% or more of their rated capacity day in and day out. And require a lot less land. And are reliable. Its called a stable base-load.
Solar PV has an even lower capacity factor than windmills at New Zealand latitude…maybe 18% to 20% if you are lucky with a PV Park and probably more like 15%-16% realistically or less with roof top. And less if it snows in winter. With solar, you can at least predict you will have peak generation about 2 hours either side of noon, but you never know with wind. A lot of times, wind is in the middle of night when temperature differentials are the greatest, but that is the least desirable time to have it generated for the grid.
It is really too bad that NZ doesn’t invest the final 20% required firm capacity in large hydro, small hydro and geothermal. Being a mountainous country, small hydro is semi base load for the season that does have water and that resource is barely tapped. NZ certainly is well situated to also be 100% renewable very easily with these available eternal resources. Do what has the best capacity factor, best cost and the maximum longevity of technology. Wind doesn’t come close in any metric to any of the three I mentioned.
Earthling
We have the slight consideration of also being on the boundary of two tectonic plates, Australian and Pacific, which divide the country nearly equally in half. The Southern Alps being the most prominent example
We do have earthquakes fairly often, add in the occasional volcano burping and it is an interesting country to find suitable places to build hydro without knowing that everything downstream is going to be washed away whenever the earth moves.
Geothermal is another source that isn’t used to full advantage as well.
Right you are Warren…but so does California and many other jurisdictions. Risk is part of the equation, but unacceptable risk isn’t. I understand that. Site specific surveys should be able to conclude what is acceptable risk and what isn’t. Large dams and hydro is also getting more expensive to build, especially when you factor in the pre-planing and permitting, including the legal and social costs of endless consultation and court cases. But it sure does have an excellent life span, compared to say wind. But wind in NZ also works very good with large hydro (storage) as one can retain storage when the wind blows and hydro is a spinning reserve that can ramped up almost instantly to meet demand. So your wind industry isn’t a total loss, but it is expensive.
Small hydro represents almost zero risk from earthquakes if there isn’t considerable water storage involved behind a big dam. And New Zealand, as you say, has the Southern Alps and is very mountainous and hilly overall. Run of River installations are very efficient, especially with a higher head component which New Zealand has. It is sad to see such a technology wasted because of opposition to the water being utilized for 5 minutes before being put out back in the original creek and water shed it originated from. It is also near base load quality when the watershed is flowing, at least far more reliable and predictable than wind.
New Zealand is fortunate that it has so many renewable resources, including geothermal that has much more capacity to utilize. I think New Zealand could really be hitting above it’s weight economically with electricity heavy industries if it wished, but I fear with your new socialist Gov’t, it is going to slaughter your viable and successful livestock industry, on the alter of GHG climate change stupidity (methane emissions from animals) and you will be a back water because of the poor choice of Gov’t there. From what I hear and can see from here in British Columbia…where we have a very stupid Gov’t, including a stupid prime minister in Ottawa.
Many good comments on intermittent and unpredictable output. Not so much on pathetic energy density. And the fact that a wind turbine will never produce enough energy to manufacture and build and operate another windmill.
Let alone to demolish it and restore the site when it’s output has declined and it is at the end of it’s life. More like 15 years than the claimed 25 years.
The fact remains that, unless you have plentiful hydro and geothermal (in which case only a moron or a very venal virtue signalling politician would even consider wind), there will be a fossil fuel generator somewhere which is going to have to operate completely inefficiently, at great expense, in order to keep the grid functioning.
The energy density issue is interesting. Did you work out the area of land you would need to cover with turbines to replace the coal power from Huntley?
Even forgetting about intermittency?
Don’t forget the disaster at Pike River Mine.
OK, the design and operation of the mine were grossly incompetent.
But part of the design failings were directly attributable to the tiny area they had been allowed to clear. Why on Earth would anyone with IQ score higher than their hat size, install the main ventilation fan underground ?
No such worries for venal greenie wind farm proponents!
” a wind turbine will never produce enough energy to manufacture and build and operate another windmill.
Let alone to demolish it and restore the site when it’s output has declined and it is at the end of it’s life.”
I believe it, but it would be lovely to have a written out explanation of how and why.
“This graph depicts performance of wind farms connected to the electricity grid in south-eastern Australia over a month.
https://anero.id/energy/wind-energy/2019/february
The default, capacity factor graph shows the output as a percentage of registered capacity. On average wind farms in south-east Australia operate at a capacity factor of around 30-35%.
Alternatively, you may view the actual output in megawatts.
Different wind farms may be included or excluded from the graphs by toggling the check boxes. The total will update accordingly.
Data for the month-long graphs is sampled at 3 hour intervals to reduce the number of data points. ”
But that average hides a multitude of sins and how ridiculous it is to believe you can pack enough of Tesla’s 2170 lego brick lithium cells into rack upon rack to even get that one third of installed capacity dispatchable 24/7 all year round-
https://anero.id/energy/wind-energy/2018/june
check the number of low points in a month here-
https://anero.id/energy/wind-energy/2018/april
Arguing over a few percentage points of any such average value for various geographic locations is utterly meaningless particularly with the doomsday cult that believe they’re going to save the world erecting these religious monuments worshipping Gaia. These are people who believe in an average global temperature and their hands on a plant food global thermostat for Chrissakes.
Average capacity factors are very similar to UK ones as measured by the grid and archived in my gridwatch site.
The government figures are always 10% higher.
A discrepancy no one has ever explained.
‘the green movement vehemently oppose any new hydro projects’
Because some small furry animal might have to move habitat, I guess.
Actually snails, centipedes and several grasses. https://www.doc.govt.nz/nature/native-animals/invertebrates/powelliphanta-snails/
Yesterday wind was providing 30% of electricity in the UK, now it is providing 5%!
Reliable!?!
A few years ago the head of the National Grid said in an interview that in the future we would only have electricity when it is available. It seems as if we are near that point now.
And what happens when all those electric cars need charging. ‘ Sorry boss, I can’t get into work today, the wind didn’t blow last night ‘.
“we would only have electricity when it is available.” Just like Africa. Welcome to the 3rd world. Nothing a backup diesel genset won’t fix.
The Chinese didn’t worry too much in moving over a million people when they built the Three Gorges Dam on the Yangtze River.
And they arent worrying about building 500 coal plants around the world.
Meanwhile the UK aims to get 30% of electricity from offshore wind by 2030.
https://news.sky.com/story/uk-targets-a-third-of-power-from-offshore-wind-by-2030-11656866
Griff you need to get your head around marginal cost vs average total cost for an electricity grid as a whole-
https://www.thoughtco.com/relationship-between-average-and-marginal-cost-1147863
Clearly the marginal cost of your fickle whirylgigs is greater than the average cost of fossil fuel power which is why end consumer power bills are rising everywhere and are highest in States like South Australia with the greatest penetration of them.
Stuff the poor people as they have to be sacrificed for virtue signalling toffs like you eh? Howsabout a bit of a conscience and letting the poor eat Yellowcake if you don’t like plants so much?
It is worse than that. The amount of energy you produce from a wind turbine total lifetime is less than the amount of energy it takes to manufacture, operate and dispose of.
“Meanwhile the UK aims to get 30% of electricity from offshore wind by 2030”
Another example where it us inferred that we ALL want to get something or other. I have never been asked if I want this outcome, or any other of the ludicrous claims and assertions made by green proponents. What it should have said was “the UK government aims”, which is an entirely different matter…
Do you Kiwis have legislation like the Australian Large Scale Renewable Energy Target? See here: http://www.cleanenergyregulator.gov.au/RET/About-the-Renewable-Energy-Target/How-the-scheme-works/Large-scale-Renewable-Energy-Target
If so, you as electricity consumers are (perhaps unwittingly) subsidising ‘renewable’ generators at 100%! This iniquitous legislation has been spread from the EU to other wsetern nations since the mid-1990s. It is a cunning ‘not a tax, not a subsidy’ scheme that forces electricity retailers to buy almost all the ‘clean energy’ being generates, and also to buy a ‘clean energy certificate’ for every megawatt of this ‘clean energy’ that they buy. As the ‘market’ for these certificates is rigged by the legislation, in Australia these certificates cost more than a megawatt of base load electricity, pushing up the wholesale price of energy significantly, but in a way that it appears that base load generators are the cause, rather than the RET. As we Aussies say ‘that is as cunning as a rat with a gold tooth’. This iniquitous legislation will guarantee that base load generators progressively become bankrupt, and it will appear that they are the cause, rather than the RET and the hidden 100% (yes 100%!) hidden subsidy that ‘renewables’ get from the RET, paid for by mugs like me through this hidden burden on their domestic electricity bills.
Neat isn’t it? Fossil fuel generators subsidise fickle whirlygigs for their fixed investment costs in order to dump on them. Normally the ACCC would be all over one of the purest forms of dumping imaginable but instead we get Lord Nelson’s telescope.
What would be most interesting would be the times when the wind was at a minimum, rather than the total (or average) for the month.
“… results are as predicted – shocking.”
With so little electricity being generated, the results can hardly be “shocking”?
In Germany CO₂ output for 2009 was 905 million tons, after investing 100’000’000’000.- Euro in wind and solar
( Energiewende ) the CO₂ output in 2018 dropped dramatically to: (drumroll) 905 million tons!!! What a great success!! weiter so!!
Fuel cost for the diesel generator is the issue, not capitol cost. I don’t know how much fuel is needed, but add that cost.
NZ has the right Prime Minister to really get her teeth into this issue.
It is something she has in common with Occasional Cortex.
When you think about it they are way too similar. Wouldn’t want a BJ from either of them.
I encourage everyone interested in wind power to check out this link.
Also everybody with a sense of humour.
Especially a nerdy sense of humour.
By the way NZ hydro construction – very impressing :
https://www.google.com/search?client=ms-android-samsung&ei=zHCCXLvMNejPrgSc2IrgCg&q=tv+documentary+new+Zealand+hydro+construction+&oq=tv+documentary+new+Zealand+hydro+construction+&gs_l=mobile-gws-wiz-serp.
– and not powered by windmills.
I used to live with someone who worked for one of the power companies, I don’t recall now however, he used to calculate how far one of the dams, Clyde I think, would move in an earthquake. He said, paraphrasing a bit from memory…”…the dam was made to be able to move up to 6 metres on either axis (X, y or z)…”
Pretty impressive.
Anthony, data of individual NZ windfarms.
Hopefully appropriate:
https://www.google.com/search?q=data+on+individual+new+Zealand+windfarms&oq=data+on+individual+new+Zealand+windfarms&aqs=chrome.
Made a plot from within LibreOfficeCalc. It is very crabby and I will do a more serious one later. I just wanted to see the flucturations, because the average production is in reality not a very useful figure, it is the min production that is interesting, as you need to maintain on-demand capacity for consumption minus wind production.
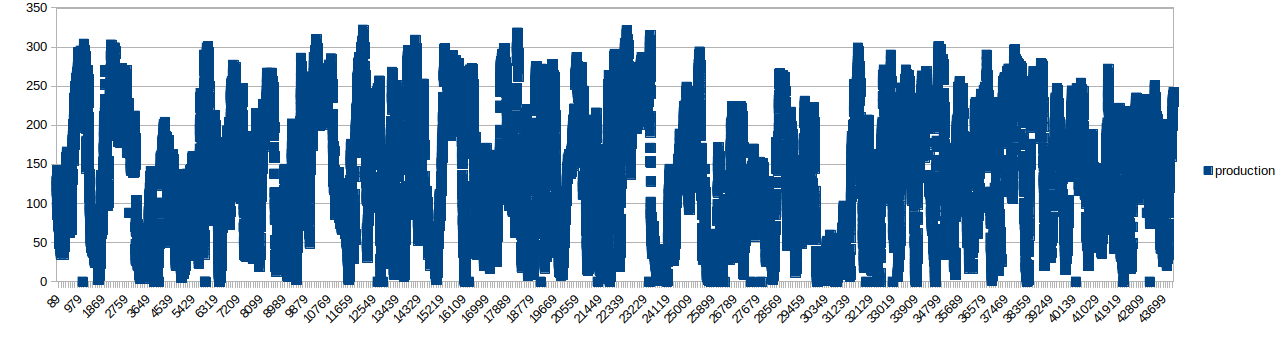
Wow, now there’s some consistency of output!
Thanks, Carl.
But on your next plot, could you please label both axes, and select either line or bar graph type?
Or explain why your selected graph style was chosen.
I’m embarrassed to ask you to do more work, but until you do, I can’t explain to others what you’ve achieved there.
Nice work Andi. I wish you could show also the “anti-generation” that is always missing from these gross output numbers. Namely, the input the find farms absorb during the non-producing times such as during “windless” times, during repair and maintenance, when wind is too high. While such energy consumption represent a negligible amount at heat plants it is significant with renewables. The energy in electricity, natural gas, gasoline, diesel fuel – it ads up to 10 % in bad sites.
“we get some pretty impressive winds – 150Kph is not that unusual”
.
150 Kph = 93 Mph
.
Wow, hurricane winds are not unusual?
Yep, the Cook Strait tends to funnel the winds which is why this site was chosen for their “West Wind” installation.
Richard, I used to live in that part of NZ, Wellington region (And actually worked with Andi) and a bit further north, Featherston. 150kph winds were not unusual at all. In fact, sometimes the Rimutaka Hill road on state highway 1 between Wellington and Featherston would be closed due to wind.
The UK now has 20GW of wind capacity, about 2/3 of typical demand. It seems to produce about 5GW on average, about 25% capacity factor. Which matches your NZ results quite well.
So, the answer to low capacity factor could be just to build four times as many, and I’m sure the Greens and their wind industry backers would be rubbing their hands to together with glee at that suggestion.
The issue is, though, that outages of up to three weeks with next to nil output over the whole UK are not uncommon. It’s difficult to see how that one can be worked around without resorting to fossil fuels.
The other resolution would be to build nuclear backup, eg thorium, but then if you have the nuclear capacity to meet typical demand, why do you need the wind capacity anyway? You don’t.
This would be a typical reaction of Greenies. They are stupid enough to disfigure the landscape with four times the number of birdchoppers needed just to try to compensate the underperforming yield. But when the calms hit, they hit all these ugly machines and not a single kwh can be harvested by any of these impotent giants. Stringent logic conclusions have never been the outstanding feature of Grrrreenies, but stupidity certainly is inherent and prevalent in their limited world of thinking.
The problem here is that all this nonsense has to be paid for. If a crooked politician steals a ton of money and lives the life of Riley with the proceeds at least the money finds its way back into the local economy. However the money is just being wasted. In many cases, certainly here in Thurrock, working infrastructure has been destroyed! The windmills need not have been installed in the first place! Chances are the blasted things were built in China using electricity generated by burning coal! Somebody wake me up and tell me it was just a bad dream!
Anthony Watts said:
“I’ve just done my first analysis, and the results are as predicted – shocking.”
What is shocking about those figures?
Andi ==> Don’t stop your recording of the data ..eight months is a tiny tiny sample — but as time goes by, your sample gets better and better and can be used to check official claims. Nice idea, nice project!
Thanks Kip. Yes project is ongoing and 5 minute intervals were chosen to make up for some unreliability both in accessing the source data and the pathetic Chinese weather station I currently run at home.
But will keep running – as Isaid this is just my first analysis. Let’s see what we get after a year!
Cheers
Andi
I find it highly disturbing that at the bottom of the article the data is made available, what kind of science makes the date available!
What could possibly be wrong with an intermittent power supply, that has a big environmental foot print, a maintenance profile like an aircraft 200′ up in the air and kills birds.
Andi,
Capacity factor is the ratio of energy produced in MW-hrs divided by the theoretical energy produced (Name plate power x the same period of time). I believe that your table column label should be “Average Power Generation” and not “Energy Generation” to be correct. Is that what they report? Utilities are focused on the MW-hrs since this is what they usually bill customers.
Hi Jim, quite correct. I will update on my next analysis
Cheers
Andi
Andi, do not do what Jim suggests. You are right in specifying output in watts (kW, GW, TW …) just as the people who specify the name-plate output in watts (kW, MW, …) are correct. Please stick with your unit or percentage just avoid the verb “generated.” It is “generation.”
Capacity Factor is simply the ratio of the “actual output” to the “name-plate output” and times 100 if expressed in percents.
Speaking of CF, its ultimate value is the output averaged over the life of the plant (wind, solar, nuclear or coal) where the nominator is the net value, the “net” meaning “minus the power delivered from other energy sources be it in the form of electricity, natural gas, gasoline, diesel fuel, aviation fuel, propane, …. needed in the operation during those typical 20 years.”
The true, life CF(life) may be a half of the CF delivered under the best conditions, as is often proclaimed in the daily and pro-renewables press.
The EIA updates their databases monthly. The AVG capacity factor for a few non FF technologies in DEC:
Wind- 38.3%
PV- 15.1%
CSP-7.0%
Nuclear- 96.9%
Geothermal- 80.8%
Ref- https://www.eia.gov/electricity/monthly/epm_table_grapher.php?t=epmt_6_07_b
There seems to be something wrong with the wind farm results.
Generated Mw is a peak load that could apply to a very short period only. It has no bearing at all on the quantity of electricity generated over the period.
Mwh is the generated quantity of electricity which should be the point of the whole excercise. Actual Mwh then compared to the maximum possible (nameplate rating and total time available) would be the indication of the generating efficiency of the installation.
You may find these parallel analyses useful:
Quesstimates of amounts of waste from Renewables
https://edmhdotme.wordpress.com/usa-2016-renewables/
https://edmhdotme.wordpress.com/uk-weather-dependent-renewables-in-2018/
https://edmhdotme.wordpress.com/eu28-weather-dependent-renewables-in-2017-and-indicative-costs/
FWIW. In the United States, the average capacity factor (CF) for wind for 2013 through 2018 was ~34%. See Table 6.7.B here: https://www.eia.gov/electricity/monthly/epm_table_grapher.php?t=epmt_6_07_b (U.S. Energy Information Administration). However, the CF for wind varies considerably by region and by state. Nuclear generation has the highest CF for those 6 years, ~92%.
In 2018, wind accounted for ~7% of total megawatt hours (MWh) generated in the USA, see https://www.eia.gov/electricity/monthly/epm_table_grapher.php?t=epmt_1_01. Natural gas and coal accounted for 63% of the MWh and nuclear, ~20%. While generation share of non-hydro renewables (wind, solar and geothermal) have quadrupled since 2008, the share of total generation is still small, ~10%.