Increased exposure for airline travelers at high altitudes.
New data released by the Earth to Sky Calculus/Spaceweather.com high-altitude ballooning program show that atmospheric cosmic rays are intensifying for the 4th year in a row–an ironic side-effect of the decaying solar cycle. The new results are of interest to everyone from astronauts to air travelers.
This finding comes from a campaign of almost weekly high-altitude balloon launches conducted by the students of Earth to Sky Calculus. Since March 2015, there has been a ~13% increase in X-rays and gamma-rays over central California, where the students have launched hundreds of balloons.
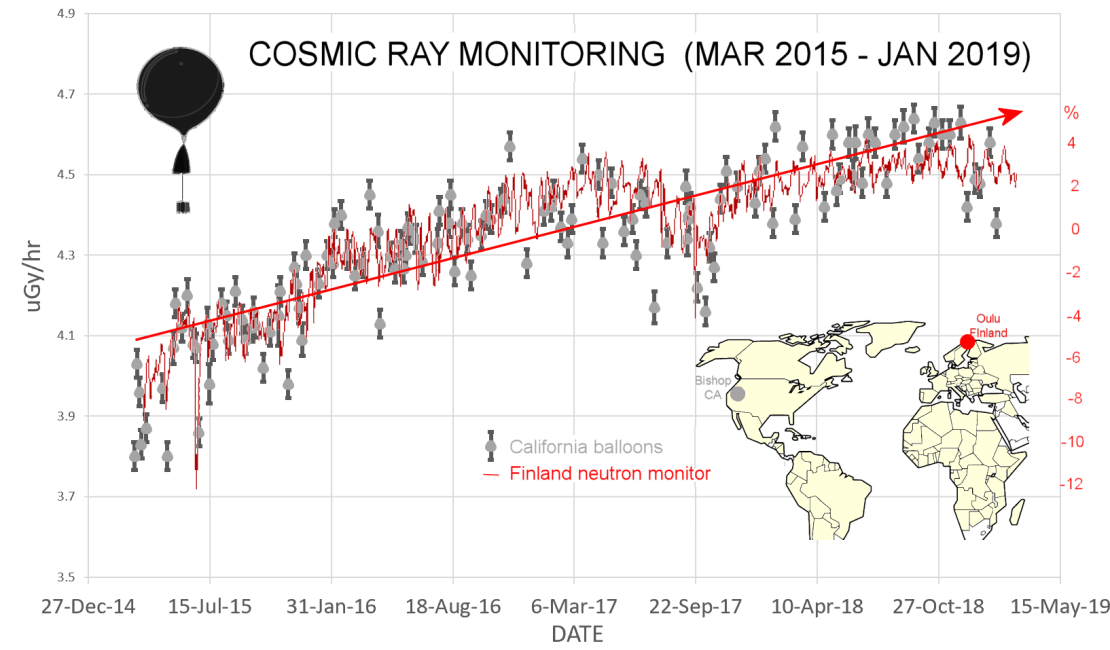
The grey points in the graph are Earth to Sky balloon data. Overlaid on that time series is a record of neutron monitor data from the Sodankyla Geophysical Observatory in Oulu, Finland. The correlation between the two data sets is impressive, especially considering their wide geographic separation and differing methodologies. Neutron monitors have long been considered a “gold standard” for monitoring cosmic rays on Earth. This shows that our student-built balloons are gathering data of similar quality.
Why are cosmic rays increasing? The short answer is “Solar Minimum.” Right now, the 11-year solar cycle is plunging into one of the deepest minima of the Space Age. The sun’s weakening magnetic field and flagging solar wind are not protecting us as usual from deep-space radiation.
Full story here
What are the chances that Svensmark’s Theory will be validated? link I noticed this graph in the wiki Svensmark article. The horizontal axis is in millions of years. The vertical axis should be in temperature and flux but flux is missing. Obviously, both flux and temperature are based on proxies. It makes me wary of the validity of the graph.
Is it possible that Svensmark’s theory is correct over geological time scales but not for shorter periods?
I’ve always liked his theory…especially the part where he claims he can chart our Solar System’s travels around the galaxy. Seems like some of his ideas have been validated in particle accelerator experiments but I also recall hearing evidence against it too. In my mind Nature’s jury’s is still deliberating. I haven’t followed this closely enough to offer much more.
Short term variations of 1-2% are common, here is up to date the neutron count
http://cosrays.izmiran.ru/images/now.png
There is a basic physical principle which dictates that the count varies between odd and even sunspot minima, weather peak count is high and short or somewhat lower and longer lasting
http://hockeyschtick.blogspot.com/2013/04/paper-finds-another-amplification.html
http://2.bp.blogspot.com/-9Yjir_xvgO0/UWWqV7ofm3I/AAAAAAAAFGY/Qxn9IxfngF8/s1600/ScreenShot3386.jpg
There is an effect there are a number of experiments that have shown that. The problem is that it is hard to quantify the scale of the effect simply due to lack of data. It is more likely to work over long timescales if it worked heavily over short timescales we should not be having trouble with the scale of the effect. A small imbalance over a long period can be a lot of energy.
It is validated. Ever used a cloud chamber in physics to detect alpha, beta gamma particles? There is a vid on you tube of a cloud chamber up a mountain picking up cosmic rays. It is a very old and well known fact, these particles condense vapour.
An interesting story behind the development of the Wilson Cloud Chamber. Charles Wilson had been stationed on Ben Nevis to study the weather, whilst there had seen the Brocken Spectre so later developed to cloud Chamber to study cloud formation. The trails left by ionising radiation soon diverted his research and the rest is history.
Another example of research into one thing leading to a totally unexpected discovery and whole new field of study.
My 8th grade science class built a cloud chamber and it worked. Thank you Bruce Quantic.
I wonder how many junior high students get to build a cloud chambers in this, the following century.
==================
The red curve in Svensmark graph is fake. Nobody has measured cosmic flux over hundreds of millions of years and there isn’t any proxy for that. It is based on Nir Shaviv hypothesis of the crossing of the galactic arms by the solar system. The problem is that is also a hypothesis, as we don’t know where the solar system and the galactic arms were hundred of millions of years ago. All we know is the approximate speed of the solar system.
So it is turtles on top of turtles all the way down. A nice hypothesis that might not be proven correct or false ever. That ain’t science.
The Suns way “down ans under” the galaxys aequator
Will be only understand as hint in concern of Shavivs work
No proxies for cosmic rays? Supposedly 10Be in ice cores is a proxy, but that doesn’t go back millions of years. There also may be problems with that proxy anyway. link
Push me over with a feather. I always assumed that clever people had found proxies for everything.
Thank you Javier.
That graph makes it look more like it’s leveled off.
Or even dipped slightly.
The headline is misleading. The fourth year did not bring any increase.
We are reaching a Solar Minimum … it is supposed to level off and then start going down 🙂
“Why are cosmic rays increasing? The short answer is “solar minimum”
No, the answer is no recent large volcanic eruptions, and reduced SO2 aerosol emissions from China.
Sulfur Dioxide aerosols intercept much of the incoming cosmic radiation, making it impossible to determine solar irradiance levels from surface measurements.
When there are fewer aerosols, the cosmic ray flux increases (as now), and with the next VEI4 or higher eruption, you will see them decrease
So, the grey points on the graph were taken by high altitude balloon (100 to 120k feet up) as far as I can tell from the Earth to Sky Calculus web site. Are there SO2 aerosols up there, intercepting cosmic radiation?
?
How does Sulfur dioxide reduce the detection of cosmic rays? I am speaking of primarily protons and helium nuclei which generally strike a molecule in the atmosphere and create a cascade. Are you suggesting that cosmic rays behave differently when striking a molecule of Sulfur dioxide than, say, O2 or N2? That there is no cascade?
How then would detectors in space be registering more cosmic rays? SO2 cannot be affecting measurements made in space.
Not to seem rude, but I am not following.
—
NASA Voyager 2 Has Detected an Increase in Cosmic Rays That Originate Outside Our Solar System
By NASA // October 7, 2018
http://spacecoastdaily.com/2018/10/nasa-voyager-2-has-detected-an-increase-in-cosmic-rays-that-originate-outside-our-solar-system/
WxObserver
At this time, no.
Robert of Texas.
An SO2 aerosol (fine droplet of H2SO4) is mullions (billions?) of times larger than a nitrogen or oxygen atom, so cosmic rays , in many cases, should strike one of them rather than a much smaller molecule. In striking one, it will not be generating any Oxygen or Nitrogen isotopes, so their flux will be reduced.
Pure speculative nonsense!
Check the cross section of an SO2 aerosol vs the total amount of air up there.
The atmosphere consists of say 78% nitrogen and 20% oxygen and aerosols – and I believe the aerosols are measure in ppm.
It appears there may be millions if not billions times more nitrogen and oxygen molecules then sulfuric acid.
Also, sulfur is present in the intergalactic cosmic ray zoo – in small amounts – I can’t remember how small.
It’s possible sulfur may be present in the solar wind too.
“The atmosphere consists of say 78% nitrogen and 20% oxygen and aerosols – and I believe the aerosols are measure in ppm.
It appears there may be millions if not billions times more nitrogen and oxygen molecules then sulfuric acid.”
Exactly, I expect the effect of a couple ppm of sulfate aerosol on cosmogenic isotopes creation to be negligible.
Galactic cosmic ray protons have tens of MeV to GeV energy and create nuclear reactions with most nuclei they encounter in the atmosphere or on the surface. That is the source of most atmospheric neutrons, and is the cause of radionuclide production (e.g. 14C, 10Be). When the Sun is in an active phase, its outpouring of somewhat lower energy protons and their associated magnetic fields repel part of the incoming cosmic ray flux. Conversely, when the Sun is in a low activity phase, more cosmic rays reach Earth, causing more nuclear reactions and a higher neutron flux. Atmospheric SO2 is no more important than e.g. N2, O2, and Ar.
The hypothesized connection with global temperature is that increased atmospheric reactions produce more ionized particles, which act as nuclei for cloud formation, increasing global albedo. Theory sounds good, but direct evidence for this explicit connection is weak.
Hi, I am not trying to discredit your comment, but it would be useful to have a link to some type of scholarly article that backs up your assertion. Otherwise, this is only your say so and not authoritative.
Richmond,
Here’s a link to a NOAA website on GCRs. Don’t know if this is “scholarly” enough for you, but probably a good place to start your own research.
https://www.swpc.noaa.gov/phenomena/galactic-cosmic-rays
Has an awful lot of other information too.
Second paragraph:
So nothing to do with SOx and NOx from volcanoes then?
Richmond:
It is late, and I have to retire. However, I do have an analysis which proves my point. I do not know of any other references. Will try to post it tomorrow.
That’s the silliest thing I’ve heard in a long time. I didn’t expect to read an even silliest one but then you said:
It is clear that you have not even a remote idea what you talk about.
Javier, Richmond, Astrocyte, et al:
There is a graph “Solar Irradiance, 1880-present (which can be Googled)
It was constructed using proxy measurements, the same as those used to show the Maunder Minimum, which purports to show that the low sunspot activity at that time was the cause of that period of lowered Little Ice Age temperatures (even though they were already falling decades before the start of the Maunder minimum).
With respect to the “Solar Irrradiance” graph: It shows, for example , a solar MINIMA between 1983-1986, which coincides with the 1984-85 La Nina, caused by the El Chicon eruptions of 3-29-82 (VEI4+) and 4-3-82, (VEI5). Their SO2 aerosol emissions (~17 Megatons) reduced the amount of sunlight reaching the Earth’s surface, causing the La Nina (and the reduced flux of proxy isotopes).
It also shows a large solar MAXIMUM (again, for example), between 1985 and 1995 which encompasses the El Ninos of 1986-88, 1991-92, and 1994-95, all of which were caused by a reduction in global SO2 aerosol emissions, and a consequent warming of the Earth’s surface (and an increase in the amount of proxy isotopes).
Finally, satellite TSI measurements are available for those identified periods, and they show NO corresponding large changes in solar output.
All of the above proves that atmospheric SO2 aerosols interfere with the measurements of incoming cosmic rays, whether from proxy or balloon measurements.
It also implies that we should not be worrying about falling temperatures because of the current low sunspot activity.
Burl, I think you are mixing solar irradiance, photons mostly between UV and NIR, and galactic cosmic rays, mostly high energy alpha particles.
Astrocyte:
No, that is not what I am doing.
Changes in the amounts of the isotopes formed by cosmic rays were used as proxies to infer that the sun’s irradiance had changed.
This is what has been done. My point is that is actually impossible to infer any changes in solar output, or levels of incoming cosmic radiation, from the Earth’s surface because of the effect of blocking SO2 aerosol emissions.
Burl,
Now you have shown you don’t even distinguish between cosmic rays and solar irradiance.
Keep digging.
Alternatively start studying.
Javier:
Read my previous reply to Astrocyte.
Their is no confusion on my part.
Is there a graph somewhere showing low cloud cover over the same period?
The Planet cools. Nothing will stop it. No theories, no graphs, no charts, no politics. Nothing.
And what is coming is going to cause unimaginable distress.
Well,assuming you are right about the planet cooling, I can assure you that we Texans will not be in unimaginable distress, unless of course all those nut-cases in New York who think they are going to convert 100% of our power to Green Energy in 10 years moves down here to stay warm. That will be cause distress.
I don’t know if you live near Dallas, but the Perot science museum has an interesting display/discussion about this. During the last ice age eastern Texas was a cold non productive prairie desert. Today the Eastern half is very wet. When we get out of this interglacial, it won’t be good for Texas either.
” During the last ice age eastern Texas was a cold non productive prairie desert.”
You just described Kansas… LOL People live there.
Yes, I realize that when the inter-glacial ends, its going to be difficult for cultures to adjust. But that is what humans do best (when they are not running in circles screaming with their hair on fire).
OK, seriously…The end of a inter-glacial event takes time…average temperature doesn’t just drop by 10F degrees over one year. We likely would enter a series of cooling events over a period of 100 to 1,000 years. That is plenty of time for a an advanced Western civilization to adapt (gene-editing, nuclear power, water purification from the ocean, warmer housing). Places that do not produce much food now could be irrigated to produce much more food, and northern areas would become more like Canada. A lot can be done in 100 years.
Effects to third world countries might be severe and advanced areas might not have the resources available to help them as much as they need – so yeah it might be a terrible time – but I stay optimistic that civilization will stay ahead of starvation.
It’s always interesting when one hears claims like this to investigate some of the large animals that lived during the last glacial.
The rivers of East and Central Texas are well known fossil hunting locations for Ice Age animals.
Abundant stone tools have been found in the Caddo area documenting man’s use of East Texas as hunting grounds.
https://www.texasbeyondhistory.net/tejas/ancestors/images/dalton-map.html
East Texas prairie? Yes.
Desert? No.
Just a mile of ice over our great northern cities and most of our arable land reduced to LESS productivity. What could go wrong? Pretty sure I’ll be dead though.
I love seeing a hypothesis in the act of being tested. With cosmic ray activity increasing, Henrik Svensmark has made a testable prediction of more cloud cover, and that could lead to cooling. We can measure and compare cloud cover over the tropics.
I hope he is right. I am tired of all the guessing and would like just ONE prediction to work! LOL
Of course, I am discounting the AGW prediction of “Some places will warm, some will cool, some will get wetter and some will get dryer”. I guess if you consider that a “prediction” then it has been validated. Heck, its all true of my own backyard.
Robert,
There is at least 4 years of data in the above graph showing that cosmic ray flux has been increasing
while all the time temperatures have also been increasing. This would provide 4 years of evidence that
Svensmark’s theory is wrong or at best the influence of cosmic rays on earth’s temperature is very slight.
Very superficial Percy. The oceans are a massive heat sink. There is always a hysteresis effect therefore a time lag.
TedM,
The oceans just make it worse. All of the ocean temperature measurements have shown a long term steady increase in temperature over the last 100 years. There is absolutely no correlation between cosmic rays and ocean heat content.
First off, claiming that we can measure the temperatures of the oceans at all 100 years ago is a lie. Claiming that we can measure it’s temperature to a few hundredths of a degree is a gargantuan lie.
Secondly, claiming that we know the temperature of the oceans today, to a few hundredths of a degree is stretching the truth to the point where distinguishing it from a lie is no longer possible.
A few hundred probes, even if they were accurate to 0.01C, can’t measure the temperature of the oceans with that kind of accuracy.
Finally, even if you could show that the oceans have been warming for 100 years, given the thermal lag of the oceans, such a warming does not disprove the claim that there has been less energy put into them over the last 4 years.
therefore a time lag
Svensmark claims there is no lag…
There are results that show changes in as little as 15hrs, the weakness of the argument is not that it is the one covered in Benestad (2002) 🙂
Gross assumptions and pitiful correlations do not disprove or prove anything.
“4 years of data”; what a joke!
Oulu has data going back to 1964 it is the balloon data that is only 4 years
https://cosmicrays.oulu.fi/
The 11 year sunspot cycle is clearly evident..
And against there is no evidence of any link between cosmic rays and the long term temperature rise since 1964. If cosmic rays effect temperature then the effect would appear to be small compared to any other decadal driver.
1958
Moscow Neutron Monitor
On the other hand, the fact that temperatures go up, down, and stay constant for decades, while CO2 increases steadily, is proof that CO2 controls the temperature.
Percy Jackson I made no claims other than to point out that the Data is NOT a Joke as ATheoK says but that the data goes back to 1964.
Percy Jackson February 21, 2019 at 8:03 pm
Hi Percy. I live west of Kingman, AZ the pass is blocked. CAN’T GET THERE FROM HERE. Mainer twang.
ITS SNOWING! Fricking desert.
going to make snow balls
michael
And in New Zealand it is the hottest summer on record. Both are weather not climate.
Climate defines weather
michael
If weather repeats itself enough, it becomes climate.
SR
“ITS SNOWING! Fricking desert.”
Snow is not a measure of (purely) cold.
It is also a measure of WV content.
Deserts can get to freezing overnight routinely.
Snow in unusual places happens, it is the movement of energy aound the climate system, and called weather.
Meanwhile the Arctic is having a less cold winter, and that has been the case since 2005.
Now that is the sign of a global effect.
http://ocean.dmi.dk/arctic/meant80n.uk.php
Some areas of the Arctic have been less cold, some of the time. Have a look at current sea ice extent,the periods of -12c instaed of -50c and below don’t seem to be inhibiting ice growth.
Wrong.
HadCRUT4 since March 2015…
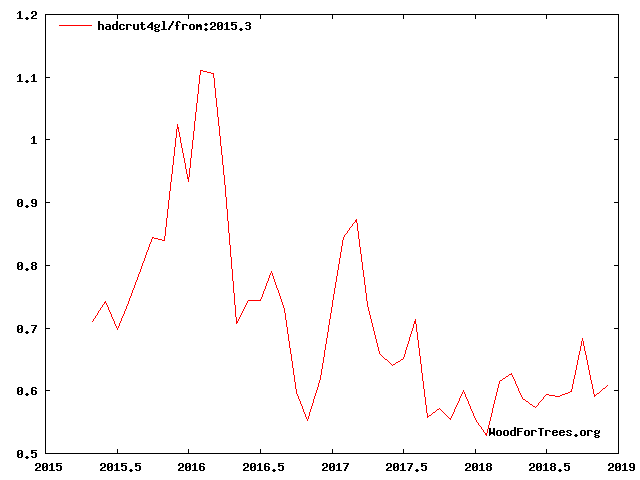
We need to post that “HadCRUT4 since March 2015” chart every time we get a new study that says “due to current warming” or “if the current warming continues” we can post this chart and show that the facts are just the opposite of their claims.
Every study we see assumes the temperatures are steadily climbing. They are not. Those studies are working on false assumptions. It may be a long time before temperatures again reach the heights they reached in 2016. It was about 18 years between the El Nino high of 1998 and the El Nino high of 2016 (0.1C difference in temperature between the two years).
And 2016 is still cooler than 1934.
Here’s the UAH satellite chart:
http://www.drroyspencer.com/wp-content/uploads/UAH_LT_1979_thru_January_2019_v6.jpg
It’s cooling, Jim! (Star Trek lingo)
David Middleton, I agree.
Your graph of HadCRUT4 is similar to what UAH satellite data is showing for the global lower troposphere: generally declining temperatures from beginning of 2016 through end 2018, with a statistically significant drop of almost 0.3 C (see: https://notalotofpeopleknowthat.wordpress.com/2019/01/03/uah-global-temperature-update-for-dec-2018/ )
H. Svensmark, M. B. Enghoff, N. J. Shaviv and J. Svensmark published online a nice paper in 2017, titled “Increased ionization supports growth of aerosols into cloud condensation nuclei” (free download at https://www.ncbi.nlm.nih.gov/pmc/articles/PMC5736571/ ) that summarizes the theory and supporting evidence that an increased flux of cosmic rays creates increased concentration of ions in Earth’s atmosphere that in turn increases the concentration of cloud condensation nuclei that in turn leads to increases in water vapor clouds that reflect and absorb solar radiation before it reaches Earth’s land and sea surfaces.
Some of the commenters above appear to have misinterpreted this postulated chain of events.
Measured global land and ocean temperatures, either individually or combined, are affected by many other variables and have too much inertia (i.e., phase lag) to be useful parameters over the short term (5-10 years) to either verify or refute Svensmark’s theory.
The key physical parameters to be monitored to verify Svensmark’s theory are: (a) the increase (if any) of Earth’s yearly average albedo over the last 6-7 years, (b) the satellite-measured increase (if any) of Earth’s yearly average percent of cloud cover over the last 6-7 years, combined of course with (c) the balloon and ground measurements of Earth-intercepted cosmic ray fluxes as indicated in your second graph above.
Bang goes the CAGW theory then with the length of The Pause. You heard it first here folks.
It’s been cooling for the last 2 years.
Three years. Ever since the February 2016 peak of the super El Nino.
The Laschamp excursion is clear evidence that Svensmark theory is incorrect. The amount of cosmic rays at that time was many times higher than at any other time in the past 200,000 years. You would not be able to identify the Laschamp excursion in any climate proxy.
Cosmic rays don’t have an outstanding role on climate change.
Not so clear at all.
The Laschamp excursion was a reversal in Earth’s geomagnetic field, whereas Svensmark’s theory deals with how variations of the SOLAR magnetic field (via resulting solar wind intensity in the vicinity of Earth) affect the flux of cosmic rays entering Earth’s atmosphere under otherwise constant geomagnetic field strength. Changes in Earth’s geomagnetic field do NOT affect the solar magnetic field.
The Laschamp excursion occurred 41,400 (±2,000) years ago, during the last glacial period, and spanned approximately 440 years.
Most significantly, with the Earth being in a stadial (glacial) condition during this entire period, there would be much less water vapor and cloud condensation nuclei in Earth’s atmosphere, so Svensmark’s postulated mechanism would be expected to be much less prominent globally , perhaps even totally absent, under such conditions.
So what. Cosmic Rays do not distinguish if they are deflected by the solar magnetic field or the geomagnetic field. In fact changes in the geomagnetic field account for most of the changes in cosmogenic isotope production, since they are several times larger than solar magnetic changes.
Precisely. With less clouds the effect from cosmic rays should be percentually higher. The case is that the Laschamp event was a massive increase in cosmic rays without climate change. End of the story. Svensmark hypothesis lacks support from evidence and evidence that should be there isn’t.
“End of story.”
That sounds awfully similar to “the science is settled.”
BTW, the appearance of the Schwabe solar cycle frequency in a Fourier analysis of the Earth’s atmospheric temperature over hundreds of years is credible evidence that Svensmark’s theory might just be correct . . . and is at least as credible as is a 0.1% variation in TSI from sunspots being the cause of this cyclic component.
Javier, you posted “You would not be able to identify the Laschamp excursion in any climate proxy.”
Well, from an abstract of the full article available at https://academic.oup.com/gji/article/195/3/1519/622540:
“We present here high-resolution palaeomagnetic records of the Laschamp excursion obtained from two Ocean Drilling Program (ODP) Sites, 1061 and 1062 on the Blake-Bahama Outer Ridge (ODP Leg 172). High sedimentation rates (∼30–40 cm kyr−1) at these locations allow determination of transitional field behaviour during the excursion. Palaeomagnetic measurements of discrete samples from four cores reveal a single excursional feature, across an interval of 30 cm, associated with a broader palaeointensity low. We determine the age and duration of the Laschamp excursion using a stratigraphy linked to the δ18O record from the Greenland ice cores.”
Is there somebody out there telling me, where to download global cloudcover data ?
Or / and global sunshine hrs. ?
Thx in advance !!
you can get global cloud data from the ISCCP page:
https://isccp.giss.nasa.gov/products/onlineData.html
Thanks for he hint, but I found only NC files that none of my progs can work with.
I’m limited as layman to txt ans csv files oly
Have you heard of seeding clouds to increase precipitation? This process does affect climate and weather. There may be a factor for the study of greenhouse gasses or cosmic rays and their effect on the climate and weather conditions.
The highest ionization by GCR takes place at heights from 10 to 20 km.

http://sol.spacenvironment.net/~nairas/Dose_Rates.html
GCR radiation is concentrated in the lower stratosphere, in areas where the Earth’s magnetic field is weakening.
In areas where the Earth’s magnetic field is weaker, in the periods of low solar activity, there is an increase in ozone.
http://sol.spacenvironment.net/raps_ops/current_files/Cutoff.html
Being poorly known, the ion chemistry of the lower stratosphere is generally ignored, or treated as similar to that of the middle atmosphere, by the current chemistry-climate modes. Some recent achievements in atmospheric chemistry have motivated us to re-asses the ionization efficiency of galactic cosmic rays (GCR) and ion-molecular reaction initiated by them. We reveal that near to the maximum of the GCR absorption, the energetically allowed ionmolecular reactions form an autocatalytic cycle for continuous O3 production in the lower stratosphere. The amount of the produced ozone is comparable to the values of the standard winter time O3 profile. This is an indication that GCR are responsible for a greater part of the lower stratospheric ozone variability then is assumed currently.
https://www.researchgate.net/publication/235944643_An_Autocatalytic_Cycle_for_Ozone_Production_in_the_Lower_Stratosphere_Initiated_by_Galactic_Cosmic_Rays
During periods of low solar activity, the ionization in the lower stratosphere over the polar circle increases as a result of the increase in galactic radiation. As a result, the temperature in the lower stratosphere increases over the polar circle. This results in the inhibition of circulation.
Nonlinear analyses of the total ozone galactic cosmic rays (GCRs) and Sunspot numbers for the last 85 years reveal that ozone response to the variation of solar irradiance and GCRs is far from our current understanding for a linear relation between the forcing factors and responding parameter. We show that ozone variations depend more significantly on the multi-decadal variability of GCRs and solar irradiance than to their short-term fluctuations related to the 11-year solar cycle, interannual, etc., variability. Multi-decadal variations of the forcing parameters act as a commutator switching between different regimes of O-3 response to the short-term variations in GCRs and sunspot numbers.
https://www.researchgate.net/publication/282771318_NONLINEAR_RE-ASSESSMENT_OF_THE_LONG-TERM_OZONE_VARIABILITY_DURING_20TH_CENTURY
“During periods of low solar activity, the ionization in the lower stratosphere over the polar circle increases as a result of the increase in galactic radiation. As a result, the temperature in the lower stratosphere increases over the polar circle. This results in the inhibition of circulation.”
How much of the polar warming does this effect account for?
See from November 2018.


Geomagnetic field.
http://www.geomag.nrcan.gc.ca/images/field/fnor.gif
Compare the polar vortex pattern that was created in November 2018. You can see the connection with the geomagnetic field in the north.

The NAIRAS model predicts atmospheric radiation exposure from galactic cosmic rays (GCR) and solar energetic particle (SEP) events. GCR particles propagation from local interstellar space to Earth is modeled using an extensionhe Badhwar and O’Neill model, where the solar modulation has been parameterized using high-latitude real-time neutron monitor measurements at Oulu, Tomnicky, and Moscow. During radiation storms, the SEP spectrum is derived using ion flux measurements taken from the NOAA/GOES and NASA/ACE satellites. Transport of the cosmic ray particles – GCR and SEP – through the magnetosphere is estimated using the CISM-Dartmouth particle trajectory geomagnetic cutoff rigidity code,driven by real-time solar wind parameters and interplanetary magnetic field data measured by the NASA/ACE satellite. Cosmic ray transport through the neutral atmosphere is based on analytical solutions of coupled Boltzmann transport equations obtained from NASA Langley Research Center’s HZETRN transport code. Global distributions of atmospheric density are derived from the NCEP Global Forecasting System (GFS) meteorological data.
http://sol.spacenvironment.net/raps_ops/current_files/rtimg/cutoff.gif
The rigidity parameter is extremely useful in describing the motion of particles in the geomagnetic field. This is because particles injected into the field with the same rigidity will follow identical trajectories, whereas particles with the same momentum or energy, but different charges, will not.
For each point in the magnetosphere there will be a minimum rigidity (called the cut-off or threshold rigidity) required to reach that point. Particles with less rigidity than the cut-off will be deflected before they reach the point, whereas those with more than the cut-off will penetrate to it.
The most shielded location lies on the magnetic equator at the Earth’s surface. For a positive ion arriving here (ignoring the atmosphere) from the least favoured direction, East (a = 180°), the cut-off rigidity has a maximum value: 59,6 GV.
Thus, particles with rigidities greater than 60 GV are totally unimpeded by the geomagnetic field.
http://www.ph.surrey.ac.uk/satellites/main/tutorial2_1.html
Climate change is caused by long-term changes in the strength of the solar dynamo and the Earth’s magnetic field.
 ?width=800&height=600&carousel=1
https://www.esa.int/Our_Activities/Observing_the_Earth/Swarm/Swarm_reveals_Earth_s_changing_magnetism
Launched in November 2013, Swarm is providing unprecedented insights into the complex workings of Earth’s magnetic field, which safeguards us from the bombarding cosmic radiation and charged particles.
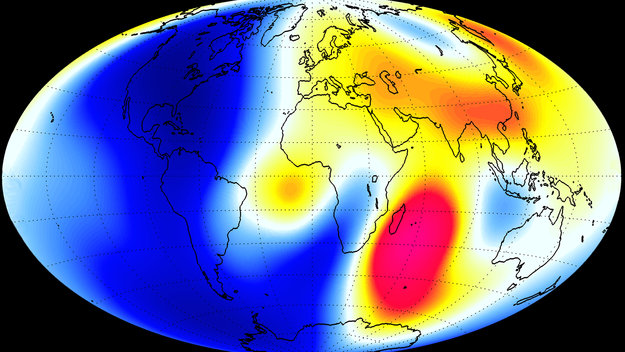
Measurements made over the past six months confirm the general trend of the field’s weakening, with the most dramatic declines over the Western Hemisphere.
The latest measurements also confirm the movement of magnetic North towards Siberia.
This will provide new insight into many natural processes, from those occurring deep inside our planet to space weather triggered by solar activity. In turn, this information will yield a better understanding of why the magnetic field is weakening.
Cosmic rays are going to increase. The earth magnetic field is slowly changing shape and strength as polarity seems to reverse as well. The North pole is currently moving from Canada to Siberia at a speed of 50 km per year. If both effects add up or even multiply, the alleged AGW is going to be a quantité négigeable.
I can’t wait to hear some scientists explaining that this is all the fault of glabull worming.
No. As soon as we get pass the solar minimum cosmic rays are going to decrease.
Low solar activity is characterized by a greater number of lows above the oceans and highs above the continents.
A big sounding meaningless phrase. This will be the sixth minimum of the space age, that is characterized by above average level of solar activity until SC24.
So far this solar minimum is deeper and longer than average, but far from extraordinary.
But occurring in an extraordinary time (as the Chinese say) with GND warriors about to turn off civilization. If the green blob was not on a death march, no-one would even bother to look sideways at the sun – we’d be on the way to building a station on the Moon.
Don’t forget it is also the year of the pig (as the Chinese say).
(may have posted this accidently elsewhere)
Short term variations of 1-2% are common, here is up to date the neutron count
http://cosrays.izmiran.ru/images/now.png
There is a basic physical principle which dictates that the count varies between odd and even sunspot minima, weather peak count is high and short or somewhat lower and longer lasting
http://hockeyschtick.blogspot.com/2013/04/paper-finds-another-amplification.html
the last link should be
http://2.bp.blogspot.com/-9Yjir_xvgO0/UWWqV7ofm3I/AAAAAAAAFGY/Qxn9IxfngF8/s1600/ScreenShot3386.jpg
After the solar wind activity increased, the galactic radiation decreased slightly, now it is growing again.
 ?fbclid=IwAR3iIIzTQAjP8um1zqqihiWoMHgnuogkS60RD37NV4OgpDZgNOqlzgdlqEI
http://sol.spacenvironment.net/nairas/Dose_Rates.html
It is necessary to pay attention to the air circulation over the oceans during the minimum solar cycle and why El Niño can not develop.

http://tropic.ssec.wisc.edu/real-time/mtpw2/product.php?color_type=tpw_nrl_colors&prod=global2×pan=24hrs&anim=html5
In the years when El Niño does not work, extent of ice in the Arctic is growing.
http://masie_web.apps.nsidc.org/pub/DATASETS/NOAA/G02186/plots/4km/r00_Northern_Hemisphere_ts_4km.png
One can not fail to notice during the very low solar activity of ozone growth over the polar circle in the lower stratosphere (depending on the geomagnetic field).

So what causes the 11 year cycle. Is it the ” Jupiter effect”? The planets lining up and affecting the Sun ?
MJE
The s.c. 11 year cycle is an optical ‘illusion’ created by observing effects of 22 year magnetic cycle manifesting itself in less bright areas commonly known as ‘sunspots’, but they are far from being spots, with the areas measured in millions of square miles.
Magnetic events are characterised by polarity, consequently when the instruments (using the Zeeman effect) were developed to observe real physical effects, it was conclusively proved that the these darker areas are result of enhanced localised magnetic activity.
What a 22 year solar magnetic cycle looks like you can see
here
(looking along the x axis red + blue)
If you look carefully at the image, the event that is referred to as the sunspot cycle ( they axis red + blue) in reality has a duration of approximately 16 to 17 years.
Our regular solar expert Dr. L. Svalgaard has on occasions reminded the blog readers of that fact.
Looking at the our local magnetic field, data have shown that earth’s magnetic field also has two strong components of just above 16 and aprox 22 years.
Carl Smith hypothesized in 2007 that the positioning of the gas planets alters the angular momentum of the sun, which results in major solar events leading to grand maxima and minima on earth. This is well outside my area of expertise, so I would be interested in your thoughts regarding this.
Landscheidt wrote about even in 199X very in detail.
my hypothesis ‘gas giants orbital resonance’ was published on 7 Jan 2004
http://cds.cern.ch/record/704882/files/0401107.pdf
it forecast SC24 max at SSN=79, SC24 SIDC official 78.9
http://www.vukcevic.co.uk/SSN.htm
at the time it was ridiculed by the NASA’s top man.
Thank you for your reply sir. As i said, not my area of study. So, my apologies for not being knowledgable of your work.
You may have a look to Landscheidts publication from 1988 as reprint, published here
Or take that: PUBLISHED BY SWETS & ZEITLINGER B.V. – LISSE
J. interdiscipl. Cycle Res., 1981, vol. 12, number 1, pp. 3-19.
Swinging Sun, 79-Year Cycle, and Climatic Change
Why is the increase in GCR so important in atmospheric chemistry? Because the secondary radiation is always present in the upper troposphere and lower stratosphere. Solar radiation reaches these layers only during strong explosions on the Sun.
The ground level dose rate is on average about 0.10 μSv/h, but at the maximum flight altitude (8.8 km or 29,000 ft) it can reach about 2.0 μSv/h (or even higher values). A dose rate of 4 μSv/h may be used to represent the average dose rate for all long haul flights (due to higher altitudes). It must be added, for supersonic planes like the Concorde, that could make a transatlantic flight in 3.5 hours, the exposure rate (about 9 μSv/h) at their altitude of 18 km was increased enough to result in the same cosmic ray exposure per crossing as for conventional jets trundling along at about 8 km.
https://www.nuclear-power.net/nuclear-engineering/radiation-protection/sources-of-radiation/cosmic-radiation-cosmic-rays/
Currently, the dose of ionizing radiation at the height of 15 km is over 22 microSv / h.
http://sol.spacenvironment.net/raps_ops/current_files/rtimg/dose.15km.png
Updated (2/2019) butterfly diagrams:
http://solarcyclescience.com/bin/bfly.jpg
http://solarcyclescience.com/bin/magbfly.png
Still no sign of the next cycle (25).
Svensmark, March 2018 update on aerosol formation. Also how he actually tested the hypothesis with a natural event :
https://www.youtube.com/watch?v=pLjHoR-yffo
With Shaviv’s work on longer cycles, these guys have pried open the climate door – it is not a closed system!
Dr. Nir Shaviv, invited to the German Bundestag , Dec 2018, to discuss climate :
http://www.sciencebits.com/bundestag (English report)
The ad hominem from Dr. Levermann is par for the course, primitive.
February is looking like it is going to have a very low sunspot number. So far only the 13th had a few sunspots and the current monthly average is below 1.
http://www.sidc.be/silso/DATA/EISN/EISNcurrent.png
Will this be the cycle minimum?
The CM prediction method
http://www.sidc.be/silso/predikfcm
And the ML prediction method
http://www.sidc.be/silso/predikfml
Appear to think it is possible.
The CM method “(from K. Denkmayr and P. Cugnon) combining a regression technique applied to the sunspot number series with the aa geomagnetic index used as a precursor (improved predictions during the minimum phase between solar cycles)” appears to be better for solar minima.
Thank you for your reply sir. As i said, not my area of study. So, my apologies for not being knowledgable of your work.
Before anyone gets too excited about the current levels of cosmic ray activity look at the 2010 maximum for Oulu as reported by the third graphic on this web page, with attention to the 2009 levels:
http://cosmicrays.oulu.fi/
The good news is that in this cycle we are ahead of the 2010 maximum but there are still two years to go in this 11 year cycle, so sit back, and enjoy the show. If you are looking for some real excitement, try watching grass grow.
Sorry, Javier, but you missed the key point: one cannot produce clouds if there is insufficient water vapor in the atmosphere to do so, and the amount of GCRs penetrating the atmosphere simply does not overcome this fact.
If you cannot positively state clouds were being formed as easily during the Laschamp excursion at stadial atmospheric temperatures as they are today at interstadial atmospheric temperatures, your conclusion is unfounded and is definitely not “the end of the story.”
I acknowledge that ice cores reveal the history of atmospheric micro-particulates and certain aerosols to a limited degree, but this is not indicative of percent of Earth’s cloud coverage.
Please provide a scientific proxy that demonstrates the precise extent of cloud formation during the 400 or so years of the Laschamp event and how it charged from 400 periods both before and after this event.
Sorry, 400 year periods both before and after this event.
The role of the global electric circuit in solar and internal forcing
of clouds and climate
Brian A. Tinsley a,*, G.B. Burns b
, Limin Zhou a,c
a University of Texas at Dallas, WT15, Box 830688, Richardson, TX 75083-0688, USA b Australian Antarctic Division, Kingston 7050, Australia c State Key Laboratory of Environmental Geochemistry, Institute of Geochemistry, Chinese Academy of Sciences, Guiyang, China
Received 16 October 2006; received in revised form 1 January 2007; accepted 10 January 2007
Abstract
Reports of a variety of short-term meteorological responses to changes in the global electric circuit associated with a set of disparate
inputs are analyzed. The meteorological responses consist of changes in cloud cover, atmospheric temperature, pressure, or dynamics. All
of these are found to be responding to changes in a key linking agent, that of the downward current density, Jz, that flows from the
ionosphere through the troposphere to the surface (ocean and land). As it flows through layer clouds, Jz generates space charge in conductivity gradients at the upper and lower boundaries, and this electrical charge is capable of affecting the microphysical interactions
between droplets and both ice-forming nuclei and condensation nuclei.
Four short-term inputs to the global circuit are due to solar activity and consist of (1) Forbush decreases of the galactic cosmic ray
flux; (2) solar energetic particle events; (3) relativistic electron precipitation changes; and (4) polar cap ionospheric convection potential
changes. One input that is internal to the global circuit consists of (5) global ionospheric potential changes due to changes in the current
output of the highly electrified clouds (mainly deep convective clouds at low latitudes) that act as generators for the circuit.
The observed short-term meteorological responses to these five inputs are of small amplitude but high statistical significance for
repeated Jz changes of order 5% for low latitudes increasing to 25–30% at high latitudes. On the timescales of multidecadal solar minima,
such as the Maunder minimum, changes in tropospheric dynamics and climate related to Jz are also larger at high latitudes, and correlate
with the lower energy component (1 GeV) of the cosmic ray flux increasing by as much as a factor of two relative to present values.
Also, there are comparable cosmic ray flux changes and climate responses on millennial timescales. The persistence of the longer-term Jz
changes for many decades to many centuries would produce an integrated effect on climate that could dominate over short-term weather
and climate variations, and explain the observed correlations.
Thus, we propose that mechanisms responding to Jz are a candidate for explanations of sun–weather–climate correlations on multidecadal to millenial timescales, as well as on the day-to-day timescales analyzed here.
2007 COSPAR. Published by Elsevier Ltd. All rights reserved.
https://gacc.nifc.gov/sacc/predictive/SOLAR_WEATHER-CLIMATE_STUDIES/GEC-Solar%20Effects%20on%20Global%20Electric%20Circuit%20on%20clouds%20and%20climate%20Tinsley%202007.pdf
There is so much we have yet to learn.
I thought this was interesting .
The effects of cosmic rays on astronauts: the Light Flash phenomenon
https://alteaspace.wordpress.com/2011/11/01/the-effects-of-cosmic-rays-on-astronauts-the-light-flash-phenomenon/
More Cosmic Rays?
We’re doomed.