From Dr. Judith Curry’s Climate Etc.
Posted on February 17, 2019 by curryja |
by Judith Curry
I am preparing a new Special Report on Hurricanes and Climate Change.
This Report is easier than my Special Report on Sea Level and Climate Change. Sea level and glaciers are very fast moving topics, whereas for hurricanes, the big picture conclusions haven’t really changed in a decade.
The Table of Contents for the Report: [ HR outline ]
The topic of tropical cyclones and climate change is regularly assessed by the IPCC and US National Assessment Reports, as well as by other expert reports under the auspices of the WMO, CLIVAR and other organizations. With regards to the question: ‘Why another assessment report on Hurricanes and Climate Change?’ here is my response:
CFAN’s Special Report on Hurricanes and Climate Change is distinguished from recent assessments by the following:
- a focus on hurricane aspects that contribute to landfall impacts
- an emphasis on geologic evidence and interpretation of natural variability
- an approach to ‘detection and attribution’ that does not rely on global climate models
- a perspective on future projections that accounts for uncertainties in climate models and also includes natural climate variability
- a longer format that allows for more in depth explanation suitable for a non-expert audience.
Basically, this Report is motivated by the needs of my clients in the energy and insurance sectors. After grappling with this issue for the past 15 years, both from the perspective of a research scientist and the owner of a weather/climate services company (Climate Forecast Applications Network), I have a perspective that is somewhat different from other academic or government scientists addressing the problem of hurricanes and climate change.
I plan to make the full report available in May, I look forward to your feedback and suggestions.
In this post, I’ll start with Chapter 3 on the observational datasets of hurricane variability and trends. An additional 4 posts on this topic will provided in the coming weeks.
Historical variability and trends
Documenting the variability and trends of hurricane activity requires long and accurate data records. Historical information on hurricane activity is obtained from the following sources:
- satellite observations (since ~1966)
- aircraft instrumental observations (since 1944)
- surface-based instrumental observations – landfalls, ships (since the 1800’s)
- historical reports
Over the years, the way that hurricanes have been observed has changed radically. As a result, many hurricanes are now recorded that would have been missed in the past. Furthermore, satellites are now able to continually assess wind speeds, thus recording peak wind speeds that may have been missed in pre-satellite days. Unfortunately, temporally inconsistent and potentially unreliable global historical data hinder detection of trends in tropical cyclone activity.
This Chapter assesses the variability of global and regional hurricanes over the entire available database. An assessment is provided as to whether we can detect any global or regional trends in hurricane activity from the available data.
3.1 Global
Reliable global hurricane data from satellite has been available since 1970, although inference of hurricane intensity is not judged to be reliable prior to 1980 (and in some regions, prior to 1988). Hurricane intensity is estimated from visible and infrared satellite observations through cloud patterns and infrared cloud top temperatures.
Figure 3.1 shows the time series since 1981 of total global hurricanes and major hurricanes. On average, each year there are about 47 hurricanes with about 20 reaching major hurricane status. Substantial year-to-year variability is seen, with a slight decreasing trend in the number of hurricanes and a slight increasing trend in the number of major hurricanes.
Figure 3.2 shows the time series since 1971 of the global Accumulated Cyclone Energy (ACE) (see Chapter 2 for a definition of ACE). As an integral of global hurricane frequency, duration and intensity, ACE shows greater decadal variation than does the number of hurricanes in Figure 3.1. No trend in ACE is seen, and the recent period of 2009 to 20015 was characterized by particularly low values of ACE.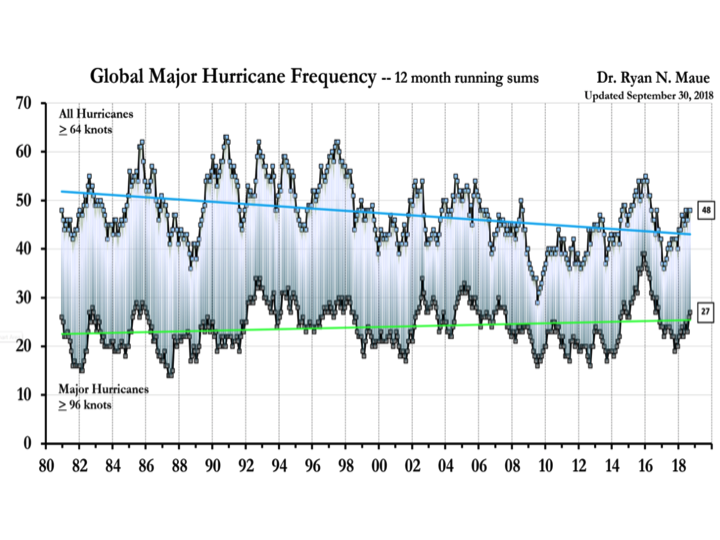
Figure 3.1: Global Hurricane Frequency (all & major) since 1981 – 12-month running means. The top time series is the number of global tropical cyclones that reached at least hurricane-force (maximum lifetime wind speed exceeds 64-knots). The bottom time series is the number of global tropical cyclones that reached major hurricane strength. Source: Maue (2018).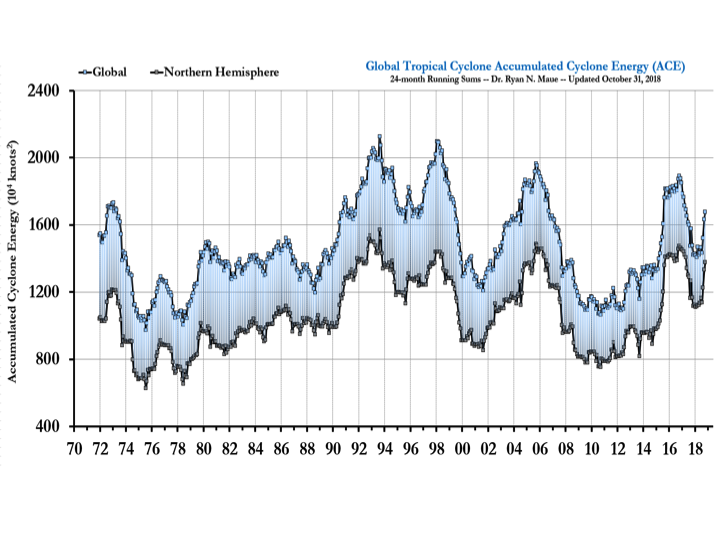 Figure 3.2: Global and Northern Hemisphere Accumulated Cyclone Energy: 24 month running means. Note that the year indicated represents the value of ACE through the previous 24-months for the Northern Hemisphere (bottom line/gray boxes) and the entire global (top line/blue boxes). The area in between represents the Southern Hemisphere total ACE.
Source: Maue (2018)
Figure 3.2: Global and Northern Hemisphere Accumulated Cyclone Energy: 24 month running means. Note that the year indicated represents the value of ACE through the previous 24-months for the Northern Hemisphere (bottom line/gray boxes) and the entire global (top line/blue boxes). The area in between represents the Southern Hemisphere total ACE.
Source: Maue (2018)
3.1.1 Intensity
Figure 3.1 indicates that the number of major hurricanes is increasing globally, whereas the total number of hurricanes is decreasing. An increase in hurricane intensity has long been hypothesized to occur as global sea surface temperatures increase.
Emanuel (2005) identified a trend since 1950 of increasing maximum hurricane Power Dissipation Index (PDI), focusing on hurricanes in the North Atlantic and North Pacific. Shortly thereafter, Webster et al. (2005) showed that while the total number of hurricanes has not increased globally since 1970, the proportion (%) of Category 4 and 5 hurricanes had doubled, implying that the distribution of hurricane intensity has shifted towards more intense hurricanes.
Klotzbach and Landsea (2015) updated the Webster et al. (2005) analysis (Figure 3.3), with an additional 10 years of data and the availability of the International Best Tracks (IBTrACS) dataset, which reflects a cleaning up and homogenization of the data relative to what was used by Webster et al. Interpretation of any increase in the % of Cat 4/5 hurricanes depends on interpretation of the data quality, which Klotzbach and Landsea argue is an issue prior to 1988. Klotzbach and Landsea make a convincing argument that data prior to 1980 should not be used in trend analyses. The debate on the increase in % CAT4/5 hurricanes hinges on whether the data from 1985-1989 is of useful accuracy, since the large jump occurs between 1985-1989 and 1990-1995. The primary problem with the data between 1985 and 1987 is missed tropical cyclones in the North Indian Ocean, and a classification change in Northeast Pacific (both regions contribute a relatively small number to the total global tropical cyclone count).
To address concerns about the validity of intensity data from the earlier periods, Kossin et al. (2013) developed a new homogeneous satellite-derived dataset of hurricane intensity for the period 1982-2009. The lifetime maximum intensity (LMI) achieved by each reported storm is calculated and the frequency distribution of LMI is tested for changes over this period. Kossin et al. found that globally, the stronger tropical cyclones have become more intense at a rate of about +1 m/s per decade during the period (Figure 3.4), but the statistical significance of this trend is marginal. Significant increases in the strongest hurricanes have occurred in the North Atlantic and decreases in the Western North Pacific.

Figure 3.3. (a) Pentad total of the number of hurricanes that achieved a maximum intensity of each category grouping as delineated by the Saffir–Simpson scale. (b) As in (a), but for the percentage of total hurricanes achieving each category grouping. Klotzbach and Landsea (2015)

Figure 3.4. Plots of quantiles (mean to 0.9) of the lifetime maximum intensity (LMI) of storms in the various tropical cyclone formation basins, from a homogenized satellite-based analysis of tropical cyclone intensity (1982–2009). Kossin et al. (2013).
3.1.2 Intensification
Apart from the issue of maximum lifetime intensity achieved by a hurricane, the rate of intensification of hurricanes is receiving increasing scrutiny.
A recent study showed the 95th percentile of 24-h intensity changes significantly increased in the central and eastern tropical Atlantic basin during the period 1986–2015 (Balaguru et al, 2018). The intensification rate increased significantly between 1977 and 2013 in the West Pacific (Mei et al, 2016). In both the Atlantic and West Pacific, the areas with the largest increase in sea surface temperatures (SSTs) were collocated with the largest positive changes in intensification rates.
Bhatia et al. (2019) conducted a comprehensive analysis of global rates (excluding the Indian Ocean) of hurricane intensification for the period 1982-2009 (Figure 3.5). Evaluation of the global data is hampered by intensity analysis uncertainties, although the intensity uncertainty is very low for the North Atlantic. In the two most reliable long-term observational records available for hurricane intensity changes, the proportion of the highest 24-hour hurricane intensification significantly increased in the Atlantic between 1982 and 2009. Globally, a significant increase in hurricane intensification rates is seen in IBTrACS data but not in ADT-HURSAT (satellite-derived).
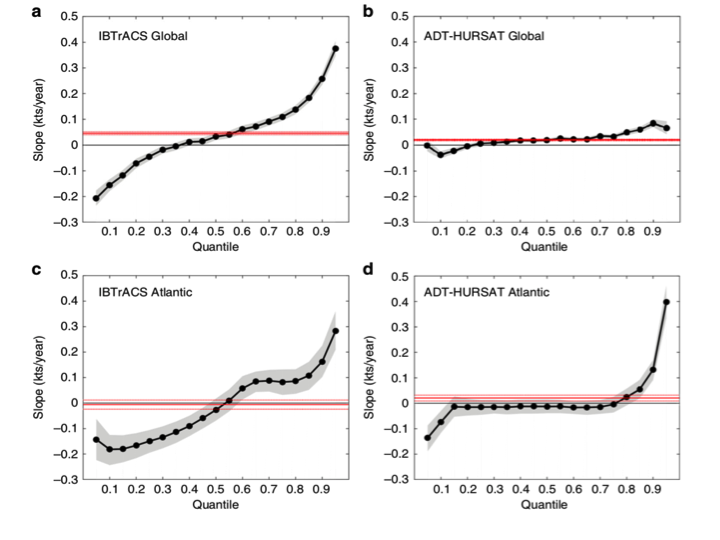
Figure 3.5 Quantile regression of 24-h intensity changes. Slope of the quantiles for 24-h intensity changes during the period 1982–2009. Slopes are shown for IBTrACS (a, c) and ADT-HURSAT (b, d) globally (a, b) and in the Atlantic basin (c, d). Source: Bhatia et al. (2019)
3.1.3 Tracks
Recent research has highlighted variation in the speed and location of hurricane tracks. These variations are significant in changing landfall locations and hurricane-induced rainfall.
Kossin (2018) showed that that tropical-cyclone translation speed (rate of forward motion) has decreased globally by 10 per cent over the period 1949-2016 (Figure 3.6). The global distribution of translation speed exhibits a clear shift towards slower speeds in the second half of the period.
This slowdown is found in both the Northern and Southern Hemispheres but is stronger and more significant in the Northern Hemisphere, where the annual number of tropical cyclones is generally greater. The times series for the Southern Hemisphere exhibits a change-point around 1980 (Figure 3.6), but the reason for this is not clear. An overall slowdown while over water was found in every basin except the northern Indian Ocean. The largest slowdown was found in the western North Pacific Ocean and the region around Australia. Figure 3.6 Global (a) and hemispheric (b) time series of annual-mean tropical-cyclone translation speed and their linear trends. Grey shading indicates 95 percent confidence bounds. Source: Kossin (2018).
In addition to the global slowing of hurricane translation speed, there is evidence that hurricanes have migrated poleward in several regions. Migration in the western North Pacific was found to be large, which has had a substantial effect on regional hurricane-related hazard exposure.
Kossin et al. (2014) identified a pronounced poleward migration in the average latitude where tropical cyclones have achieved their lifetime-maximum intensity (LMI) over the period 1982-2012. The poleward trends are evident in both the Northern and Southern Hemispheres, with an average migration of tropical cyclone activity away from the tropics at a rate of about 1° latitude per decade. In the Northern Hemisphere, the western North Pacific shows the largest migration, with the North Atlantic showing essentially no trend.
Moon et al. (2015) suggested that the poleward migration is greatly influenced by regional changes in hurricane frequency associated with multi-decadal variability, particularly for the Northern Hemisphere (NH). Moon et al. found 92% of the poleward trend is a result of the frequency changes associated with multi-decadal variability.
Daloz et al. (2018) examined whether the poleward migration of hurricane lifetime-maximum intensity is associated with a poleward migration of hurricane genesis (formation). They found a shift toward greater average potential number of genesis at higher latitudes over most regions of the Pacific Ocean, which is consistent with a migration of tropical cyclone genesis towards higher latitudes. They also found significant poleward shifts in mean genesis position over the Pacific Ocean basins.
3.1.4 Rainfall
Walsh et al. (2015) concluded that for the globe, a detectable change in tropical cyclone-related rainfall has not been established by existing studies. However, satellite data is being increasingly used to assess tropical cyclone rainfall.
Kim and Ho (2018) examined the variation of hurricane rainfall area over the subtropical oceans using satellite radar precipitation data collected from 1998 to 2014. In the subtropics, higher translation speed and larger vertical wind shear significantly contribute to an increase in hurricane rainfall area by making horizontal rainfall distribution more asymmetric, while sea surface temperature rarely affects the fluctuation of hurricane rainfall area. They suggested that in the subtropics, unlike the tropics, atmospheric circulation conditions are likely more crucial to varying hurricane rainfall area than factors such as sea surface temperature.
3.3 North Atlantic
The North Atlantic has the best data quality of any of the regions. There is credible data on frequency and intensity since 1850, with the intensity data being most reliable since 1944, when aircraft reconnaissance flights began. Prior to the onset of satellite coverage in 1966, NOAA has adjusted total basin-wide counts upward based on historical records of ship track density. During years when fewer ships were making observations in a given region, hurricanes in that region were more likely to have been missed, or their intensity underestimated to be below hurricane strength, leading to a larger corresponding adjustment to the count for those years. These adjustment methods are cited in Knutson et al. (2010).
The impact of undercounting is illustrated in Figure 3.7, which compares the raw hurricane counts (green) with adjusted counts (orange) for the period 1878-2015. The sign of the long-term trend depends critically on the adjustment.

Figure 3.7. Time series for the period 1878-2015 of the total number North Atlantic hurricanes – unadjusted (green); adjusted (orange). The number of U.S. landfalling hurricanes is in red. Curves have been smoothed using a five-year average, plotted at the middle year. Source: https://www.epa.gov/climate-indicators/climate-change-indicators-tropical-cyclone-activity
Figure 3.8 shows the yearly values for the adjusted time series since 1850, for total North Atlantic hurricane counts and major hurricane counts. While the number of major hurricanes prior to 1944 is probably undercounted, it is noteworthy that the number of major hurricanes during the 1950’s and 1960’s was at least as large as the last two decades.
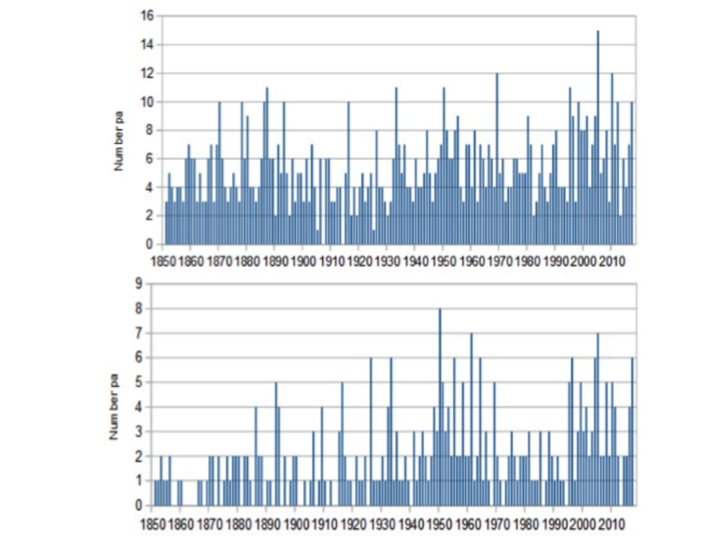
Figure 3.8 Adjusted numbers of total Atlantic hurricanes (top) and major hurricanes (bottom). Source: http://www.aoml.noaa.gov/hrd/hurdat/comparison_table.html
Accumulated Cyclone Energy (ACE) (Figure 3.9) and Power Dissipation Index (PDI) (Figure 3.10) provide integral measures of overall hurricane activity, with PDI providing greater weight to intensity. Values of ACE during the 1950’s and 1960’s are comparable to recent decades. Regarding PDI, the years 1926, 1934 and 1962 have PDI values as large as seen in 2004, 2005, 2017, although prior to 1944 intensity data is less reliable.

Figure 3.9 Accumulated Cyclone Energy Index for the Atlantic Ocean. Source: http://www.aoml.noaa.gov/hrd/hurdat/comparison_table.html. Ourworldindata.org
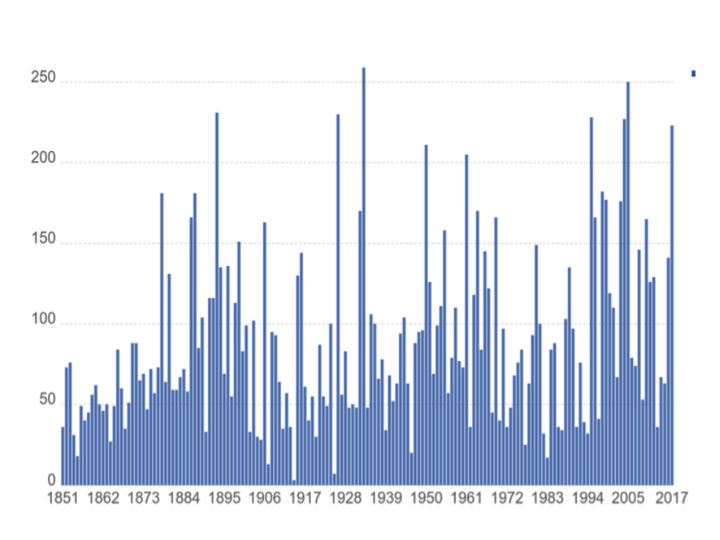
Figure 3.10 Power Dissipation Index (PDI) for the North Atlantic From 1920-2018. Source: Ryan Maue.
All measures of Atlantic hurricane activity show a significant increase since 1970. However, high values of hurricane activity (comparable to the past two decades) were also observed during the 1950’s and 1960’s, and by some measures also in the late 1920’s and 1930’s.
3.4 Paleotempestology
Hurricane data records for the past 40 years, or even the past 150 years, can present a misleading picture of range of variability of hurricane characteristics. Paleotempestology is the study of storm occurrence prior to the historical record. This provides a way of establishing a longer climate baseline than the relatively short observational record.
Many types of geological proxies have been tested for reconstructing past hurricane activity, including hurricane-induced deposits of sediments in coastal lakes and marshes, stalagmites in caves, tree rings and corals. Since these studies typically focus on a specific geographic location, a caveat is that they cannot distinguish between regional trends and systematic changes in hurricane tracks.
In the Australian region, Haig et al. (2014) used oxygen isotopic analysis of stalagmite records to show that the present low levels of storm activity on the mid west and northeast coasts of Australia are unprecedented over the past 1,500 years. Their results reveal a multicentennial cycle of tropical cyclone activity, the most recent of which commenced around AD 1700. The present cycle includes a sharp decrease in activity after 1960 in Western Australia.
Nyberg et al. (2007) constructed a record of the frequency of major Atlantic hurricanes over the past 270 years using proxy records in the Caribbean from corals and a marine sediment core. The record indicates that the average frequency of major hurricanes decreased gradually from the 1760s until the early 1990s, reaching anomalously low values during the 1970s and 1980s.
Wallace et al. (2015) review paleo-trends in hurricane activity from sedimentary archives in the Gulf of Mexico, Caribbean and western North Atlantic margins. A site from Mattapoisett Marsh, Massachusetts shows that the total hurricane deposits have remained relatively constant between 2200 and 1000 years B.P. (before present). However, the last 800 years B.P. appear to have been a time of relatively frequent total storm deposition. A site from Laguna Playa Grande, Puerto Rico has reconstructed intense hurricanes occurring over the past 5000 years B.P., with prominent increases in activity observed during 4400 – 3600, 2500 – 1000, and 250 – 0 years B.P. In the Gulf of Mexico, while the overall frequency of events remained relatively constant over the 4500 year record, the frequency of high threshold events has varied considerably – periods of frequent intense hurricane strikes occurred during 3950 – 3650, 3600 – 3500, 3350 – 3250, 2800 – 2300, 1250 – 1150, 925 -875, and 750 – 650 years B.P.
Brandon et al. (2013) found a period of increased intense hurricane frequency between ~1700 and ~600 years B.P. and decreased intense storm frequency from ~2500 to ~1700 and ~600 years B.P. to the present.
There has not been a timeline or synthesis of these results for the past five thousand years, either regionally or for the entire coastal region. However, it is clear from these analyses that significant variability of landfall probabilities occurs on century to millennial time scales. There appears to have been a broad ‘hyperactive period’ from 3400 to 1000 years B.P. High activity persisted in the Gulf of Mexico until 1400 AD, with a shift to more frequent severe hurricane strikes from the Bahamas to New England occurring between 1400 and 1675 AD. Since 1760, there was a gradual decline in activity until the 1990’s.
3.4 Conclusions
Analyses of both global and regional variability and trends of hurricane activity provide the basis for detecting changes and understanding their causes.
The relatively short historical record of hurricane activity, and the even shorter record from the satellite era, is not sufficient to assess whether recent hurricane activity is unusual for during the current interglacial period. Results from paleotempestology analyses in the North Atlantic at a limited number of locations indicate that the current heightened activity is not unusual, with a ‘hyperactive period’ apparently occurring from 3400 to 1000 years before present.
Global hurricane activity since 1970 shows no significant trends in overall frequency, although there is some evidence of increasing numbers of major hurricanes and of an increase in the percentage of Category 4 and 5 hurricanes.
In the North Atlantic, all measures of hurricane activity have increased since 1970, although comparably high levels of activities also occurred during the 1950’s and 1960’s.
Climate science proves that climate change is making hurricanes more destructive
https://tambonthongchai.com/2018/09/18/climate-change-hurricanes/
But no long term trends in global ACE
https://tambonthongchai.com/2018/11/28/trends-in-tropical-cyclone-activity/
Climate science proves that the climate science researchers (like Emanuel) will manipulate the data to find what they were looking for.
As for explaining the figure 3.3 jump in 90-94 major hurricanes, there was a political element with the IPCC FAR publication affecting scrutiny and need for attribution. IOW, Prior to 1990 there was no political expediency or urgency to “uprate” hurricanes. The human factor cannot be dismissed in this regard.
Once again climatology is obsessed with “trends”. Why is anyone trying assess the whole causal attribution with a linear trend since 1950 ? Because it give the right answer.
There is no simple, one variable, explanation for either ACE or max intensity. If you fit a straight line you are trying to avoid addressing the N. Atl. hurricane drought from 2005-2015 : the “hottest decade on record”.
here’s decline since 2005 :

Tropical cyclone near the coast of Australia.
https://www.ssd.noaa.gov/PS/TROP/floaters/15P/flash-wv-long.html
Thank you Dr. Curry for the insightful review of available data and paleo-reconstructions. As with all climate related issues, recent historical and prehistorical (paleotempestological) data quality is very different with uncertainties increasing significantly before the satellite era. Your review leads me to believe that the uncertainty of pre-satellite data can only be in a single direction.
Has anyone been able to estimate the uncertainty in pre-satellite and pre-radio data for tropical cyclone count and intensity?
Interestingly, the 15-year running average for the total number of North Atlantic hurricanes seems to roughly in phase with the 31/62 year Perigean New/Full moon tidal cycle that naturally breaks up into 31-year epochs starting in 1870, 1901, 1932, 1963, and 1994.
This is of interest since I believe that, westerly moving equatorial Rossby waves are generated by the passage of Kelvin-waves across the Equatorial Atlantic ocean, every time the Moon crosses the Earth’s equator or reaches a lunar standstill. These westerly moving Rossby waves are associated with pairs of tropical low-pressure cells that straddle the equator. These could act as the seeds for the development of hurricanes.
It is possible that the number and/or strength of these low-pressure cells could be influenced by the proximity of the Moon to the Earth when it crosses the Earth’s equator or reaches a lunar standstill. Hence the connection to the 31/62-year Perigean New/Full moon cycle.
Here is the plot of the Accumulated Cyclone Energy Index for the Atlantic Ocean that allows an extension of the comparison between the Perigean New/Full moon tidal cycle and hurricane strength back to 1850.
Unfortunately, I think I have lost all respect for Dr. Curry.
you know…when you look at absolute numbers….there were so few hurricanes, if they missed 1 or 2….it would throw the bell curve the other way
…and missing 1 or 2 would have been very common before 1970…..combined with counting every hiccup since then
It’s all mostly a crock
Agree, plus this;
“Global hurricane activity since 1970 shows no significant trends in overall frequency, although there is some evidence of increasing numbers of major hurricanes and of an increase in the percentage of Category 4 and 5 hurricanes.”
… is likely the subjective artifact of a lack of prior observational capacity. Frankly, it looks like no change. The more curious indication is the reduction in cyclonic storms around Australia, which has been recognized for a long time now by people in northern Australia, those who lived through the prior cyclic-peak of activity, and actually know the difference between a post-modern BOM tropical ‘cyclone’, and an actual tropical cyclone.
There is an apparent pronounced multi-decadal cyclicity to historical occurrences in this region, and we’re sure to encounter another severe period of activity. Which will undoubtedly be accompanied by ignorant claims from snowflake-wretches of impending planetary climate doom.
The other aspect that is not being recognized is that the many tropical-storm level events around Australia are now being routinely preemptively classified as Cat-1 and Cat-2 ‘tropical cyclones’, when they’re clearly nothing of the kind.
In fact BOM already calls cat-1s as cat-3s, and cat-2s as cat-4s.
This ridiculous BOM behavior never used to occur, it’s a ‘post-modern’ BOM fad, that began to occur even as the numbers of actual tropical cyclones steadily decreased. In other words, the real occurrence of tropical cyclones in our region is actually considerably lower than the exaggerated BOM cyclone ‘statistics’.
Thus, when a period of genuine enhanced cyclonic activity re-appears, BOM has already stacked the statistical deck to ensure that appears to be “totally unprecedented’ activity. But of course, it will just be the upside of the cyclone activity cycle with various corrupt individuals appear to be doing all they can within BOM to misrepresent.
Just as they’ve also done with the corrupt ACORN fantasy pseudo-data ‘temperature record’.
Now every aspect of background WX cyclicity is routinely being misrepresented as ‘climate change’.
i.e. “It’s all mostly a crock”.
Weather and climate are not the ‘problem’, CORRUPT GOVT WEATHER AGENCIES are the only problem here.
It’s probably true … as far as it goes.
If you want a simple unambiguous story go to Dr. Mann. I think the take away is that the current climate is not in any way unnatural.
Having spent 38 years keeping track of hurricanes which could impact my extended family I would have to agree.
given that tropical cyclones move an enormous amount of solar energy from the water surface to the upper atmosphere, does this heat transfer have a measurable effect on the amount of heat conveyed to the polar regions eg via the Gulf Stream – or another way of looking at this, in a period when there are above average numbers of tropical cyclones removing the solar energy from the water in the lower latitudes, and leaving less energy to be carried by water to the polar regions, is this diminution of energy measurable and or is it significant ?
“able to continually assess wind speeds, thus recording peak wind speeds”
Is the sample frequency high enough to catch the peak wind speeds accurately?
Interestingly, when you look below the peaks in the body of the data in Figs. 3.8 and 3.9, you see the roughly 20-40 year (estimated) pattern of hurricane activity in the Atlantic. But, doesn’t seem to be as strong in frequency data. I know Pensacola saw a number of direct and near landfalls in the 1995-2006 time period and the northern Gulf Coast seems to be in a continued active pattern through last year.
Actually, hurricanes are “more destructive” because population density and structural development on land impacted by hurricanes is so much higher than it was 100 years ago. In many instances it is higher in just the last 40 years. A good place to start, https://www.iii.org/fact-statistic/facts-statistics-hurricanes Most of the data is US specific and major insurance companies have all done their own work on the subject. I know from personal experience that many areas along US Gulf Coast have been developed which should not have been. The population density in the region from Bay St Louis to Panama City has been phenomenal just in my lifetime. I remember making road trips from Mississippi to Panama City Beach and to the Tampa-Lakeland area in the 1970s. Drive for long stretches and see nothing but widely scattered houses and very small towns. Now it is housing and condo developments, strip malls and stand alone businesses with short stretches of farm land/forest. Seeing it from offshore is even more striking, lights don’t lie. Much of this region gets slammed by storm surge, let alone wind and tornadoes associated with hurricanes.
As to the issue of whether or not hurricanes are getting worse, I remember Camille, the absolute gold standard for hurricane destruction. Every storm is different, the combination of factors which contribute to how destructive a given storm is perceived are pretty damned hard take into account for every single storm.
Oh, poop! Meant this to be a reply to Chaamjamal’s comment, and my first one seems to have went whoosh. Damned iffy internet connection.
No problem Hotel, happens all the time and sometimes hard to tell which post you are replying to.
Good points about the Gulf Coast residential developments, and I will make an outright assertion that from Galveston to Panama City we have seen more storms than the entire east coast, and we have seen more “major” storms and we have seen the two highest storm surges that history records.
The problem we have seen in my country has been the “branding” of your zipcode to determine your insurance premiums. In the Florida Panhandle counties we have coastlines that are 50 or more feet above sea level within a hundred yards of the high tide line. Eglin AFB runway is over 80 feet, and the end of the runway is about a half a mile from the bay.
We high ground folks can fight that battle later( I am over 60 feet and one half mile from thewater) , but the point you made about insurance company payouts is right on. Growing up in New Orleans and with relatives on the Miss coast, and living here for 35 years , I saw/endured several bad storms, including Micheal, Ivan, Dennis, Opal, Erin to name a few that made landfall within 50 miles.
Too many places on poor sites and then poor building codes/building practices. So there’s no mystery why the damage $$$ are very high. And BTW, Camille was severe, but the storm surge of Katrina put it to shame. All should look at the NOAA and other sites to see the storm surge mechanics WRT to sea floor contour and the shape of the coast line and the size of the storm. Katrina was the perfect storm for about 20 miles or more of the coast, and my wife and I drove 13 miles of it about 5 months after the disaster. It was like post-apocalyptic a sci-fi movie except that it was for real. Wunderground has a super set of articles about the surge there that all should see.
Hopefully, more folks will look at the actual storm numbers and intensities in light of the losses we folks living in harm’s way have endured.
Gums sends…
We have some high winds with all this globall warmining piling up outside, connection has been a bit choppy. Wondering if we are going to lose electric. Joys of rural living! 😉
Years ago I plotted the data from this 2005 NOAA report.
There was a decline in Category 4 and Category 5 hurricane intensity from ~1930 to 2005.
I have found Chris Landsea’s work to be credible.
Regards, Allan
http://www.nhc.noaa.gov/pdf/NWS-TPC-4.pdf
NOAA Technical Memorandum NWS TPC-4
THE DEADLIEST, COSTLIEST, AND MOST INTENSE UNITED
STATES TROPICAL CYCLONES FROM 1851 TO 2004 (AND
OTHER FREQUENTLY REQUESTED HURRICANE FACTS)
Updated August 2005
Eric S. Blake, TPC Miami
Edward N. Rappaport, TPC Miami
Jerry D. Jarrell, TPC Miami (retired)
Christopher W. Landsea, HRD Miami
Tropical Prediction Center
National Hurricane Center
Miami, Florida
Correction:
There was a decline in Category 4 and Category 5 hurricane intensity from ~1930 to 2004.
In January 2012 I proposed forecasting method for the ACE and discussed it with Dr. Curry who shown more than superficial interest
(hi vuk, thanks for sending this, looks interesting. I use AMO for my decadal projections of atlantic hurricanes. I also use PDO because of ENSO effect, …….. the key is how you make the future projection?)
so we left it for the time to be the ‘judge and jury’.
I have updated the ACE in 2015, but now we have two more years of data which I need to update. The original graph which you can find
here
Dr. Curry’s graph is added, so anyone can judge if my forecasting method produced goods.
If you think it has failed fine, but if you think it worked at least for time being, let me know and I will discuss physical process that might be involved.
2010 was the local high point you have a peak predicted which does not occur. However you get 2015 low point right and recent uptick, though you are generally in a long term low in 2017 which was almost as high as the 2005 peak.
You are not claiming year to year correlation, so 2017 may be an outlier, there does seem to be a general similarity in what you show, though I would like to see more explanation on how a lag like that could work physically.
Deep ocean cycles could produce a lag but I’d be more inclined to look at integration of power input to produce a thermal energy result. That would produce phase lag , not a time lag , so would change the form. No sure the short term peaks will survive that. Worth a look.
Hi GG
It is the principle that maybe important here, while with the 15 year lag it is not expected that inter-annual variability would accurately track from one variable to the co-variant, even if data for AAP or ACE was accurate.
From JC’s diagram it is clear there maybe two and half 60 years distinct blocks, if de-trended and crudely generalised a 60 year Sin/Cos type wave-form would appear.
For the AAP data is for a much shorter period, but about 60 year period may be gleaned, with what appear to be decade or so inter-cyclical movement (from 9yr AMO or from 11yr SSN) since the AMO is lurking in the area and solar input can’t be totally ignored.
Lag of 15 (=60/4) years (i.e 1/4 of the periodicity, Sin – Cos relationship) would imply that variable A is derivative of variable B. That is not to say A drives B, or B drives A, simply that the cyclical energy transfer between A and B is at 60 years periodicity, while inter-annual differences may be due to multiplicity of local causes, be it in the Arctic (infamous polar vortex) or subtropical Atlantic (butterfly wing flaps or the Sahara dust storm).
Reading Ch 3, the changes look to be general “character”. An analogy: the world is a bar, and hurricanes are patrons. The changes she details soynd like the patrons who come to the bar are now rowdier, though fewer if them.
Now, this analogy may sound frivolous, but it is not. In terms of a bar, patron-type changes over time. Today’s patron is not often the same patron a year or two on. So the question for the bar – and weather, which is what hurricanes are – is whether the character change is fixed or one of a shifting series.
Curry’s comments reflect less than 30 years of good data. Since we see repeated patterns of about 22 and 60 years in temperature and AMO/PDO data, I wonder if all we are seeing is another half cycle. Character changes – how large the crowd, how excited, where they go before and after – could be nothing at all unusual, only now we recognize it.
Word of the Day: Pareidolia
Pareidolia (/pærɪˈdoʊliə/ parr-i-DOH-lee-ə) is the tendency to interpret a vague stimulus as something known to the observer, such as interpreting marks on Mars as canals, seeing shapes in clouds, or hearing hidden messages in music.
https://en.wikipedia.org/wiki/Pareidolia
These hurricane graphs are just random noise. Seeming to see patterns in random noise, like seeing animal or human shapes in clouds, is just a fantasy of the human mind. The climate hustlers want to see patterns in random up and downs that affirm a climate change alarmism belief. And cherry picking aids immensely in this regard.
Judith, great article, but I have a question: How does one get a 12 month or a 24 month “running mean” (Figs. 3.1 & 3.2) through 2019? Doesn’t a 12 month running mean have to have 12 months of data?
Oops, meant to delete this and hit “send.” Sorry
Join the club of ‘fumble fingers’
Did anyone look at the relationship between huricane frequency and cool and warm periods? This, and other confounding factors in warmologist climate science seem to be blinders, terra incognita, places one must not go. The 50s and 60s were indeed exceptional for hurricanes. Hurricane Hazel made landfall in the Carolinas, traveled cross country to the NW and killed 81 people in Toronto!!
This was during a climatically cool period. Indeed, somewhere in WUWT postings when everyone was crowing about no landfalls in the US for 12yrs, I cautioned that there is a 60-70 yr cycle of temperature swings and sceptics should be ahead of the curve predicting the present (pause) actual cooling period would likely see a rebirth of strong hurricane activity like the 50s because alarmists woukd be all over it. (I wish I knew how to dig this comment out of the archives). I believe Bastardi and D’Aleo actually use such historical stuff to make their wonderful oreductions.
Orher terra incognita that effect proper practice in climate science include the Great Greening and bumper crops, the only unequivocal sign of climate change, and it must not be given attention (a huge positive benefit of CC). They dishobestly attribute forest growth and crop gains, mainly to a fraction of a degree 9f warming, which in fact is largely concentrated in the Arctic! The other one is CO2 mapoibg showing the largest ’emissions’ from trooical forests!
[With over 6100 approved comments, the search one particular comment of yours would indeed be long and tedious. But we do thank you for your continued, capable and cogent conversational contributions. -mod]
Gee Mods, please dig my very fine contribution out of the censorship darkness. The algorithm may hot have liked my use of Joe B’s last name.
Thank You for the education Dr. Curry
For general interest climate4you has an excellent “air pressure” page:
“The wavelet analysis reveals several cyclic variations in the [Atlantic basin] ACE record …
… A dominant period of about 60 yr length characterises the entire record. Other variations are more dynamic over time, and may come and go, although two periods of 8-9 and about 5 yr length appear to be rather persistent. At the moment, especially the period with about 8 yr length appears to be important, and therefore not likely to disappear immediately …
… Thus, there is reason to expect that the development of ACE within the Atlantic basin in the near future will mainly be controlled by the above mentioned 60 and 8 yr periods. As the 60 yr period just now is entering its declining phase, it is likely that also the ACE value will show an overall decline during the coming about 25-30 years”.
For more on common periodicity in ACE and SST see my article on Climate Etc from 3 years ago :
https://judithcurry.com/2016/01/11/ace-in-the-hole/
Here is an update of the ACE vs SST graph : note the divergence problem post 2005 ! Oops, hide the decline.
In the southern hemisphere we have a postive IOD [Indian Ocean Dipole] operating at the moment.
A postive IOD means that sea surface temperatures off north western Australia are relatively cooler, reducing the probability of tropical cyclones [hurricanes] forming.
So far this season there has only been one cyclone off NW Australia and it didn’t make landfall.
The lack of cyclones means a lack of cooling rainfall in NW Australia.
The region becomes very hot, pushing hot winds down through SE Australia.
Consequently, and somewhat perversely, a cooler eastern Indian Ocean causes heat waves and associated bushfires in the southeastern states of Australia.
And don’t forget the now very persistent southern Indian ocean blocking-High pattern SW of Perth, that is persistently cooling SW Western Australia., that led to that NE Indian ocean surface cooling.
And also the persistent blocking-High in the Tasman Sea trade-winds flow, which has made north Queensland so lovely this year (for all but two weeks of summer, the coolest summer in decades … and there’s been quite a few of those recent years, excluding the last El Nino phase of course.
And the Tasman Sea high then pulls all that hot NW-Aust and central-Aust hot-air back down into the SE States, where record hot-air whining and whaaaahing was experienced throughout the middle of summer. i.e. “climate-change” was everywhere.
I predict more ‘unprecedented’ whaaahing to follow next summer due to more global cooling blocking highs … which BOM will undoubtedly hype as the “hotter…er…est summah EVAH!”
And of course this will be followed by SE Australia experiencing the longest coldest winter in 4 decades this winter. And BOM will (predictably) paint the return of winter cold as damning proof of an ‘unprecedented’ climate-weirding ’emergency’.
I gotta go dig a climate bunker.
Typo in third paragraph of section 3.1:
“No trend in ACE is seen, and the recent period of 2009 to 20015 was characterized by particularly low values of ACE.”
There may be more, but tl;dr.