Reposted from Climate Audit by Steve McIntyre
A common opinion (e,g, Scott Adams) is that the “other proxies”, not just Mann’s stripbark bristlecone tree rings, establish Hockey Stick. In today’s post, I’ll look at PAGES2K Antarctic data – a very important example since Antarctic isotope data (Vostok) is used in the classic diagram used by Al Gore (and many others) to illustrate the link between CO2 and the isotopes used to estimate past temperature. 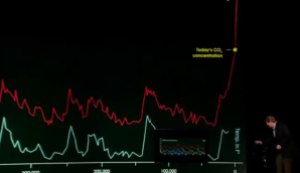
Antarctic d18O is one of the few proxies which can be accurately date in both very recent measurements and in Holocene and deep time. However, rather against message, Antarctic d18O over the past two millennia (as for example the PAGES2K 2013 compilation) has mostly gone the “wrong” way, somewhat diluting the IPCC message – to borrow a phrase.
PAGES2017 relaxed the PAGES2K ex ante quality control criteria to include 15 additional series (most of which are not new), but these, if anything, reinforce the earlier message of gradual decline over the past two millennia.
PAGES2K (2017) also added two borehole inversion series, which were given a sort of special exemption from PAGES2K quality control standards on resolution and dating. I suspect that readers already know why these series were given special exemption: one of them has a very pronounced blade. Long-time readers may vaguely recall that an (unpublished) Antarctic borehole inversion series also played an important role in conclusions of the NAS 2006 report. I tried at the time to get underlying measurement data, but was unsuccessful. A few years ago, when the PAGES2017 borehole inversion series was published, I managed (through an intermediary) to obtain much of the underlying data and even some source code for the borehole inversion. I’ve revisited the topic and I conclude today’s post with a couple of teasers and what is an interesting analysis in works.
PAGES2K (2013)
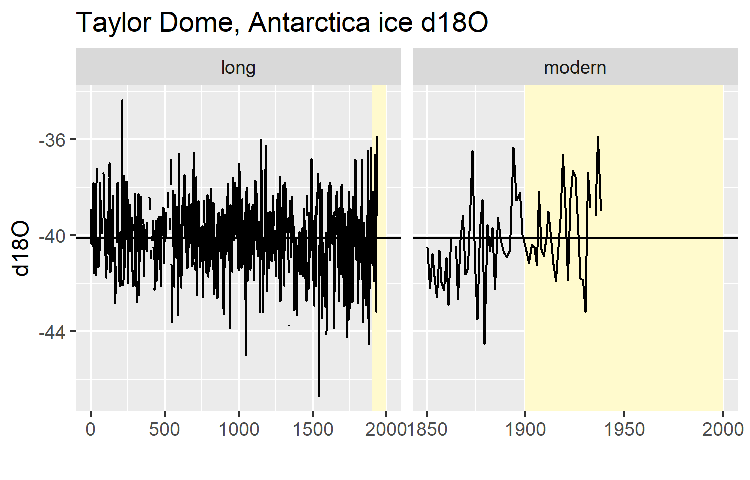
Here is a plot of the PAGES2K Antarctic temperature reconstruction. It showed a long decline from mid-first millennium, with nearly all 19th and 20th century values and even early 21st century below the long-term mean.
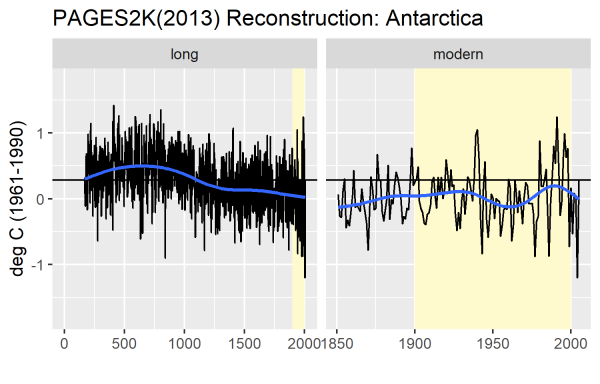
This series was used in IPCC AR4 (see below). Though its most recent portion is rather muddy in the IPCC diagram, the lack of any 20th century blade is clear.

PAGES2K authors used 11 datasets in their temperature reconstruction. According to their statement of methods, they applied sensible ex ante quality control procedures by aiming at use of “longest, highest resolution and best synchronized” of available records.
Data for the Antarctic reconstruction were selected based on a restrictive approach aimed at using the longest, highest resolution and best synchronized of available records. All records were water isotope (d18O or dD) series from ice cores. The project aimed to maximize coherence by using records that could be synchronized through either high-resolution layer counting or alignment of volcanic sulfate records.
I very much endorse this sort of ex ante quality control. Which is the opposite of the far-too-common practice of ex post selection of a subset of proxies. The 11 isotope series used by PAGES2K (2013) are shown below in a gif together with the reconstruction. The series, examined individually, also show the non-HS decline illustrated in the reconstruction composite.
Several of the high-resolution PAGES2K series extending back to the MWP were first archived as part of PAGES2K, including Law Dome (DSS) and Plateau Remote, both of which I had long and unsuccessfully sought from Tas van Ommen and Ellen Mosely-Thompson.
Earlier versions of Law Dome had been used in Jones et al 1998 and Mann and Jones 2004, the latter including an illustration showing a high MWP. As an IPCC reviewer of AR4, I had asked that Law Dome d18O be included in their figure showing high-resolution Southern Hemisphere proxies. Climategate emails (see CA discussion) show that IPCC authors snickered at this request, knowing that I had asked that they show a proxy with high medieval values. There was no way that they were going to show the Law Dome series. Despite sneering at my request, they recognized that they had to cooper up their rationale for not showing such an important series and inserted the excuse that there was inconsistency between the isotope data and the reconstruction from inversion of subsurface temperatures.
Contrasting evidence of past temperature variations at Law Dome, Antarctica has been derived from ice core isotope measurements and from the inversion of a subsurface temperature profile (Dahl-Jensen et al., 1999; Goosse et al., 2004; Jones and Mann, 2004). The borehole analysis indicates colder intervals at around 1250 and 1850, followed by a gradual warming of 0.7°C to the present. The isotope record indicates a relatively cold 20th century and warmer conditions throughout the period 1000 to 1750.
I mention this incident and excuse because the inconsistency between isotope data and borehole inversions re-appears in PAGES2017.
Stenni 2017
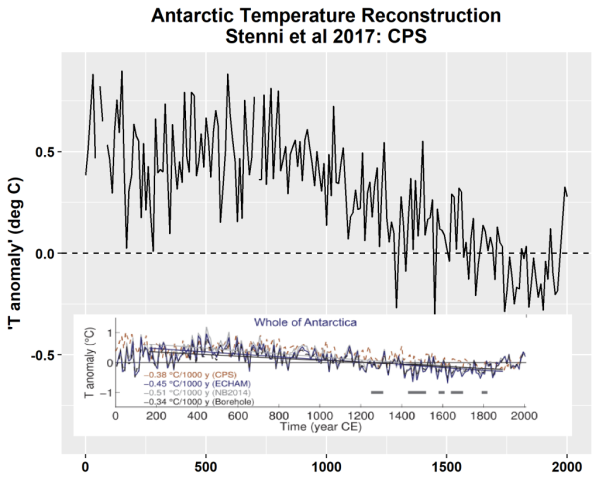
Stenni et al 2017 (pdf; CA discussion) presented a much expanded database of high-resolution Antarctic isotope data in response to PAGES2K. They presented 112 records (94 d18O; 18 dD) , many of which were short (36 limited to last 50 years or less). 15 records went back to AD1000; 9 went back to AD0. However, 4 of the additional series did not come up to the present or even to AD1950. Four series (TALDICE; DML07; DML17 and Berkner Island) dated from the 1990s; the reason for their exclusion from PAGES2013 is unclear. It included a much lengthened version of WDC06A, a companion hole to WAIS WDC05A. If a site had both d18O and dD records, they used the d18O record and did not double up. There was only one new long series: Roosevelt Island. It showed the long gradual two-millennium decline evident in other records.
Stenni et al produced a reconstruction, which, as pointed out at CA previously, used ex post screening to select series that had positive correlation with upward trending instrumental temperature data:
 Even with this bias, their temperature reconstruction had a pronounced downward trend over the past two millennium – entirely consistent with the Law Dome d18O that IPCC had refused to show in AR4 a decade ago.
PAGES2K (2017)
The PAGES2K (2017) dataset consisted of 27 series. They used 10 of 11 PAGES2K series (of which one series was updated), added 15 isotope series and two VERY unresolved borehole temperature reconstructions. 13 (of 15) new isotope series had been previously used in Stenni et al 2017; the other two series were dD series at sites where d18O series had already been used. The earlier compilations had avoided such duplication.
PAGES (2017) said that their standards for Antarctic ice core isotope series had been relaxed to include “shorter and decadal-scale-resolution” records:
for some proxy types, the standards in this version were broadened compared to the criteria used previously by PAGES2k regional groups. In most regions, records have been added that have become available since the publication of PAGES2k-2013, or that were not used in the continental-scale reconstructions because they are not annually resolved and therefore did not conform to the reconstruction method used by a particular regional group. In Antarctica, for example, PAGES2k-2013 included only the longest annually resolved ice cores, whereas the present version includes shorter and decadal-scale-resolution records.
Of the 15 new isotope series, 5 begin after the medieval period; 5 end before 1940; 4 have decadal resolution or less. None of the new isotope series begin prior to AD1000; end after AD1950 and have better than decadal resolution. Three series which begin at exactly AD1000 meet the other two criteria. Of these three series, two (DML07, DML17) are from the same campaign and author as the 2013 series DML05 and add little new information. I mentioned the other series, an isotope series from Berkner Island, five and seven years ago in connection with the SH network of Neukom, Gergis and Karoly(see here, here). The new isotope data show the same two-millennium decline as PAGES2K and Stenni et al 2017.
The two borehole series invert downhole thermometer temperatures to supposedly estimate past temperature. These inversions use extremely ill-conditioned matrices – an issue that doesn’t seem to be clearly understood by proponents – with resolution far lower than PAGES2K standards. (PAGES2017 falsely asserts that one of the two series has annual resolution, and that the other has 100-year resolution.)
PAGES (2017) acknowledged that the resolution of borehole inversions was “less straightforward” than other proxies – an understatement, but nonetheless asserted, waving their arms wildly, that the records were “appropriate for examining decadal to multi-centennial variability”:
PAGES2K scientific questions focus on centennial and finer time scales. Terrestrial and lacustrine records were included with average sample resolution of 50 years or finer. However, such records are rare from marine sediments, and thus a minimum average sample resolution of 200 years was accepted for this database. We also included 4 borehole records, although quantifying median resolution is less straightforward in boreholes than in other archives. The borehole records in the database are appropriate for examining decadal to multi-centennial scale variability, depending on the timeframe of interest [21- Orsi et al, Little Ice Age cold interval in West Antarctica: Evidence from borehole temperature at the West Antarctic Ice Sheet (WAIS) Divide. Geophysical Research Letters 39, L09710 (2012). pdf
There is, of course, a different and real reason for PAGES (2017) insertion of borehole records which didn’t meet PAGES2K ex ante quality standards: the borehole inversions, especially at WAIS Divide (shown in the gif below) have a pronounced 20th century blade, which is absent in the Antarctic isotope data. Cynical readers might reasonably conclude that this had something to do with the PAGES2K decision to abandon its quality control standards for these records.
Discussion of Antarctic Borehole Data
I’m going to write a detailed analysis of the WAIS Divide borehole inversion in a separate post . Antarctic played a surprisingly prominent role in conclusions of the 2006 NAS paleoclimate report, but NAS provided no citations for their assertions about Antarctic. I challenged their assertions and, in a surprise appearance in Climate Audit comments, Eric Steig agreed with my criticisms (while slagging me either for making the criticisms or, more likely, for existing.) I was later able to determine from a NAS panelist that their assertions about Antarctic were based on unpublished borehole inversion data. I tried to get the underlying data (measured in 1994-95) from USGS but the data could not be provided to me because it lacked “official USGS approval” which had thus far not been obtained due to other pressing obligations. (Twelve years later, the data remains unarchived.) In 2009, I looked at inversion techniques for downhole temperatures in “boreholes” in rock. (These almost entirely come from mineral exploration.) I noted that the techniques required inversion of very ill-conditioned matrices and that some properties looked like Chladni-type artifacts.
When Orsi et al published their borehole inversion in 2012, I asked an associate to request for data and code (figuring that it would be pointless to request the data myself.) Orsi courteously sent both data and code to the associate, who sent it to me. Much of the code had been written in 1990 in an antique Fortran; the rest was in Matlab. I spent some time in 2012 trying to figure it out, but put it to one side after a while. I’ve re-visited the topic with some interesting results which I’ll write up at length, but, for now, give two teasers.
First, the downhole temperature curve was both convex and smooth. (Convex means that there were no changes in the direction of curvature.) However, the reconstruction had three major changes in curvature direction and, in detail, many small changes. Mathematically, this is very unsettling: without some very peculiar conditions, the inverse of a convex and smooth curve ought to be convex (or concave) and smooth as well. So how do the changes in curvature in the reconstruction arise? Are they real or an artifact? (In some prior CA posts, I’ve discussed changes in curvature in connection with Chladni patterns arising from principal components on tree ring networks – so there are some interesting connections to a long-standing mathematical interest.) However, it’s a little long and detailed for this post.

While I was trying to figure out the code, I noticed the authors had excluded the top 15 meters of their data “because of the influence of the weather on surface measurements”. This raises an obvious question: what did the excluded data look like?
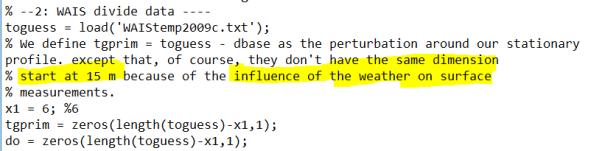
Orsi’s unpublished data package didn’t include a file named “WAIStemp2009c.txt”, but did include a file entitled “WDC05A_BoreholeTemp_300m_2009.txt”, which contained downhole temperature measurements taken in January 2009.
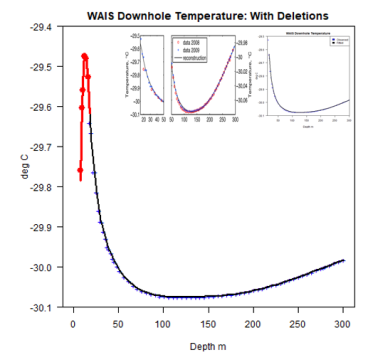
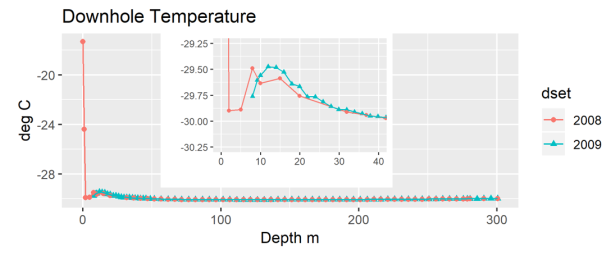
% as measured in January 2009″, which contained six excluded measurements between 8 and 15 m. The excluded data is shown (in red) in figure below: it continued upward a little further, then declined, retracing about half the increase. Given that the overarching conclusion of the article was rapid recent increase in temperature, it seemed unsettling that they had deleted the most recent data (which went down). The text of the article also cited 2008 measurements, which had not been included in the data package. They turned out to be online at USAP here and are plotted in right panel: ice sheet temperature in the topmost 2 meters reversed the decline, increasing by more than 16 deg C – an effect that was clearly “weather” not “climate”.
Van Ommen et al (1999) contained an informative graphic (replicated below) which showed the dramatic annual variation in near-surface ice sheet temperature: in the top meter or so, temperatures ranged from ~-30 deg C in winter to ~-13 deg C in January, with the amplitude of the variation attenuating by ~15 meters deep. The shape of the temperature profile in the top 15 meters is distinctly of the form of a damped sinusoid: one can reasonably also see a damped sinusoid in the top few meters of the WAIS data as well.
The problem with the top ~15 meters or so is the effect of ordinary (average) annual variations, not “weather”. One can see how the elimination of the top ~15 meters of data sidesteps the thorny problem of disentangling these annual variations, but this surely comes at a heavy cost. Ice cores can be accurately dated by layer counting (based on visual appearance and annual d18O cycles). Layers at 15-18 meters date back to the 1960s. Orsi et al purport to reconstruct temperature up to 2007, but they do so without using ice core dating from ~1965 to 2007. The calculation is entirely done from ice core layers dated prior to the 1960s.
Conclusion
I plan a separate post on the curvature issues, which are of mathematical interest (to me at least). I’m very dubious of these borehole inversions in general and am extra dubious of this borehole inversion in particular. From the perspective of PAGES2K (2017 version), it seems transparent that they plan to include even questionable borehole inversions in their composite in an effort to goose the inconveniently declining isotope data into a Hockey Stick.
As an oil geologist i have used borehole temperature logging to infer burial history but over depth range 0 -3,000 metres . Would normally exclude first 200 metres as reflectin a few thousand years of weather. Never really thought much about the resolution. Good enough for our purposes and not whole lot of importance attached to the whole shebang. Probably quite shaky.
Now my brother does the same sort of inversions with Quebec permafrost borehole inversions 0-100 metres. He seems to think it al adds up to A G W. And possibly billions hang on it.
Mathematical rigour ?
Uncertainty?
Dont know really, and I suspcect really neither does he.
Dont like to bring the subject up as he is dyed in the wool Paris treaty fanatic and views me as Satan spawn oil company shill, and most of my family hate me because of my sceptic mindset so best let them stew in their own juices. I.e. Let myself be bullied into silence to keep the peace.
“First they came for the Jews, and I did not speak out for them” etc etc
The difference is your work dealt with your money (your employer’s money) in which wrong answers meant the loss of your money (other the employer’s money) and your job.
In the case of your brother , wrong answers only mean more taxpayer money. There is no incentive to be right.
This is really sad. Sorry, man.
PAGES2K ….pages too korrupt ?
So the message I get from Steve MacIntyre is that straighforward Law Dome d18O proxy is OK but borehole inversion is a bit shaky and subjective . Please correct me if I am wrong in either assertion
https://climateaudit.org/2016/08/03/gergis-and-law-dome/
see the attached link regarding Law Dome.
Law dome has elevated MWP temps and therefore was excluded from most versions of pages 2k, gergis. Mann2003 included law dome, but it was so heavily under weighted that it was of no consequence.
Steve M has numerous other analysis of gergis and pages 2k .
The best (most charitable) characterization of those studies is that they provide zero insight into past temps. Other scientists (not the activists) would characterize those studies less charitably.
The other point, if all the proxies were used (instead of being excluded with ex ante selection), and if the proxies were properly weighted, then the MWP would appear globally and that would be against the rules.
Good to see Steve McIntyre back doing what he does best, busting fake paleoclimate.
Pages2K has proven an unmitigated ongoing disaster. One could almost assert multiple instances of probable scientific misconduct
Yes, it is good to have him back, as it seems the war against ‘declines’, continues.
He caught some grief for his analysis of what he believed were staged chemical warfare attacks. In my view, his treatment of the subject was balanced and insightful.
Likely to be dismissed as more “impenetrable nonsense” by a well-known climate persuasion expert.
Likely to be clear to the rest of us. Thank you for your contribution on this topic.
So, same as it ever was. They’re crooks.
Or just incompetent.
A lot of the weaknesses could have been avoided if they just claimed they ran up to 1960s instead of 2007.
Still a bit perturbed as to how the recent decline can be binned as weather contamination but the immediately preceding spike isn’t questioned.
what I have been asking myself for a long time is that CO2 and N2 / O2 begin to form in different deep clathrates. if I remember correctly it starts with CO2 in 60m and N2 / O2 in 200m depth. This inevitably leads to a different diffusion behavior. during ice formation and during drilling. the cores are not transported up to the surface in pressure chambers. I also remember reading somewhere that you find different levels of concentration, depending on whether the ice was grated or thawed before the analysis. I’m an absolute amateur in this area, but a good analyst. I’m pretty sure I’ll find someone here who knows the subject much better. Is there literature, papers or other material? it would be wonderful if someone could help me.
“The calculation is entirely done from ice core layers dated prior to the 1960s …”.
=================================================
There is the awkward fact that both HadCRUT4 (from 1957) and UAH (from 1979) show the observed temperature trend at the Antarctic to be flat, no CC™ at the Antarctic of all places where it should be most apparent.
Hide the recline.
Well, it’s climate science. What else would we expect?
Isn’t it a freaking tragedy that this was the first thought that came to mind?
“… These inversions use extremely ill-conditioned matrices – an issue that doesn’t seem to be clearly understood by proponents – with resolution far lower than PAGES2K standards….”
In a technical comment I sent to Nature magazine regarding borehole reconstructions of past temperature by Pollack and Huang circa 2000, I pointed out the ill-conditioned nature of this inversion. They also used rather circular logic of starting their “Bayesian” reconstructions with the alleged “neutral prior” of a flat temperature history, penalizing the solution from deviating from the prior unless the data were very, very good, and then trumpeting their results as looking like the hockey stick. Their method probably could arrive at no other result. Nature decided to not publish the comment because Pollack and Huang said I was wrong.
I decided to enter the fray never again.
One of the best pieces of advice from my graduate advisor was to take a course in numerical analysis and learned the many evils of Ill Conditioned Matrices. Couple that with noisy data with limited resolution, and reconstructions are going to be all over the place. A temperature should be useful in validating long term trends in other proxy data, i.e. use the proxy data to simulate thermal diffusion and see how that matches up with the borehole data.
… which, of course, is exactly what they were hoping to achieve.
Very nice forensics work by Steve here.
More exposure of the climate corruption that is rampant in climate science, and signed off by the NAS.
Furthermore, do the PAGES2K manipulators really think no one is the future will get funding to pull their own cores?
Antarctica is very big place, It offers an unlimited number of locations and future opportunities to run bore-holes, collect new cores, and run new analyses. Even just a few hundred meters away from previous boreholes, their reconstructions will be tested again one day. History will not be kind to the fraudsters.
Scott Adams….cartoonist.
John Cook…….cartoonist.
Causation/ correlation?
The massive support manipulators get comes out of the idea that only a crazy person would believe that a giant global conspiracy among all universities, most scientists, all scientific organizations, most mainstream media and governments, NGOs, etc, is afoot to enable a political agenda unrelated to climate. They’ve all heard of The Big Lie (i can even trust Wiki with this one):
https://en.m.wikipedia.org/wiki/Big_lie
But the trick in the climate case is to promote a lie orders of magnitude greater than the WWII personage who invented “The Big Lie”. The liars have succeeded hugely. Cook’s “97%” is, of course baloney, but the effect is the same as if it were. Think the handfull of Soviet dissidents that faced such a majority. As the Greenpeace threat said regarding sceptics,
“You be few. We be many. We know where you work. We know where you live!”
https://www.prisonplanet.com/greenpeace-to-global-warming-skeptics-we-know-where-you-live.html
Each time the H2O molecule undergoes a phase change, the 18O/16O fractionates. The degree of each fractionation is temperature dependent. The 18/16 measured in an ice core represents the SUM of fractionations that occurred between evaporation from the ocean and condensation of snow over Antarctica. The origin of water forming snow over Ant is mostly the cold circum-Antarctic Ocean. IF that ocean source changes temperature, that will be reflected in 18/16 of the ice. Unless there are data indicating that ocean temperature (e.g. 18/16 in marine deposits) that ocean temperature change may be unknown by the researchers and thus not corrected. A common assumption is that source temperature does not change throughout.
IF the ocean source of the water that formed the ice warmed, say a few hundred years ago by changes in south Pacific or south Atlantic currents, then the degree of 18/16 fractionation in the ice would decrease (This is why changes in 18O/16O (also in 2H/1H) are opposite temperature changes when both are plotted together.) When the ice core shows a decreased 18/16 fractionation, that might be interpreted to indicate warming of the atmospheric temperature over Ant, when in reality it was warming of the surrounding ocean water and not the air.
Using isotopes to indicate past temperature can have pitfalls if one is not careful.
The Adjustocene is a really complicated epoch to disentangle …
It seens that there are problems with CO2 too … don’t know who is right/wrong, honnest or fudging data, but somme past and recent inconvenient measurements (ice core proxies and chemical methods) might have been discarded :
https://www.geocraft.com/WVFossils/Reference_Docs/180_yrs_Atmos_CO2_Analysis_by_chemical_methods_Beck_2007.pdf
I wonder what level of credibility can be given to Ernst-Georg Beck thesis (link above) and if any, who will put his foot in it.
A lot of credibility…
Source
Voted as best posting at AAAS 2011 meeting
Useful information. Thanks
You are welcome.
Unfortunately he died way too early, while working over his doctoral thesis.
“There was no way that they were going to show the Law Dome series.”
This is one more element that makes the state of Nutrition science a good analogy for Climate Science.
Thirty-five years ago, a famous study called the seven nations study led scientists to conclude there was a strong link between high fat diets and obesity. The general population is just now beginning to realize that no such link exists, even though scientists pointed out the obvious flaws in the underlying study. One of the obvious flaws was that the study excluded those countries known for high-fat diets as well as a healthy population.
The leading British nutritionist at the time, John Yudkin, who pointed out the flaws was professionally destroyed, and anyone who agreed with him risked their career being ended as the reigning scientists played king-of-the-mountain with their scientific consensus.
The result has been an unprecedented obesity epidemic, resulted in higher health care costs and untold premature deaths. If Climate Scientology follows the same cycle, it may have another 20 or 30 years left in its run.