
Guest essay by Eric Worrall
Because climate scientists predicted all along that global warming = more snow.
Austria Avalanche: How much more snow will fall? HUGE snowstorm hits Austria and Germany
AVALANCHES caused by heavy snow fall in parts of the Alps have resulted in the deaths of at least seven people. But how much more snow will fall after a huge snowstorm hit Europe?
By RACHEL RUSSELL
PUBLISHED: 09:34, Tue, Jan 8, 2019A plunge in the jet stream has been made a devastating impact in parts of Europe since New Year’s Day, according to The Weather Channel. The deadly weather started by a storm sweeping in from the North Atlantic into Scandinavia and northern Europe on the first day of 2019. This system was reportedly named Storm Zeetje and brought the first storm surge of the year on the Baltic coast of Germany and southern Denmark.
The system then headed into eastern Europe and brought moist cold air into the higher elevations, including the Alps.
Ski resorts in the Austrian Alps reported up to seven feet of snow in the first days of January, which lead to many resorts closing amid safety fears.
Leon Brown, Head of Global Meteorological Operations with The Weather Company said this has been “probably one of the worst winters in the Alps for avalanches” since 1999.
…
Let us hope any other people in danger make it to safety.
Here’s Dr David Viner 19 years ago predicting the end of snow. And Robert Kennedy jnr said much the same in the US about the same time. How wrong could they be?
https://www.dailytelegraph.com.au/blogs/tim-blair/children-just-arent-going-to-know-what-snow-is/news-story/5a16c85680b7cc94f345240a727fb09d
CHILDREN JUST AREN’T GOING TO KNOW WHAT SNOW IS
Tim Blair, The Daily Telegraph
January 17, 2013 4:03am
The Independent, 2000:
Snow is starting to disappear from our lives. Sledges, snowmen, snowballs and the excitement of waking to find that the stuff has settled outside are all a rapidly diminishing part of Britain’s culture, as warmer winters – which scientists are attributing to global climate change – produce not only fewer white Christmases, but fewer white Januaries and Februaries … Global warming, the heating of the atmosphere by increased amounts of industrial gases, is now accepted as a reality by the international community … According to Dr David Viner, a senior research scientist at the climatic research unit of the University of East Anglia, within a few years winter snowfall will become “a very rare and exciting event”. “Children just aren’t going to know what snow is,” he said
“According to Dr David Viner, a senior research scientist at the climatic research unit of the University of East Anglia, within a few years winter snowfall will become “a very rare and exciting event”. “Children just aren’t going to know what snow is,” he said”
I’m sure he meant “light” snow(fall) will be a rare and exciting event.
Light. See, fixed.
Glad we’ve now satisfactorily revised that bit of embarrassing history.
Great little spin there! I like the way you think!
Actually, in the UK we have had “the wrong type of snow” for quite some time now. It even has its own Wikipedia page.
https://en.wikipedia.org/wiki/The_wrong_type_of_snow
Vinter was wrong
The IPCC sees a loss from 7% to 25% (RCP 8.5) by the end of the century
RCP 8.5 is rather unlikely, so you can expect
7% to something like 15% loss over the NEXT 80 years!
please dont get your science from one dude.
say its 20% over 80 years.. that is not going to show up in any statistics for a while.
In general though, you should not be surprisied by more snow in the winters seasons and less snow in spring .
As for Europe?, again IPCC
germany winter season?, expect a small increase in precipitation ( a couple of mm)
chapter 14
temperatures in the next few decades?
” studies indicate that European winter variability may
be related to sea ice reductions in the Barents-Kara Sea (Petoukhov
and Semenov, 2010) and CMIP5 models in projections for the future in
general exhibit a similar relation until the summer sea ice has almost
disappeared (Yang and Christensen, 2012). Although the mechanism
behind this relation remains unclear this suggests that cold winters
in Europe will continue to occur in coming decades, despite an overall
warming.”
Short version:
More snow – Global Warming.
Less snow – Global Warming.
No. More precise version
By season:
In the fall and winter, there will be some chance of more snow fall, due to increased
water in the atmopshere. it takes two things to make snow. Moisture and The right
temperature.
In the spring and summer, you can expect less snow and faster melting snow due to
warming temperatures.
OVERALL ( total season) you can expect MINOR decreases ( 7-25%) in total global snow cover.
Like folks say, the climate is very diffcult to understand. It would cool if it was a simple story like….
warmer everywhere every year.. but its not that simple
less snow every where in every season every year, but its not that simple
But congratulations, you’ve falsified a theory that doesnt exist.
classic ‘find the lady ‘ stuff ,;)
New short version: changes in snowfall too subtle to be detectable – Global Warming.
“New short version: changes in snowfall too subtle to be detectable – Global Warming.”
Not really,
It all depends on the most un predictable thing of all.
How much c02 and OTHER GHGs we emit.
The change won’t be UNDETECTABLE, but once you know the effect size will be
rather smallish ( 7-20%) over 80 years, then you know that Looking at THIS signal will
NOT be your best bet to detect a change.
And since you know there is wide variability, you’d be wasting your time to look at short time series.
But, if you were doing long range planning for a community that relied on snow,
you might want to take care to diversify your economy, which you should be doing anyway
Hello Steven Mosher,
Now let me get this straight:
1) Human CO2 emissions have increased massively over the 20th Century (exceeding 3.7 GT in the 1930s, 9 GT in the late 1950s,18 GT in the early 1980s and now 37 GT in 2018), resulting in ‘unprecedented’ atmospheric concentrations of the molecule, now at something like 410 ppm, or 0.041%. The rise in global human CO2 emissions closely follows both population growth as well as the increase in living standard worldwide.
2) This elevated concentration is going to cause unprecedented warming to the global climate system (atmosphere-ocean at the earth’s surface) in the ‘not-too-distant future’, according to well-established climate science.
3) The observed warming is “unequivocal” and is caused by [human GHG emissions, chiefly CO2].
4) Despite repeated claims of “urgency” [to drastically reduce human CO2 emissions, lest the climate system reach a tipping point] having been made by ‘mainstream climate scientists’ over the past three decades, you are now telling us that the natural decadal variation may indeed be greater than the [warming] effect due to CO2, that the effects may only be detectable separate from the natural changes several decades in the future?
5) How on earth could you possibly promote a reduction in CO2 emissions as being a wise use of funds if you can’t even establish ‘unequivocal’ evidence that the well-documented massive increase in CO2 emissions over the past seven and a half decades has not resulted in a permanent shift in the natural climate?
As an unequivocal marker, please show us an acceleration signal in the global mean sea level rise [which has been caused by said human emissions]. Should that prove too difficult, please share another metric which you would deem sufficiently robust.
(It would require multiple trillions of USD / GBP / CHF just to reduce global human CO2 emissions to levels from the 2000s or 1990s, let alone the 1980s, 1930s or even “pre-industrial” levels, assuming that such a step would indeed be desirable. It is not even clear that global reduction in human CO2 emissions would even be achievable at all; this is quite separate from the human suffering which would entail from such a massive effort to throttle human combustion of fossil fuels, particularly in the poorest regions of the globe.
Remember, some 60 y ago, the global population was about 3 Billion, or 40% of today’s figure, with annual human CO2 emissions about 24% of today’s levels. Globally, the use of fossil fuels is still increasing year on year, despite some indication through 2017 that coal use had flattened (which has indeed increased during the course of 2018 by approx. 3% over 2017). So there is no global trend of reduction in human GHG.
More importantly, said efforts to heavily restrict human CO2 emissions would have zero chance of flattening the Keeling Curve, assuming that the rise observed for the past six decades and counting is caused by the unprecedented human CO2 emissions).
This [collective madness to radically and extensively throttle human CO2 emissions, ‘cost us what it will’] fails to pass fundamental economics tests:
– If you can’t quantify a tangible Benefit, the Cost/Benefit Ratio is ∞.
– Likewise, your return on investment is negative (you can never break even).
If I’ve misrepresented your position, please be so kind as to correct me and set the record straight.
Re Mosher:
** warmer everywhere every year.. but its not that simple
less snow every where in every season every year, but its not that simple
But congratulations, you’ve falsified a theory that doesnt exist.**
Sure sure, is that from you or Viner.
You said ” please do not get your science from one dude.”
OK will do.
Why don’t you become realistic and say, “its weather”
Your “warmer everywhere” will soon become a bust.
Hi
“Hello Steven Mosher,
Now let me get this straight:
“1) Human CO2 emissions have increased massively over the 20th Century (exceeding 3.7 GT in the 1930s, 9 GT in the late 1950s,18 GT in the early 1980s and now 37 GT in 2018), resulting in ‘unprecedented’ atmospheric concentrations of the molecule, now at something like 410 ppm, or 0.041%. The rise in global human CO2 emissions closely follows both population growth as well as the increase in living standard worldwide.”
A) Not sure I would agree with all of your adjectives “massively” “unprecedented”
B) Not sure what you mean objectively by “follows” closely.
C) Not sure how you measure living standard “worldwide” or even If I would
agree with such an assesment.
D) If you only look at C02 you won’t understand the climate.
“2) This elevated concentration is going to cause unprecedented warming to the global climate system (atmosphere-ocean at the earth’s surface) in the ‘not-too-distant future’, according to well-established climate science.”
A) “This elevated concentration”? You mean 410?
If you mean, 410, then No.
B) If we stabilized at “This” elevated concentration of 410, I’m not sure how much warmer it would get. You’d have to calculate the warming in the Pipeline.
C) Unprecedented? Hmm, I would be cautious there. First, its not important
whether it is unprecedented or not; second, all the data I’ve looked at from
paleo has pretty wide error bars. Plus if you go back really far in the record
there were warmer times. Not exactly interesting.
“3) The observed warming is “unequivocal” and is caused by [human GHG emissions, chiefly CO2].”
A) Yup, its warming. There was an LIA!!! even Tim Ball agrees!
B) Causation? I haven’t done the work on this recently. In the past the work
I was a part of allocated 100% of the warming to GHGs and solar. I wasn’t
particularly satisfied with this work ( or the approach) . In the distant past
( circa 2008) I would have put the figure above 50%
I’ve seen no convincing analysis that puts it below 50%.
C) CO2 is important, but you cant ignore methane and black carbon.
“4) Despite repeated claims of “urgency” [to drastically reduce human CO2 emissions, lest the climate system reach a tipping point] having been made by ‘mainstream climate scientists’ over the past three decades, you are now telling us that the natural decadal variation may indeed be greater than the [warming] effect due to CO2, that the effects may only be detectable separate from the natural changes several decades in the future?”
A) No I am not telling you that. read harder.
“5) How on earth could you possibly promote a reduction in CO2 emissions as being a wise use of funds if you can’t even establish ‘unequivocal’ evidence that the well-documented massive increase in CO2 emissions over the past seven and a half decades has not resulted in a permanent shift in the natural climate?”
A) I don’t think you’ve read me on Policy have you?
B) Do you know what No regret actions are?
C) No evidence behind ANY policy is unequivocal, For example, I think
the evidence is pretty slim that building a wall will help, but I am all for it.
D) Sorry , not seeing the “MASSIVE” shift you are talking about. Co2 is one factor
and it’s a ln() response, and lagged to boot.
E) Not seeing that any past predictions, asserted a shift at 410 ppm. Change is
pretty gradual, BUT, their may be tipping points. Very hard to say
“As an unequivocal marker, please show us an acceleration signal in the global mean sea level rise [which has been caused by said human emissions]. Should that prove too difficult, please share another metric which you would deem sufficiently robust.”
A) Sorry. I don’t do sea level. I do temperature.
B) You keep searching for uneqivocal. Wrong standard.
C) In the end folks who do policy can use any damn standard they want to
impose a policy.
D) Personally, I wuld ask for uneqivocal evidence that it is ZERO risk
to go above 350ppm. How’s that for a standard? if you cant
prove zero risk, then you have no business dumping your poop in the
commons.
“(It would require multiple trillions of USD / GBP / CHF just to reduce global human CO2 emissions to levels from the 2000s or 1990s, let alone the 1980s, 1930s or even “pre-industrial” levels, assuming that such a step would indeed be desirable. ”
A) I am not convinced by your assertion. It strikes me as alarmist.(multiple trillions
seem awefully VAGUE for a guy who likes irrefutable proofs
B) I like Nukes
https://medium.com/@Jorisvandorp/how-much-would-a-100-nuclear-energy-system-cost-3dd7703dd5d3
“It is not even clear that global reduction in human CO2 emissions would even be achievable at all; this is quite separate from the human suffering which would entail from such a massive effort to throttle human combustion of fossil fuels, particularly in the poorest regions of the globe.”
A) Ya with nukes it is pretty clear that we can cut C02, More importantly we can
get rid of nasty coal.
B) Not sure how supply cheap nuclear power to poor people hurts them?
“Remember, some 60 y ago, the global population was about 3 Billion, or 40% of today’s figure, with annual human CO2 emissions about 24% of today’s levels. Globally, the use of fossil fuels is still increasing year on year, despite some indication through 2017 that coal use had flattened (which has indeed increased during the course of 2018 by approx. 3% over 2017). So there is no global trend of reduction in human GHG.”
A) read that a dozen times and it still makes no sense what you are on about
“More importantly, said efforts to heavily restrict human CO2 emissions would have zero chance of flattening the Keeling Curve, assuming that the rise observed for the past six decades and counting is caused by the unprecedented human CO2 emissions).”
A) Huh?
B) Pretty sure if you replace coal with nukes that Keeling will respond.
C) pretty sure if mangaed to get net emissions to zero it will eventually
flatten out.
D) all this is pretty much beside the point however as you seem to be interested
in making speachess ( by assuming you understand my positions) rather
than having a dialog.
“This [collective madness to radically and extensively throttle human CO2 emissions, ‘cost us what it will’] fails to pass fundamental economics tests:
– If you can’t quantify a tangible Benefit, the Cost/Benefit Ratio is ∞.
– Likewise, your return on investment is negative (you can never break even).”
A) Not sure adjectives like madness illuminate anything other than your penchant
for hyperventilating
B) You may like economic tests, but policy makers dont necessarily follow the
guidance of the most dismal “science”
C) I’m unconvinced that Cost/benefit analysis is even appropriate,
D) Not sure you can even calculate or need to calculate an ROI.
“If I’ve misrepresented your position, please be so kind as to correct me and set the record straight.”
Ya you pretty much missed it by 135 degrees. You seem pretty certain of your views and certain of the science of economics and certain that you understand my position.
One can hope you practice a bit more skepticism.
“Sure sure, is that from you or Viner.
You said ” please do not get your science from one dude.”
OK will do.
Why don’t you become realistic and say, “its weather”
Your “warmer everywhere” will soon become a bust.”
##########################
because it’s not as simple as saying “its the weather”
Further. It will not become warmer EVERYWHERE,
today record warm days outnumber record cold days ( I think about 10 to 1)
However, we will STILL have record cold days somewhere on the planet in 2100
EVEN IF the average is 3C higher.
How is that? Its easy once you think about it.
Think about it. the global average goes up 3C, BUT you will still find
a day in 2100, somewhere on the planet, where the temp is a record cold!
“In the spring and summer, you can expect less snow and faster melting snow due to
warming temperatures”
Thank goodness i will be expecting less snow in the Summer , at the moment it is freezing in the Summer.
Richard
ya, less in spring and summer ( psst we are talking snow on the ground )
Like so
https://ibb.co/848DVbP
And like so
https://ibb.co/XVz51zf
And more in the fall and winter
Like so
https://ibb.co/9njsxfC
and so
https://ibb.co/1byYMnh
even more precise version:
This will all happen IFF the climate models prove to be correct… which seems more and more unlikely each day.
“even more precise version:
This will all happen IFF the climate models prove to be correct… which seems more and more unlikely each day.”
Hmm
I showed you HISTORICAL charts.
what they show?
1. Overall ( 50 years ) a small decline in annual snow, while temps went up
2. Winter UP ( as predicted)
3. Spring Down ( As predicted)
if it continues to warm I would expect these patterns to continue regardless of what climate models said.
read slowly.
IF it continues to warm from man made or natiural cause i would expect
1, and 2 and 3 to continue.
That’s what I would expect. no climate model needed.
Confidence? better than 50/50
Steve-san:
The Dr. Viner prediction was heavily propagandized by the Leftist media and he refused to correct it.
For example, CAGW alarmists (especially the clueless Leftist MSM and politicians) continue to regurgitate the patently false meme that 97% of all scientists believe in catastrophic Anthropogenic Global Warming.
You may correctly say that few actual scientists repeat this “97%” myth, but they don’t correct this blatant lie when prominent politicians and MSM hacks repeat it as it serves their agenda to keep this CAGW scam going for as long as possible.
All the empirical evidence show Northern Hemisphere snowfall extent trends have been Increasing over the past 30 years, which is contrary to what pro-CAGW alarmists and scientists keep spewing, and pro-CAGW scientists fail to correct.
“Steve-san:
The Dr. Viner prediction was heavily propagandized by the Leftist media and he refused to correct it.”
The only folks who seem to have taken it to heart are the skeptics who insist on getting their science from a suspect MSM. be smarter than that. Also, plenty of folks will make mistakes they refuse to correct. That fact says nothing about the actual science which you can read for free.
“For example, CAGW alarmists (especially the clueless Leftist MSM and politicians) continue to regurgitate the patently false meme that 97% of all scientists believe in catastrophic Anthropogenic Global Warming.”
Sure, and your best response is to quote the actual science to them. Not to whine about their sad misrepresentation. They handed you the perfect opportunity to say,
“The actual consensus says X”
“You may correctly say that few actual scientists repeat this “97%” myth, but they don’t correct this blatant lie when prominent politicians and MSM hacks repeat it as it serves their agenda to keep this CAGW scam going for as long as possible.”
Now you want Scientists to do the science, and to police the MSM and politicians.
I want the opposite. I want them to spend less time talking to the press and less time
on social media, and less time “peer reviewing” the crap people say in the MSM and
more time doing actual science.
“All the empirical evidence show Northern Hemisphere snowfall extent trends have been Increasing over the past 30 years, which is contrary to what pro-CAGW alarmists and scientists keep spewing, and pro-CAGW scientists fail to correct.”
No, ALL the empiriacal evidence ( which goes back to 1966) shows a SMALL decrease in Global annual snow, shows a small increase in winter snow, and large drop in spring and summer snow.
if you Cherry pick the last 30 years, yes you see a modest increase in global annual, but the same large drop in spring and summer.
ALL the emprical evidence means ALL.
Both 30-year and 49-year trends for Nothern Hemisphere Snow Extent show increasing trends:
I’m sure there is some pro-CAGW “scientist” hack that has “adjusted” the raw data to make the Snow Extent trend fall, but that’s not empirical evidence, that’s called malfeasance and fraud.
Steve-san:
Here is the empircal evidence showing both 30-year and 49-year trends for Northern Hemisphere Snow Extents are increasing:
If you have empirical evidence (not climate model BS) showing decreasing snow Extent trends, post it.
Ciao.
I just want to return to pre-1979 where climate imbeciles say all weather was perfect as the Brady Bunch.
Samuri,
There is a problem with the data prior to 1972 as the years have missing months.
I would send you back to the drawing board.
Lets try this
Here sammy
The problem with your chart is that You FORGOT rule number 1
Of doing climate time series.
CHECK FOR COMPLETENESS
library(dplyr)
library(ggplot2)
library(signal)
eurasia <- "moncov.eurasia.txt"
nam <- "moncov.nam.txt"
nog <- "moncov.namgnld.txt"
E <- tbl_df(read.table(eurasia, header=F))
N <- tbl_df(read.table(nam, header=F))
G <- tbl_df(read.table(nog, header=F))
E % mutate(Series= “Eurasia”)
N % mutate(Series= “North America”)
G % mutate(Series= “North America + Greenland”)
ALL % rename(Year=V1, Month=V2, Snow=V3)
MthCount % dplyr::filter(Series==”Eurasia”) %>%group_by(Year) %>% summarise(MonthCount=n())
ggplot(MthCount, aes(x=Year,y=MonthCount))+geom_line()+
ggtitle(“Global Snow Months with reported data”)
You see Sammy?
The years before 1972 are not data complete.
So years with fewer months reporting will have less snow than they would have if they had all 12 months reporting
Lets Do this>
Lets start with 1972 since Prior years have missing data
ALL % dplyr::filter(Year > 1971)
Mth % group_by(Year,Series) %>% summarise(Average=mean(Snow))
ggplot(Mth, aes(x=Year,y=Average, colour=Series))+geom_line()+geom_smooth(method=”lm”) +
ggtitle(“Global snow”)
Here
NOW, be careful cause 2018 has only 11 months ( when I grabbed this data )
See that,
Things to Note.
the data starts in 1966. We need to look for data completeness. if there are only 6 months recording, then we SHOULD DISCLOSE THAT and note it.
If we start in 1972 where the record starts to be complete for every year,
Then we see a slight decline.
And we should ALSO NOTE that the data for 2018 ( at least the data I grabbed)
had only 11 months reporting.
Now, you just posted a graph. No disclosure, no explaination. as IF you knew the underlying data.
So lets Continue Sammy.
First we look for data completeness . We find some irregularities
We note that and we explain our decision for starting in 1972.
Next, we explore the data some more.
We have monthly data what can we learn
ggplot(dplyr::filter(ALL, Month==1),aes(x=Year,y=Snow, colour=Series))+geom_line()+geom_smooth(method=”loess”) +
ggtitle(‘Global Snow extent Jan’)
Lets look at jan!
We see some increase in the winter.
Want to see Decemeber? Nothing to hide here just say so.
But before we do that, We have all this data, lets get a little curious
ggplot(dplyr::filter(ALL, Month==6),aes(x=Year,y=Snow, colour=Series))+geom_line()+geom_smooth(method=”loess”) +
ggtitle(‘Global Snow extent June’)
Dang Look at that!
So, here is the lesson.
What did you give folks? You posted a graph, you didnt make that chart, you had no idea about the data quality issues.
It told a good story.
You hid a lot of detail. You hid detail about the missing data, you hid detail
about the monthly changes, you hid detail about the geographic regions,
In short you wanted to tell a story with one graph.
Kinda Like Mann.
Me?
I would rather SHOW PEOPLE every step.
you start here
https://climate.rutgers.edu/snowcover/table_area.php?ui_set=2
Now, READ THAT PAGE
“Please note weeks with no data: 1968 27-30, 1969 23-43, and 1971 28-39.
Missing months are July 1968, June-Oct 1969, and July-Sep 1971.”
SEE THAT!
When you do data analysis you look for things like that.
When you cut and paste other peoples graphs, you hide shit like that.
After you download that data
Then HERE YOU GO!
Now I can update this if you like, maybe decemeber totals are in.
Want to see every month? seasons?
Easy, there is the code, go add the details you like.
library(dplyr)
library(ggplot2)
library(signal)
eurasia <- "moncov.eurasia.txt"
nam <- "moncov.nam.txt"
nog <- "moncov.namgnld.txt"
E <- tbl_df(read.table(eurasia, header=F))
N <- tbl_df(read.table(nam, header=F))
G <- tbl_df(read.table(nog, header=F))
E % mutate(Series= “Eurasia”)
N % mutate(Series= “North America”)
G % mutate(Series= “North America + Greenland”)
ALL % rename(Year=V1, Month=V2, Snow=V3)
MthCount % dplyr::filter(Series==”Eurasia”) %>%group_by(Year) %>% summarise(MonthCount=n())
ggplot(MthCount, aes(x=Year,y=MonthCount))+geom_line()+
ggtitle(“Global Snow Months with reported data”)
ALL % dplyr::filter(Year > 1971)
Mth % group_by(Year,Series) %>% summarise(Average=mean(Snow))
ggplot(Mth, aes(x=Year,y=Average, colour=Series))+geom_line()+geom_smooth(method=”lm”) +
ggtitle(“Global snow”)
ggplot(dplyr::filter(ALL, Month==6),aes(x=Year,y=Snow, colour=Series))+geom_line()+geom_smooth(method=”loess”) +
ggtitle(‘Global Snow extent June’)
ggplot(dplyr::filter(ALL, Month==5),aes(x=Year,y=Snow, colour=Series))+geom_line()+geom_smooth(method=”loess”) +
ggtitle(‘Global Snow extent May’)
ggplot(filter(ALL, Month==7),aes(x=Year,y=Snow, colour=Series))+geom_line()+geom_smooth(method=”loess”) +
ggtitle(‘Global Snow extent July’)
ggplot(filter(ALL, Month==4),aes(x=Year,y=Snow, colour=Series))+geom_line()+geom_smooth(method=”loess”) +
ggtitle(‘Global Snow extent April’)
ggplot(filter(ALL, Month==8),aes(x=Year,y=Snow, colour=Series))+geom_line()+geom_smooth(method=”loess”) +
ggtitle(‘Global Snow extent August’)
ggplot(dplyr::filter(ALL, Month==1),aes(x=Year,y=Snow, colour=Series))+geom_line()+geom_smooth(method=”loess”) +
ggtitle(‘Global Snow extent Jan’)
last Clue Sammy
be careful what charts you trust.
practice skepticism.
See that chart you posted with increasing snow? Does it fit your story?
BEWARE, that is the one most likely to fool you.
It will fool you because you have no motivation to check.
Training yourself to doubt and check what you believe is hard work.
Actually, its not hard. scratch that. Here is what I do.
If I see a chart and I cannot find the data, I SUSPEND JUDGMENT.
If I can find the data, I try to recreate the chart.
The only skeptic I know who consistently provides the data you need and code you need to check his work is Willis.
That doesnt mean I always AGREE with his analytical CHOICES, but he will
ALWAYS show me, rather than tell me, what he has done.
by showing me he actually gives me power, power to do something different, BUT ALSO the responsibility to ACCEPT his work if I can’t find anything wrong with it.
you just cut and paste stuff
I did that in 3rd grade art.
want more snow?
Nice, the december data is in
So here is what I will do for your sammy
Northern hemisphere
ALL the data ( includes showing the data about missing data )
From 1966
from 1972
From 1988
ETC
Re mosher
**The only folks who seem to have taken it to heart are the skeptics who insist on getting their science from a suspect MSM**
Wrong Steve. The MSM only posts the CAGW exaggerations. Skeptics have to get their science from legitimate blogs.
Hi Gerald
‘Re mosher
**The only folks who seem to have taken it to heart are the skeptics who insist on getting their science from a suspect MSM**
Wrong Steve. The MSM only posts the CAGW exaggerations. Skeptics have to get their science from legitimate blogs.”
Err No.
Read the science papers.
If you dont undrstand them, then suspend judgement.
that is what real skeptics do.
Huh?
SAMURI vanished
Is that a drive by?
For some strange reason, Mosh has suddenly gone caosh… 🙂 ;
subjectively… 🙂
no offense really meant…
cheers
My models predict more snow in winter than summer for the Northern Hemisphere. You are welcome.
I am finishing up an app for your use and those of your friends. It is called Word Parser. It allows the cover up and smoothing over of asinine predictions and idiot comments with parsed words. It is based on my previous app called Hair Splitter where you can scientifically and politically split hairs on the meaning of words by tracing back their changes in usage for 2500 years. The end result is garbage science based on principle of garbage English where words like “warming” have no meaning, and alternatively, mean anything you want. This is useful for your purposes even though you just garbagiated the concepts of average and extreme. The average temperature should get slowly warmer, but the extremes of cold would go away much sooner. The prediction was for observable extremes to be removed from our climate outcome going forward.
‘say its 20% over 80 years.. that is not going to show up in any statistics for a while.’
and ‘may be related’ ‘remains unclear’
This sort of ‘predictive science’ is a bit like wading through intellectual cotton wool.
Back in OZ we were told the dams would not fill, but they did.
The above prediction is like, if you wait long enough then our prediction will eventuate, but it looks like only our childrens’ children ‘may’, ‘not to be clear’, experience it.
So how are we supposed to find the Dude who actually knows what that Dude is talking about?
The best model is from the Russians.
“‘say its 20% over 80 years.. that is not going to show up in any statistics for a while.’
and ‘may be related’ ‘remains unclear’
This sort of ‘predictive science’ is a bit like wading through intellectual cotton wool.”
Not really, its just in the nature of the beast. Requires thinking beyond the mere black and white.
“Back in OZ we were told the dams would not fill, but they did.
The above prediction is like, if you wait long enough then our prediction will eventuate, but it looks like only our childrens’ children ‘may’, ‘not to be clear’, experience it.
So how are we supposed to find the Dude who actually knows what that Dude is talking about?
The best model is from the Russians.”
The “Dude” would be the IPCC. You should be familar with the process of a literature review.
So you have 10 studies on snow, you review them all. You look to see if any have been refuted. You compile a “consensus” opinion. 8 of the papers indicated medium snow loss,
1 said no loss and 1 said a small gain, but the one that argued for a small gain, was only focused on one country” You write up a summary, people object to your summary, you
rewrite. This is a consensus view. It’s NOT science, as the IPCC doesnt do science, but its
the expert assesment of all the relevant science published to date. Its a consensus VIEW of the science. None of the science you review appeals to consensus, consensus REFERS TO the process of summarizing all the science papers that have been written since the last AR.
if you want to know my process its pretty simple.
read AR5
Thats the summary of the best science. If you want more, dig down into the bibliography
and get the actual papers. Still not satified, dig deeper.
Now, if you read a MSM report? what do you do.
1. Suspend judgement.
2. Read the paper.
3. Convinced? or Not convinced? You decided too early!
4. Wait for other papers, wait to see if it is cited.
5. Convinced now? or not convinced? You decided too early.
6. Still curious? Go get the data.
7. Cant get the data or dont understand it? Suspend judgement
8. Still eager to decide? patience son, suspend judgement.
9. Did the new IPCC report come out? yup
10. Is the paper covered in the report? Nope? Dont worry suspend judgement.
11. Is tha paper covered by the report? Yup, well know you have to pay some attention
and decide IFF the paper is instrumental to your work.
You see most folks are keen to rush their judgment and accept or reject papers without putting in the work or without letting the process unfold. There is no need to rush to judgement. No need to blindly accept or reject.
For me, if a paper IMPACTS my direct feild of study, then of course I need to dig down for myself, but for things like snow and ice and huricanes and tornados, I’m more than happy to suspend judgment, and decide on my own timeline not the timeline of others.
I feel no great urge to accept or deny papers outside of my area. Just relax, take your time, keep your powder dry, you dont ned to have an opinion about everything.
As for politicians?
No controlling them except at the ballot box, neither facts nor science drive their process.
““The IPCC sees a loss from 7% to 25% (RCP 8.5) by the end of the century”
This is idiotic blather.
The met office and meteo France can’t even get the weather forecast right for next week.”
Idiotic Blather?
That’s not very nice.
And, of course, the “snowfall data” is accurate to the tenth of an inch.
Reagan airport consistently measures snow levels low. They did it on the last snow storm in December 2018 and here is an article from 2016 (in the Washington Post) https://www.washingtonpost.com/news/capital-weather-gang/wp/2016/01/24/paltry-national-airport-snowfall-total-raises-questions-about-observing-standards/?utm_term=.e7d1fc600536
We are constantly exposed to global temps measured to the hundredth of a degree and tide levels measured to the millimeter.. and it is all bogus. Since the fox is guarding the henhouse, just how can we accept anything as close to accurate?
I’m sorry, it’s all bullish!t. Ice sheets a mile thick will be coming down from the north and we will all be told it’s the third warmest global temps ever.
“And, of course, the “snowfall data” is accurate to the tenth of an inch.
Reagan airport consistently measures snow levels low. They did it on the last snow storm in December 2018 and here is an article from 2016 (in the Washington Post) https://www.washingtonpost.com/news/capital-weather-gang/wp/2016/01/24/paltry-national-airport-snowfall-total-raises-questions-about-observing-standards/?utm_term=.e7d1fc600536”
#############################################
A) I see you point, if reagan airport does it, therefore EVERY ONE DOES IT.
man have you got some awesome sampling theory there!! Nobel prize!
B) we are talking about EXTENT, not depth, but nice try at a diversion
C) Accuracy? Here is somthing funny, really funny
IF I showed you a chart with snow extent increasing you would NEVER
ask a question about sources, methods or accuracy. why?
here is the stuff I show BTW
https://climate.rutgers.edu/snowcover/docs.php?target=vis
“We are constantly exposed to global temps measured to the hundredth of a degree and tide levels measured to the millimeter.. and it is all bogus. Since the fox is guarding the henhouse, just how can we accept anything as close to accurate?”
A) you dont understand the precision of global temps. It is NOT
a measurement precision.
B) The global average is a PREDICTION of what ypu would measure with a perfect
system. basic spatial stats.
“The IPCC sees a loss from 7% to 25% (RCP 8.5) by the end of the century”
This is idiotic blather.
The met office and meteo France can’t even get the weather forecast right for next week.
They didn’t even forecast this latest snow, & are still not showing any sign of knowing F-all about the even bigger snow fall for later this month!
Any fool can see what will happen, when the jet stream goes straight up to artic then twists back down again in a northerly airstream.
Lots of snow from Germany right down to Athens, predictable as clockwork.
Despite all of this, the mass media are suprised when it’s winter in the northern hemisphere then chaos ensues in 3 of the world’s most advanced economies when weather does what weather usually does in January.
The rubbish spouted above makes us simply realise what a whole load of bollox is spewed out by Mcgrath, Harrabin & Macron to name but 3.
Are you really intent on joining such honourable company who are PAID (a lot)TO FAIL?
Pigs in space – read this morning (can’t recall where) that refugee camps
Lebanon are buried in snow.
Many of the unfortunate people are freezing to death.
The UN refugee bod in charge said ” Its global warming”
Say no more or does Mr Mosher agree with that prognosis?
Mosher last I looked still works on Berkley Earth so ask him how many years that projection is valid for.
I have asked him repeatedly but for some reason he never seems to respond .. because the answer is the same as weather forecasts they drop away rather quickly 🙂
“Mosher last I looked still works on Berkley Earth so ask him how many years that projection is valid for.
I have asked him repeatedly but for some reason he never seems to respond .. because the answer is the same as weather forecasts they drop away rather quickly”
Dude, I don’t do forecasts or predictions.
you dont WANT ME doing them.
I do observations. full stop.
Now, one practical reason you dont want me doing that forecast work is because of the potential for self interested decisions Having the same person doing the forecast and collecting the data? recipe for bad things.
Nope, data only sorry. Unless you want to pay extra. I volunteer my time to do what I love: data. Not interested in forecasts, pay up leftist and stop asking for free work.
So you are now claiming you are an archivist or statistician rather than any sort of climate scientist?
You are therefore paid what you are worth because you can tell us nothing of the future which is where the financial interest is.
“So you are now claiming you are an archivist or statistician rather than any sort of climate scientist?
You are therefore paid what you are worth because you can tell us nothing of the future which is where the financial interest is.”
1. I don’t actually claim to be anything!!Titles matter to me less than even formal degrees do! Never have made any claims.
2. Folks who hire me typically assign a title. There are two types of engagements
I take.
A) Data Analysis
B) Marketing
When I take a Data Gig, folks typically give the title data scientist. meh,
I prefer data monkey! toss me a banana. but they dont put that on the card
When I take a marketing gig, they call me marketing, but alot of it is data.
Usually, I just tell people I am an english major and then they underestimate me.
Sand bagging. it’s fun.
3. Forecasting. see my gigs, for data gigs it’s mostly historical, for marketing
its all forecasting.
Thanks for you kind attention
One BIG issue here in the US is most local weather forecasts are based on the US forecast model.. which according to Ryan Maue who measures its success on 5 day forecasts as really poor, especially compared to others.
For example on Jan 2, 2019, CPC forecast NO areas in the US with below normal temps from Jan 10-16. By January 16th there will have been a pretty good snow storm across the mid section of the eastern US into Washington DC and an Arctic outbreak enveloping everywhere east of the Mississippi River.
Their models are really, really bad and ought to be scrapped. And if you can’t forecast out a week, how the heck are you forecasting years in advance?
“Their models are really, really bad and ought to be scrapped. And if you can’t forecast out a week, how the heck are you forecasting years in advance?”
Pretty simply actually.
Lets think of some examples.
A while back I had had a forecasting project ( hate this) It went something like this.
Given the forecast max temperature ( 14 day forecast) predict the demand for Part X on a daily basis.
So lets just do a sample
Day 1.. day 14. And lets say the daily prediction was something like 5 parts
a day for the next 14 days, or 70 parts, except 1 super hot day that was 10 parts
so the total was 75.
Now if you looked at the daily performance of the forecast.. man it sucked
you’d have 0 sales, then 6, then 12, then 2, then on the super hot day 15..
daily sucked.
bi weekly? Spot on!. predict a total of 75, and the error was small.
daily ? sucked. weekly? very good.
Hint: climate models dont forecast days, weeks or months.
The US model is intended for shorter term forecasts (3 months and fewer) and is pure garbage. It runs about 85%-90% accurate for 5 day compared to the Euro, which is generally in the 95% range and once a week drops down to the low 80’s. And this is for a 5 day.
https://twitter.com/RyanMaue/status/1082654238084349952
Then start looking out to their 30 day and it is even worse. Energy planners, farmers and the like try to use this and when it is predicting the exact opposite of what transpires, it can actually harm people. If you can’t understand how bad it is, well I’m sorry. The results speak for themselves.
And as far as the climate models go, so far not so good, even with all the “adjustments” and “homogenization” put in.
“say its 20% over 80 years.. that is not going to show up in any statistics for a while.“
Hopeless.
IPCC.
RPC 8.5.
End of the 21st century.
“The IPCC sees a loss from 7% to 25% (RCP 8.5) by the end of the century
RCP 8.5 is rather unlikely, so you can expect
7% to something like 15% loss over the NEXT 80 years!”
This comment took the cake
“And since you know there is wide variability,”
What does wide variability mean?
First a get out of jail free card if the variability over 80 years is 7% or less.
Second, and very important statistically and mathematically that one could expect much bigger than 15% losses (or gains) over even the next 10 or 20 years, let alone 80 years. That is the definition of wide variability.
So understates the outcome, claims the outcome is not expected or predictable. Denies the possibility of 8.5 here while extolling it elsewhere. Gets the range totally wrong and stuffs up the probabilities due to the variability of the range in the given time frames.
A+.
Expected however when your argument is that increasing temperature leads to more snow formation in certain seasons.
There are temperatures with no snow ( too cold) , in between temps where snow is formed and more will form if there is more moisture in the air and no snow (too warm).
Cold is needed to produce snow, except for people forced to adopt a pretzel position.
The Northern Hemisphere snow cover is where this is enough land present at the right latitudes for the cold enough but moisture laden air to deposit large amounts of snow in that season.
Because it is cold enough to do so.
“Vinter was wrong”
Yup. Just like all global warming predictors. Then when proven wrong, warmists just move the goal posts. Best example, changing the term “global warming” to “climate change.”
Steven,
“The IPCC sees a loss from 7% to 25% (RCP 8.5) …”
The IPCC couldn’t be more wrong if they tried and to be sure, they’re trying very hard. All of their ‘predictions’ are based on an ECS that has absolutely no support from the laws of physics, and in fact, the entire range from 0.4C to 1.2C per w/m^2 can be precluded by those laws. The completely bogus RCP 8.5 scenario is derived from the high end of the wildly incorrect range of the IPCC’s ECS.
If you don’t think the IPCC is wrong as I say it is, then you must be able to answer the following questions with support from laws of physics that I am unaware of and that have the power to override COE and/or the SB Law, specifically, by changing the exponent in the T^4 relationship between temperature and W/m^2:
How can the planet distinguish the next Joule from the Sun from all the others arriving at the same time, such that the next W/m^2 contributes 4.3 W/m^2 to the net surface emissions (corresponding to an 0.8C increase), while all the others arriving at the same time contribute only 1.62 W/m^2 to the net surface emissions?
Do you really believe that a 1 W/m^2 decrease at TOA caused by incremental absorption can be 3-4 times more powerful on a Joule by Joule basis at warming the surface than a 1 W/m^2 increase from the Sun?
In fact, it’s easy to show how an instantaneous decrease of 1 W/m^2 at TOA (which is what the IPCC specifies) is actually half as powerful at warming the surface then 1 W/m^2 more from the Sun since in the steady state, about half of the incremental absorption by the atmosphere will ultimately be emitted into space and only half can contribute to warming the surface.
To be sure, I expect crickets because any answer you could come up with will make you look like someone who has no grasp of basic physics, but then again, so will a lack of response. As silly as it sounds, it seems to me that you don’t understand that 1 Watt is 1 Joule per second and that all Joules are equivalent at warming the surface. This is something taught in any first semester physics course which I presume you have taken, but have perhaps forgotten.
I suspect that the real disconnect is that you have no conceptual grasp of Bode’s feedback analysis that was misapplied to the climate, first by Hansen, then by Schlesinger and whose errors have since been canonized in IPCC reports since AR1. You need to understand that the 620 mw/m^2 per W/m^2 of forcing is all that is that can be considered ‘feedback’ power and that the 3.3 W/m^2 of feedback per W/m^2 of forcing required by the IPCC is unconditionally incorrect.
So there is little prospect of serious
cooling going forward?
“…As for Europe?, again IPCC
germany winter season?, expect a small increase in precipitation ( a couple of mm)
chapter 14…”
You cite the IPCC for Europe and Germany. The Alps are not the entirety of either, nor are they entirely in Germany (as the headline notes for this storm…Austria).
Plenty of articles and papers specifically have made claims about the Alps.
Try harder.
Mosher you confirm what everyone always knew:
you do not know what you are talking about.
I keep reading that AGW is resulting in more El Ninos, which put more H20 in the air, which will result in more snow. That is why the Alps are inundated.
We don’t suffer from AGW – or El Nino effects – here in Reno. The locals tell me that we used to get 12′ – 15′ of snow in just one fall every year. Now we get excited if we get 6 inches. Hasn’t happened in the last two years. Back then, that amount of snow would get them out of school for up to 3 days at a time.
All of us at the bar were a little depressed that we will never see that amount of rain again unless we can get AGW back to where it was in the 40’s.
I just checked the Reno Gazette Journal. The most snow ever recorded was 22.5 inches on January 17, 1916. That month they recorded the most snow in a month: 66 inches.
Somewhat short of 12 – 15 feet. People are full of $#!7. But they are firm believers in AGW! Shows the power of anecdotal evidence. Same value as what comes from the mouth of climate scientists like Viner.
OK – so it went a bit too far East – it just needs a little tweak – a little nip and tuck…
But the Europeans need this lesson too…
https://wattsupwiththat.com/2018/11/17/will-the-snowiest-decade-continue/#comment-2521702
Fair warning: I’m calling down another very hard winter on the US Northeast, extending up into Canada.
The reason I’m doing this is that you deserve it. You continue to bleat about global warming, in a world that is about to get colder.
You continue to blather on about climate change and the need to eliminate fossil fuels – do that tomorrow and most of you will be dead within a month or two.
Fully 85% of global primary energy is fossil fuels and that number has not changed significantly in decades. Fossil fuel energy provides almost everything you need to survive in this complex world. It IS that simple!
So enjoy the bitter cold and snow this winter, good people, and maybe you will actually learn something.
Cold kills far more people then heat in the world today, probably about 2 million excess winter deaths per year.
Bundle up!
“Fully 85% of global primary energy is fossil fuels and that number has not changed significantly in decades. Fossil fuel energy provides almost everything you need to survive in this complex world. It IS that simple!”
Petroleum and other forms of stored ancient solar energy collectively called fossil fuels makes the entire modern technological world possible. Sure, we could plant and harvest some crops but we only be trading one problem for another set of problems.
I’m only 50 years into this alive thing and I haven’t noticed shift in temperature; hot in summer, cold in winter, but I fly a lot for work and have noticed how much greener the planet is.
Mosher quote: “please dont get your science from one dude“.
Sorry, Mosh, but people do. After that headline news from a respected scientist, in a respected newspaper (and repeated in the formerly-respected BBC), what airport manager is going to invest in the $30 million of new snow-clearing equipment that the airport desperately needs?
Any manager ‘wasting’ so much money on non-existsnt snow would be pilloried in the press, and lose their job in an instant. Try explaining that employment gaffe to the wife and kids. The result was that no equipment was purchased.
And the long-term result was that ten years later Heathrow was paralysed by snow and closed for three full days, causing hundred(s) of million(s) dollars or more in airport and airline losses. The only people laughing were the local hotels, who I am sure paid Dr David Viner to make his stupid assertion about no snow.
And this was not an isolated incident. Local councils up and down the country also failed to invest in new snow clearing equipment, and so our road and rail networks all ground to a halt.
An entire nation paralysed by one deranged scientist….! Think about it – lSlS could not have done more damage to the UK economy if they tried. So who is paying Dr Viner and the CRU?
And did the CRU ever repay UK plc for the damage they caused? No, they just went on to make even more absurd and unsubstantiated assertions about dire climate change – when the reality of ‘warming’ (what there is of it) is that the number of destructive weather events is DECREASING, not increasing.
Number of strong tornadoes have been DECREASING for 65 years.

R
I have to add a little extra there:-
What I am reading I don’t like, because people can end up dead for very simple ordinary stuff.
It’s when all the holes in the gruyere cheese line up, at which point man is no longer in control.
I keep saying this.
365/24/24 Risk management is based around WHAT IF, (& btw, they still get it wrong).
Proper risk management involves spending a little more, JUST IN CASE.
“Any manager ‘wasting’ so much money on non-existsnt snow would be pilloried in the press, and lose their job in an instant. …The result was that no equipment was purchased.
…ten years later Heathrow was paralysed by snow and closed for three full days, causing hundred(s) of million(s) dollars or more in airport and airline losses. ….
And this was not an isolated incident. Local councils up and down the country also failed to invest in new snow clearing equipment, and so our road and rail networks all ground to a halt.”
ALL AVOIDABLE
I have to add the case of the flooding of the somerset levels, which was nothing to do with “climate change”. it was simply the incompetent environment agency and the greenies looking after their “rare species” clap trap.
They SOLD OFF the equipment at knocked down price which was supposed to dredge the water courses and prevent flooding…WTF!
On the basis that “the earth is getting warmer init!”, so no chance of any flooding…
AVOIDABLE
IDEM British Airways wanted to “save money” outsourcing their services to “cheaper” asian sub contractors, so that when their so called ultra secure server farm went “tits up” cos of a simple power supply problem. Total chaos and paralysis….
AVOIDABLE.
What I can’t stand about this sort of smarmy self satisfied – “we can solve everything so easy: attitude and then you climate deniers are all stupid”, is actually INCREASING the level of risk, to an unacceptable area of total outages, catastrophes of all kinds, and dead bodies lying in crashed planes….
(remember the AF447 / Boeing JT610 Pitot tubes catastrophes or other faults.)
ALL AVOIDABLE
Pigs in space. Did it ever occur to you that the calamitys you refer to were intentions of the people that caused them and not necessarily just for financial gain. There are people out there that want our civilization to collapse for many different reasons. The people that want to bring about a collapse must have the support of the main stream news media.
Agree 100% it’s the corollary of no one got sacked for buying Microsoft Windows.
Although I should say a lot of chaos was caused by 99.99% of UK drivers having zero experience of driving in more than a light dusting of snow. During the incident in question a Polish expat I know drove from Derby to Poland without a problem.
Sorry to go on here,-
In our part of the world (and in Switzerland just visible now with everything white today), you will get fined for driving on summer tyres in snow and ice.
If you cause an accident like that, you are treated as having no insurance.
It’s remarkable how quickly that makes people sober up.
I remember 2 or 3 amazing stories about driving in snow in western Europe, both in the UK were beyond pathos.
One was on the way to take someone for their early morning flight in BHX along the M5 in my 30yr old eastern EU spec car. (snow tyres etc).
There was utter chaos with the 2 lanes of the M5 blocked, artics slithering off and jack knifing, police adding to the mayhem…leaving the “fast lane” pretty free and covered in snow.
I have no idea how long that took to sort out..
After a bit of weaving in and out I managed to get clear of this nonsense, and off we went zooming along the fully snowed over 3rd lane as if nothing had happened.
Got his flight no worries…
Same area actually a year or so prior, got stuck in this mother of all traffic jams going out of BRM (again!).
About 3″ of wet snow had fallen (you know the wrong type of snow!).
SUV’s slithering around, even 4x4s utter hopeless unable to get up this slight incline nr Dudley.
This stuff really annoyed me, such that I had to drive all over the places, weaving in and out of vehicles slithering around in all directions, people swearing at me, hooting flashing their lights, who knows what, “road rage on steroids”…who does that foreign registered f..k..r think he is….
Sorry mates..SNOW TYRES.
Such an insult it was to them as if I stuck the middle finger up!
CIAO!
A road ahead totally clear,- no worries.
Point is, if you reduce risk management to the level of, “we can take a shortcut here, or cost a little less there” there is always a big payback some time.
Ah, but of course, people will always blame something else not themselves.
This climate change scam is the perfect example.
We go live in a place prone to hurricanes?
We go live in an area where there’s a very large active volcano?
We go and live in an area where historically there’s been loads of large earthquakes?
Ah, blame it on climate change.
Blame it on the city who allow you to build on the slopes of Vesuvius.
Blame it on Fukushima
NEVER blame it on yourself when the holes in the gruyere line up, and start bleating to the MSM about it all.
I agree entirely with you. However it is very uneconomic for the British to all have snow tyes or chains. We simply do not get snow often enough.
In 1994, I drove NW London to Glencoe in Scotland with snow on the road for about 250 of the 400 miles. No problem, just leave plenty of space to next vehicle and release accelerator rather than slam brakes on. 50mph with snow on the motorway was fine. We left at 10am, were drinking a pint in Glencoe by 8pm.
I have, however, lived in Scotland, Austria and Switzerland and seen proper snow.
Well it’s true that these people are no longer going to know what snow looks like-
https://www.msn.com/en-au/news/world/winter-storm-blasts-europe-13-dead-amid-heavy-snow-gusts/ar-BBS0B3Z
That must be what happens when you reach a tipping point with global warming.
I guess Algor might be right. No children will be around to see the snow because the actions that the CAGW alarmist demand would bring on a war that few would survive.
Funny to see the highly acrobatic BS the high priests of The Church of Climatology will do when confronted with this prediction from a senior “scientist” of the CRU. No wonder why this article was “disapeared” from the original source.
It’s winter in the northern latitudes?
Climate Change! Global Warming! Wolf! The Sky Is Falling! /s
Same old crap. Different year….
[You may not use a one-letter login_id on this site. .mod]
Apologies…. don’t really know why that glitched.
It wasn’t intentional!
https://twitter.com/jojoh888/status/948010508124168193/photo/1?ref_src=twsrc%5Etfw%7Ctwcamp%5Etweetembed%7Ctwterm%5E948010508124168193&ref_url=https%3A%2F%2Fwww.dailywire.com%2Fnews%2F25446%2Fal-gore-global-warming-means-bitter-cold-duh-joseph-curl
Sorry that’s not Al’s boat but it could have been!
Anthropogenic weather attacks!
There was a piece in the papers last week about a French ski resort suffering from a snow shortage (due to….) , I hope they are getting their fair share now.
The town of Whistler, BC, of ski resort fame, recently tried to extort money from energy companies because of a future lack of snow. I guess their FutureCrimes unit is hard at work.
Climate change “predicts” all possible outcomes.
Therefore, Climate change = Junk science.
It really is as simple as that.
Indeed, Joel.
Since anything is still possible, no serious explanation has been provided.
Andrtew
“This has ‘probably one of the worst winters in the Alps for avalanches’ since 1999.” Unprecedented, I tell you. How much more evidence of human-caused climate change do you need?
Just a couple more sharks in those ‘nadoes. That’ll prove it to me.. 😉
So much global warming falling from the sky.
We’re all doomed!
The situation is not as far as dramatic as the msm wants it to be. One of the more down-to-earth weather forecasters and owner of a private forecasting and reporting network, “Kachelmannwetter”, the Swiss Jörg Kachelmann, wrote in a opinionpiece yesterday:
Wir haben Winterwetter, keinen Notstand
We got winter weather, not an emergency
He summarized it: “… the approaching winter is neither something that speaks against climate change, nor the opposite. Although it’s hard to bear up for both sides of hysteria management: sometimes, weather is just weather.
Translation by Google Translate.
https://www.t-online.de/nachrichten/panorama/id_85052278/wetter-joerg-kachelmann-schneefall-in-deutschland-ist-nichts-besonderes.html
Look what they did to Kachelmann a few years ago when he made such horribly offensive counterproductive divisive remarks about typically normal weather. And that was before fake news hit the windshield.
By the way I know Gries (photo above is from 2015) and that is normal. Road to Kuetai above is likely closed, again. That’s just around the peak from Oetztal, where Neolithic Oetzi, the glacier man, was found, and that’s a story in itself.
https://m.facebook.com/story.php?story_fbid=1841695102606669&id=100002985918785
Meanwhile, not a million miles away in England, we have had a very mild winter to date, with almost no snow anywhere. In fact, in the south east, you can count the times we have even had an overnight frost on one hand. In addition, we had a dull XMas with the temperature perhaps reaching 6C.
The MSM, of course, blames global warming but their memories appear to be highly selective – it’s all perfectly normal weather at this location at this time of year.
Now, watch out for the hysterical headlines if the cold-inducing parts of the polar vortex system swing our way, as some are predicting, later this month.
High pressure has been centred near the UK for weeks, avoiding the more usual mix of westerly storms and continental cold air from a continental High.
It has now become standard practice to blame each and every weather event on Global Warming caused by CO2 increasing in the atmosphere.
I should qualify this observation.
Only weather events with negative aspects are due to Global Warming. Anything beneficial or helpful such as rain that relieves a period of draught, well, that is just normal weather. But remember, that draught that was Global Warming. If the rain continues to fall and turns into a flood event well that then becomes Global Warming.
When is the AGW movement going to realise, no one outside their own religion, believes anything they say any more?
My guess. 20 years. This will go away before 2060, I guess by 2040. But also, we will have about 1.5K warming by then.
Here’s one to watch. It’s all going to happen by 2050 apparently. Yawn…
So wake me up for the snowpocalypse.
https://www.telegraph.co.uk/news/worldnews/europe/austria/1448390/Global-warming-could-close-half-of-Alpine-ski-resorts-by-2050.html
You’ve got it all wrong this is hot snow not the cold snow that we used to get, get a grip man.
Not a problem is this after all ‘heads you lose , tails I win ‘ settled sceince.!
And at this stage it is worth remembering that to date what would ‘disprove ‘ AGW remains a mystery given AGW proponents seem unable to answer that question.
Not unable to answer it, just keep moving the goalposts to keep the moola flowing. Such as I predict there will be a minimum of 30 new papers this year on global warming spouting many animals “could, might, may, possibly” be affected but no absolute determination made on when anything “will” happen.
Freezing cold Germany needs more Russian gas to keep warm; Vlad Putin is laughing all the way to the Gazprombank.
“Deadly Snowfall” in Germany 52°N 9°E on 2019-01-09 at noon.
http://i67.tinypic.com/30227sz.jpg
That’s the deadly snow.
That is not a picture from anywhere in Bavaria or Austria. No snow, that is how I can tell.
So what relevance is to show how it is somewhere else???
Back to reality, still snow, wider area.
https://www.wetter.de/cms/regen-und-wolkenfilm-fuer-zwei-tage-10-01-2019-schnee-und-regen-bringen-eine-gefaehrliche-lage-4276181.html
Regen- und Wolkenfilm für zwei Tage (10.01.2019): Schnee und Regen bringen eine gefährliche Lage
10. Januar 2019 um 15:56 Uhr
In den Alpen bleibt der Schnee hängen
In den Alpen bleibt der Schnee hängen
Der Regen- und Wolkenfilm für 48 Stunden
https://www.wetter.de/videos/in-den-alpen-bleibt-der-schnee-haengen-5c3692c6a2ea50566c264cd5.html
Schneefälle ziehen sich an die Alpen zurück
In der Nacht auf Freitag ist es von Oberschwaben bis zum Bayerischen Wald sowie im Erzgebirge wolkenreich, es fällt weiterer Schnee und es wird glatt. In der zweiten Nachthälfte lassen die Niederschläge nach und es besteht erhöhte Nebelneigung. Aus Nordwesten kommen dichte Wolken, Niederschlag breitet sich südostwärts aus, anfangs meist als Schnee. Später und gegen Morgen lassen die Niederschläge von der Deutschen Bucht nach. Es kann glatt werden. Tiefstwerte +3 Grad auf Sylt und Borkum, rund -3 Grad im Raum Leipzig bis -9 Grad in Oberstdorf.
Am Freitag gibt es an den Alpen auch mal heitere Abschnitte! Wow. In Süddeutschland bleibt es zunächst weitgehend trocken, vom Saarland bis nach Sachsen fällt noch zeitweise Schneefall – Glätte. Von Nordrhein-Westfalen, Nordhessen, Südniedersachsen und dem südlichen Sachsen-Anhalt geht der Schnee in Regen über, weiter nördlich gibt es höchstens etwas Regen oder Sprühregen. Nachmittags nach Süden vorankommender Schneefall, der bis zum Abend den Alpenrand erreichen. In Küstennähe sind Auflockerungen möglich. Höchstwerte -4 Grad in Fischen im Allgäu, +3 Grad in der Niederlausitz und der westlichen Pfalz bis +9 Grad im Emsland.
Weitere Niederschläge, oft als Regen, höher als Schnee
In der Nacht zum Samstag vom südlichen Niedersachsen bis zur Lausitz sowie südlich davon abziehende Niederschläge. Im Süden und Südosten gehen diese meist als Schnee nieder, sonst als Regen oder Nieselregen. Im Nordosten sehen wir einige größere Auflockerungen, teils aufklarend und trocken, später aber kommen von Nordwesten her wieder verbreitet dichte Wolken auf, die einzelne Schauer bringen. Von Nordwest nach Südost wird es +6 bis -5 Grad warm oder kalt.
Am Samstag bleibt es weiterhin wolkenverhangen. Nach einzelnen Schauern kommen von Nordwesten her verbreitet neue Niederschläge auf, in der Nordhälfte Regen, der auch kräftig sein kann. Nach Südosten hin gibt es erst Schnee oder Schneeregen, später trocknet es aber etwas ab. Höchstwerte von 0 bis 7 Grad.
Informationen zum Wolken- und Regenfilm
Der Wolken- und Regenfilm zeigt einerseits die Temperaturentwicklung für die größten Städte in Deutschland und in den angrenzenden Ländern an. Andererseits werden, wenn vorhanden, Wolken-, Regen-, oder Schneegebiete angezeigt.
Der Wolken- und Regenfilm wird zweimal am Tag neu produziert und wird für die nächsten 48 Stunden angezeigt.
(mehr dazu bei wetter.de)
It shows that this phenomenon is
a) a phenomenon -and not even that- and
b) “…Deadly Snowfall to Germany and Austria…” is completely overselling that matter.
Only a very limited part of Germany is covered with snow, the larger part, as I see it, is snow-free.
In times not so long gone by and which I do remember pretty well, that what we see today has been a normal winter. And because it was considered normal or near normal, everybody was prepared much better, be it the RR system or the Autobahn or just the schoolbuses.
But since MSM finds enormous pleasure in exaggerating even a moderate assembly of snowflakes, such a normal winter is marketed a dangerous consequence of AGW, which it is not.
Non Nomen – how do you know it’s not?
Because it is a normal winter.
Just for the sake of the argument:
If this is a normal winter, where is the evidence that AGW caused this regularity?.
If this is not a normal winter, where is the evidence that AGW caused this irregularity?
We’d better get used to the idea again that weather is just weather and not a series of everyday catastrophies caused by AGW aka Climate Change ramped up by msm for the sake of making profit out of every kind of
shitnonsense.Non Nomen – With the slight bit of warming there’s been since planetary wave data has begun to be gathered we’re looking for shifts and elongations in that wave pattern, which forms and sustains regional climates. We’ve been seeing them since 2011. It might be the sudden stratospheric warming episodes, we’ve seen them for a few winters as the sun has quieted, but it’s more likely that it’s the increasing energy of the atmospheric circulation – which would be more difficult to identify. So you’re right, we don’t know what normal is anymore.
You deniers. tsk, tsk.
Its a fact that Viner got his prediction 100% right. ‘Our Children will not know what snow is..’ etc.
Its just that he used the wrong sensitivity. If he used todays sensitivity, he would have been saying ‘our children will be under ten feet of snow’
therefore what he said was correct
Can you guess why the predictions are always about the year 2100.
Ask a climate scientist to give you the prediction for 3 years from now correct to the 3rd decimal place they insist they can do. In 3 years time you will know whether they are lying or not with 100% certainty.
The mini ice age starts here
Exactly 10 years old not so bad article worth to read.
“
The “Dude” would be the IPCC. You should be familar with the process of a literature review.
So you have 10 studies on snow, you review them all. You look to see if any have been refuted. You compile a “consensus” opinion. 8 of the papers indicated medium snow loss,
1 said no loss and 1 said a small gain, but the one that argued for a small gain, was only focused on one country” You write up a summary, people object to your summary, you
rewrite. This is a consensus view. It’s NOT science, as the IPCC doesnt do science, but its
the expert assesment of all the relevant science published to date.”
–
I love this sort of science
“It’s NOT science, as the IPCC doesnt do science, but its
the expert assesment of all the relevant science published to date.”
So an expert assessment of all the relevant science is not science.
Increasing the temperature causes increased snow.
RCP projections must not be taken literally because, literally, they are not predictions.
The models are not wrong, observational reality just fails to match them.
Adjusting temps upwards is science but debating it is not.
Pretzel science.
“I love this sort of science
“It’s NOT science, as the IPCC doesnt do science, but its
the expert assesment of all the relevant science published to date.”
So an expert assessment of all the relevant science is not science.
Increasing the temperature causes increased snow.
RCP projections must not be taken literally because, literally, they are not predictions.
The models are not wrong, observational reality just fails to match them.
Adjusting temps upwards is science but debating it is not.
Pretzel science.”
#############################
“”I love this sort of science
“It’s NOT science, as the IPCC doesnt do science, but its
the expert assesment of all the relevant science published to date.”
So an expert assessment of all the relevant science is not science.”
Precisely. exactly. It is a consensus ( duh) and that’s not science.
Doctor A gives you diagnosis A. he is doing medicine
Doctor B gives you diagnosis B. he is doing medicine.
Doctor C gives you diagnosis B. she is doing medicine.
Your family considers all three. Their considered judgement is that Doctor B and
C are correct. They write down their assesment “angech is mentally ill” This assesment
is Not doing medicine.
get it?
Scientist A does an experiment. he shows X
Scientist B repeats his experiment, he shows X
Scientist C, repeats the experiment, he CANT show X.
All three are doing science.
Your boss asks you to review the evidence for X. You read their science.
you notice that Scientist C, made some subtle changes to the experiment.
You tell your boss. I reviweed the evidence. I am confident there is evidence for X,
however, there may be a issue with some circumstances and we need to address that.
YOU, are not doing science. If you had a team of people reviewing the science, that
would still be an assesment, and not science.
angech..
“Increasing the temperature causes increased snow.”
This take extra effort on your part to misunderstand.
First.
https://ibb.co/1byYMnh
Second
https://ibb.co/848DVbP
Third
https://ibb.co/jHBG2my
Well they simply ignore the majority of serious research on MWP. More than 100+ and counting. As warm or warmer than today. And it is global, both hemispheres, many studies.
Contra are the handfull of papers by Mann et al. (etc) junk. All refuted again and again (refutations published despite insidious contra opposition). And they all used a lot of the same garbage data and approaches. So really all just the same.
So what does IPPC do? They ignore the 100+ and just quote from the already disproved handful. To pad the number people then quote ‘other’ research, but when you look closely that is either neutral, more plagiarized junk or even against.
If they really did what Mosher says the do then the ECS/TCS lower estimates would be slashed in half at least and the max put to the current lowest IPPC estimate.
Fake science. What a joke.
Some folks would seem to to have Cause & Effect ‘problems’
The Guy said ‘ No More Snow. Climate models predict it. Scientists say so’
OK
So a load of people wanting to get in a bit of skiing before it all dries up, went skiing. Safe in the very expensively-obtained scientific knowledge that they’d be safe from excess snowfall- such a thing was on the decline and less risky than in previous/years/decades times.
But then it snowed. Heavily.
And the Trusting People got hurt.
Now then, if an electric utility can be found guilty of murder for burning your house down – *after* the people actually asked the utility to bring electricity and hence surely knew the risks – what are climate scientists guilty of when they suggest it is now safe to venture into live & dangerous minefields.
Now we understand now why Climate Science is protesting innocence so strongly..
The Human Animal cannot, in the long term, get away with mendacity. They *know* they are wrong and don’t understand ‘climate’ but cannot admit it.
BUT: such is the beauty of the sugar/alcohol/cannabis diet – The Chemical will *always* deliver an Endorphin Reward, no matter *what* you spend your day saying & doing.
Even happier times are ensured when The Buck can be passed to an Invincible Authority – The Computer.
What can the hapless punter/skier do against such power?
(Apart from pay tax, be ruled regulated controlled fined hectored badgered stressed monitored recorded into mental instability (50%+ of the womenfolk not least) and die. In the form of a nappy-wearing physical and mental cabbage.)
Personally, I assert that to be Unreasonable Behaviour…….. see you in the divorce court.
And even better, the brain-bending and nutrient-free diet trashes memory – grown adults really do return to early childhood.
I do declare, “Things have never been better”
(If you’re into Junk that is. Junk Everything – science and food not least – one perpetuates the other and both create deserts. Where it snows, check out Saguaro Park just recently)
Get the drift – The Trust has gone.
Not just in science, politics too, witness Brexit and populism in general.
Where did the trust go – literally down the toilet with all that Nutritious Fibre we’re told, by scientists, to eat.
It would be interesting to know what German wind/solar production was during this time.
I found this link which displays historical production data for wind and solar, but I don’t think it’s for all of Germany. Click on “Nominal Range: Month” or “Year” to expand the time range. You can also move the sliders on the panel underneath to zoom in on any period you want. The annual curve for solar PV is what you would expect, but there are periods of abnormally low output. Wind is considerably more variable; going from several peak days of 1.3 GW to extended periods of a week or more when production seldom goes above 50 MW.
In northern Germany they had a blackout this morning, it’s said, a link to Denmark was broken.
Source, in German
Not that they have windmills around….
They didn’t use to need any link to Denmark. That’s probably Norwegian electra. Now they do need it…
On other news: the A61 has been reconstructed to move in a weird way around a NEW BROWN COAL mine in NRW of all places. Not East Germany (which has been weaned off from that polluting stuff), that’s as West German as you can go. Near Koln I understand LOL.
I drove over the A3 for first time in years to Austria. Not going to do 30/50 miles extra (over the A61) because some moron closed all normal coal mines AND then decided on Wind (…) AND then closed all nuclear facilities AND then thought wooops, too little electra, so yeah let’s do BROWN COAL. Morons.
Bad Science, Stupid Politicians.
I would hope those people have at least some University education of something that actually matters. But no. None of them do. Alpha’s (Law, Languages and other crap) and others of the great unwashed, C minus people.
Here is your tool to play around: Agorameter: Power Production and consumptoin in Germany. You can compare days up to whole years. Also prices and lots of other data.
https://www.agora-energiewende.de/service/agorameter/chart/power_generation/09.12.2018/09.01.2019/
Very useful Johannes; thank you. I must remember to bookmark this.
Translations:
Konv. Kraftwerke = Conventional (fossil fuel) power generation. From playing with the graph this appears to be the sum of coal, natural gas, nuclear, pumped hydro (but not conventional hydro) and “other”.
Wasserkraft = hydro power
Stromverbrauch = power consumption
Steinkohle = hard coal (bituminous?)
Braunkohle = brown coal
Kernenergie = nuclear
Pumpspeicher = pumped hydro
Erdgas = natural gas
Andere = other
You can also graph CO2 emissions in grams / KWh, which no doubt simply reflects the relative mix of generation sources.
Snow is not a proxy for anomalous cold.
In fact Austria is not particularly against the 1971 to 2000 average.
The snow is affecting the mountains (tends to be common in winter).
Here’s the clue .. “Ski resorts in the Austrian Alps reported up to seven feet of snow”
Ski and mountains.
There has been a series of cold Arctic plunges there, which on hitting the Alps, cause ascent, cooling and snowfall.
Meanwhile the southern alps have been sheltered and thus snowless.
Weather.
https://en.sat24.com/en
Anthony
Sorry, but it is not just affecting the ski resorts.
Arriving in very low Salzburg airport last Saturday we travelled to our very low spa resort in a blizzard. It has snowed off and on since then. As of Wednesday evening it is falling faster than ever. Probably around two feet in total over last few days. Anything above 700 metres requires snow chains.
Very low Munich airport and surrounds has been very badly affected.
Tonyb
Jörg Kachelmann, Kachelmannwetter
This ist the deadly snow at ~ 52° N 9° E: http://i67.tinypic.com/30227sz.jpg
Once again, where are the electric snowplows and electric rescue vehicles. Macron should be forced to dig out the bodies of the avalanche victims.
The constant drum beat of policy directed against warming is the exact opposite of what is needed in periods of (natural) cyclical cooling. The victims are starting to pile up now.
Pigs in space – read this morning (can’t recall where) that refugee camps
Lebanon are buried in snow.
Many of the unfortunate people are freezing to death.
The UN refugee bod in charge said ” Its global warming”
Say no more or does Mr Mosher agree with that prognosis?
“Many of the unfortunate people are freezing to death.
The UN refugee bod in charge said ” Its global warming”
Say no more or does Mr Mosher agree with that prognosis?”
Well, there you go again.
Didn’t I just explain to you not to get your science from a dude?
How can I make this ANYMORE clear. dont get your science from a dude.
1. Don’t get your science from the MSM
2. Don’t get your science from dudes who have a blog or twitter or instagram. like me
3. Single event attribution is not my field. I suspend judgment on these types of questions
unless I am forced to make a decision that is critical to something I am working on.
4. Check Ar5? do you see his claim there? Nope? ok, ignore it, go read the comics.
If they are freezing to death I would not say it’s global warming, I’d say it’s poor fashion choice.
Or most likely I would just ignore the claim. It’s not important to form an opinion about it.
Mr Mosher,
Thank you for your reply.
I can assure you I do not ‘take’ my weather knowledge from any fake MSM.
I do actually have some background and knowledge about basic botany, weather forecasting and basic science.
As a fellow Catholic, I am disappointed at your rather snide dismissal of the plight of thousands of (mainly) Christian refugees suffering severe cold weather conditions. After all they are fleeing the slaughter inflicted upon those in the middle east who have not submitted to the “religion of peace”
To call it “a poor fashion choice” in beneath contempt in my opinion.
The main point I was making was the UN refugee head Honcho blaming the ubiquitous global warming for their suffering.
wrong steven mosher.
thats steven W Mosher
I’m Steven M
many others have confused the 2
Here is a special treat for you all
Samuri Suggested the following
##########################
Steve-san:
Here is the empircal evidence showing both 30-year and 49-year trends for Northern Hemisphere Snow Extents are increasing:
If you have empirical evidence (not climate model BS) showing decreasing snow Extent trends, post it.
Ciao.
########################################
Now a while ago our old friend Tiny Heller was on twitter pushing these charts about snow.
Here is what I love about skeptics! If Mann had posted any chart, ya’ll would be digginmg through the details.
But, when you see a chart that shows something you believe in? Why crap, all your skepticism flies out the window and you repost that shit without checking
So, I made up a little script for Samuri.. to show ALL the data. I fixed it up a little for him because december 2018 data is now in
So the first thing you have to gronk is that the rudgers data has missing months
https://ibb.co/LnVLCtq
If we want annual data it looks like this for the average snow extent per year.
Three sets here: 1966 to present; 1972 to present ( get rid of the years with missing data)
and 1988 to present, cherry pie.
https://ibb.co/VT60RQn
https://ibb.co/jHBG2my
https://ibb.co/BfY98r4
See? if you hunt for data where the snow goes up, You can find it!
What else do we see?
Short story:
A) in a time of warming you can see an INCREASE of snow falling in the fall and winter
Snow requires 2 things at least. The right temperature and the righ tamount of moisture in the
air.
B) In the spring and summer warmer weather kinda helps to melt snow. duh.
Here’s all the charts for folks interested in all the data.
https://ibb.co/42LgvLF
https://ibb.co/1byYMnh
https://ibb.co/YQn2WTW
https://ibb.co/jkwCrzy
https://ibb.co/KD8tY5D
https://ibb.co/848DVbP
https://ibb.co/XVz51zf
https://ibb.co/5rZr8BM
https://ibb.co/LnVLCtq
https://ibb.co/9njsxfC
https://ibb.co/RjbD4St
https://ibb.co/HXGmp7G
Years ago when I heard these predictions by climatologist that there would be less snow I was surprised. More warming means more energy in the wave patterns so why would there be less snow? Then I thought well maybe they’re actually thinking about centuries from now when the planet warms enough to make snow very rare except above the Arctic Circle. But then I thought how could they be thinking like that and saying that we’ll see the end of snow? Are they just being over enthusiastic about their theory and not thinking in practical terms?
I’ve met a few climatologists and they don’t seem to have a lot of experience looking at daily weather charts, season after season. They’re like physicists who want to formulate ideas from very small scale views.
When did you start in the field? Did you ever expect to find confirmations in your working lifetime?
started in 2007.
as a hobby.
confirmations? for what I do? not sure.
Thanks Steven –
Take these quick comments as something to think about. What does the future hold? It’s not all bad if it would stay like this.
Since 2011 seasonal onsets have been delayed as indicated by the wave pattern at 300mbs.
The autumn turnover has been delayed by a few weeks which is bad due to warmer conditions and more jet stream energy far enough south for late hurricanes. Hurricane Sandy was a late one, which was allowed by the warmth to thread the needle up the coast. That got peoples’ attention.
The spring turnover has been delayed by a month. This delays the setup in tornado alley and then luckily TX OK are quickly skipped over.
Cold winter weather in the storm tracks as been delayed about a month also. Same again this year.
Many thoughtful points made on this thread by multiple authors… and agree on the Steve quality factor. Thanks.
Have been thinking what JSnook said.
You are welcome James,
I have some spare time and using the computer for posting makes it easier to post at length.
Thanks for your time. Very informative. Hope it continues!
Agree. Many folks here try very hard to disagree with Steve Mosher. Partly it’s his acid sense of humor. Seems to me however, he’s close to being Judith Curry’s soulmate.
We can all learn more about being a good skeptic.
some complain about my “base” humor.
Hmm, I’m probably closer to Judiths position than many people think
heck we are co authors.
But I am critical of some of her weird attacks on data.
Really? Like what?
Steven, not familiar with the code (as above, in the earlier post to Sam) . . . looks like R maybe? Did you do this with a certain compiler and if so which one?
Thanks.
Germany sucessfully has combated Global Warming. According to some High Priests of the Green Order ist was necessary to install Wind Wheels, driven by Coal Power, to chop some birds as a sacrifice. No need to slaughter virgins. Very convenient.
Now, as the windwheels have blown away Bad Global Warming, methinks we have to demolish some of the windmills, to reduce the snow.
As our beloved Kanzlerette Mommy Angie says: “Wir schaffen das!” and “Alles unter Kontrolle!”
From the article: “This system was reportedly named Storm Zeetje”
“Storm Zeetje” is right at the end of the alphabet. Does that mean there were 26 storm fronts in their area for 2018?
I sure hope my local meteorologists don’t start calling our thunderstorms by a stupid name. We do just fine without naming them. How about numbering them instead? How about just leaving well enough alone?
How much time is wasted sitting around deciding what to name the next thunderstorm? Where the heck did they come up with “Zeetje” anyway? Is that a common name where they come from? Sheesh!
Zeetje is a feminine first name you may find everywhere
as shown here
*very explicit palmface*
Yes absolutely, snow is a thing of the past, big oil companies have secretly rigged up giant freezers suspended on balloons high beyond the clouds and we use de-icing fluid to make our rides undetectable by the alien civilizations chartered to save the earth.
Accessorily, earth is flat and can fit into “spherical cow” climate models.
Thanks for the applause, where’s my tenure / Nobel Prize already ?
Re mosher
**The only folks who seem to have taken it to heart are the skeptics who insist on getting their science from a suspect MSM**
Wrong Steve. The MSM only posts the CAGW exaggerations. Skeptics have to get their science from legitimate blogs.”
Err No.
Read the science papers.
If you dont undrstand them, then suspend judgement.
that is what real skeptics do.
Steven nice deflection, he said MSM not science papers, hmm about those science papers!
Steven you quote IPCC, I missed the part where IPCC looks at all climatic influences and not just anthropogenic.
Steven you don’t do projections, well thats a safe hide.
Steven you don’t do sea level, well another safe hide.
Steven said
“Now, one practical reason you don’t want me doing that forecast work is because of the potential for self interested decisions Having the same person doing the forecast and collecting the data? recipe for bad things.”
Wow thank you Steven, is that not what skeptics have been pointing out all along about adjusted data.
“Read the science papers.
If you dont undrstand them, then suspend judgement.
that is what real skeptics do.
Steven nice deflection, he said MSM not science papers, hmm about those science papers!”
##############################################
MSM? they always suspend judgment. duh.
###########
Steven you quote IPCC, I missed the part where IPCC looks at all climatic influences and not just anthropogenic.
Chapter 14, duh.
####################
Steven you don’t do projections, well thats a safe hide.
No thats a job description.
Steven you don’t do sea level, well another safe hide.
Nope, that’s a job description. Let me put it to you this way. After about 10 years
of working on temperature, I feel pretty confident that I won’t make horrible mistakes.
Sea level rise? Not gunna change my field, unless you pay me.
“Steven said
“Now, one practical reason you don’t want me doing that forecast work is because of the potential for self interested decisions Having the same person doing the forecast and collecting the data? recipe for bad things.”
Wow thank you Steven, is that not what skeptics have been pointing out all along about adjusted data.”
A.) No not really. If you look at the aunadjusted data it shows MORE WARMING than unadjusted.
B) With adjusting data, the prospect for fiddling is avoided by several means
1. Different groups using different approaches
2. Using algorithms as opposed to human choices
3. Double blind testing the algorithms.
C) For the most part skeptics have been completely wrong about adjustments, presenting
half truths and partila truths and sadly NEVER looking at the actual code.
Looks like he was given some different meds as a Christmas present.
Thanks micheal for that classic ad hom.
Just when I thought I’d heard the most devastating personal attacks, you pop up
with a a rote one.
Now back to the data.
See the charts for winter month?
See the charts for Spring and summer?
See the annual
care to comment on the data?
Thought not.
Actually, Steven, I will briefly. (Well done, you guessed who I was talking about.)
Up-thread you instructed someone to go and read IPCC AR5, as if this was something to be proud of.
“read AR5
Thats the summary of the best science. If you want more, dig down into the bibliography
and get the actual papers. Still not satified, dig deeper.”
A while ago I did go to AR5 and started by reading a part of it I consider to be closes to my own scientific training.
When, speaking from memory, I read that carbonic acid (formed from water and carbon dioxide) was “highly acidic”, i felt like punching my fist through my computer screen.
A lot more than 97% of chemists would be very surprised by this statement. It is clearly written by somebody who either
a) Has no knowledge of chemistry
b) Is a very dishonest chemist seeking to deceive those less knowledgeable in chemistry, or
c) Both
To cut a long story short, I already had good reason to believe that the IPCC was a primarily political organization, populated with many people who had long since abandoned any scientific principles they may ever have held in favor of political activism, and this confirmed it. If this is the level of scientific discourse that you would direct people to to, then you should be ashamed of yourself.
Also, you are quite fond at generalized ad-hom swipes at skeptics, which is allowable, but please spare me any complaining when it comes back round.
What I am willing to do, Steven, is give you credit if you have gone out and read the literature to know the reply/excuse the ‘dishonest chemist’ would give me for taking exception to them describing carbon dioxide and water producing something “highly acidic”
And no, saying “highly acidic” is just a relative term is not the answer.
You’ve clearly read AR5 and supporting references (ho, ho) so should be able to come up with answer very quickly.
Bonus point available.
And for three bonus points, tell me why the answer is something that probably ought to be included in chemical-radiative models of the atmosphere.
“When, speaking from memory, I read that carbonic acid (formed from water and carbon dioxide) was “highly acidic”, i felt like punching my fist through my computer screen.”
Citation please.
Instead of getting emotional ( there are meds) write down the page and reference.
That way you can have an intelligent conversation from fact rather than memory.
Without a citation I reserve judgment on your reaction.
You supply me with the full AR5 report as it was originally documented, and I’ll supply you with the reference. I actually thought it would be easy to go back and examine all of them, going back to the beginning. But they seem to have strangely deleted what was previously easy to find. (I’ve got a retired computer I may try to have a look on).
Now why would honest ‘scientists’ do that?
And although it’s not the first time I have stated that here on WUWT, I’ll reserve judgement on you too. I really hate having to judge people. Poverty has its merits.
“Too much snowfall, so less skiers at Gries,”
less skiers? People with a lower ability to ski? People with only one ski? ‘fewer skiers’. Problem solved.
A lot of spin, little real information. Another Mosher bombed thread.
I see you didnt look at the charts.
It was just the media…
Link
(Note the date range.)
The highest level of avalanche danger applies in the Austrian Alps.
The northern Alps are buried in thick fresh snow, literally meters in some places. The situation is critical in many areas, with extreme avalanche danger. Indeed, a number of fatalities related to avalanches have already been reported. Further episodes of intense snowfall are expected in the second half of week and likely to persist into next week. We take a closer look.
As the synoptic pattern persists, it sustains the meridional flow of Arctic maritime airmass from the north towards the south. Persistent stau-effect snowfall is ongoing. Expect it to persist through Wednesday and Thursday. A pause is expected on Friday and Saturday, with some places not receiving any snow and others experiencing somewhat more moderate snowfall.

http://www.severe-weather.eu/recent-events/no-end-to-the-heavy-snowfall-in-sight-in-austria-and-switzerland-update-on-the-extreme-snowfall-across-the-northern-alps/?fbclid=IwAR0O0WKXJn1sWVEi1i5Vho3kCHCzY5VtXCgSreAOjVGoinD0uxB2co7ktlA
The current pattern of the polar vortex in the middle stratosphere indicates the influx of Arctic air to Europe.
Meanwhile in the Alps… Photo: Sieglinde Hutter
The end of warming in the east of the US.

ren – The models have the steering flow changing back to mild results after this short interruption. Maybe by late January a cold winter will begin in the NE.
Look at the forecast of the polar vortex.
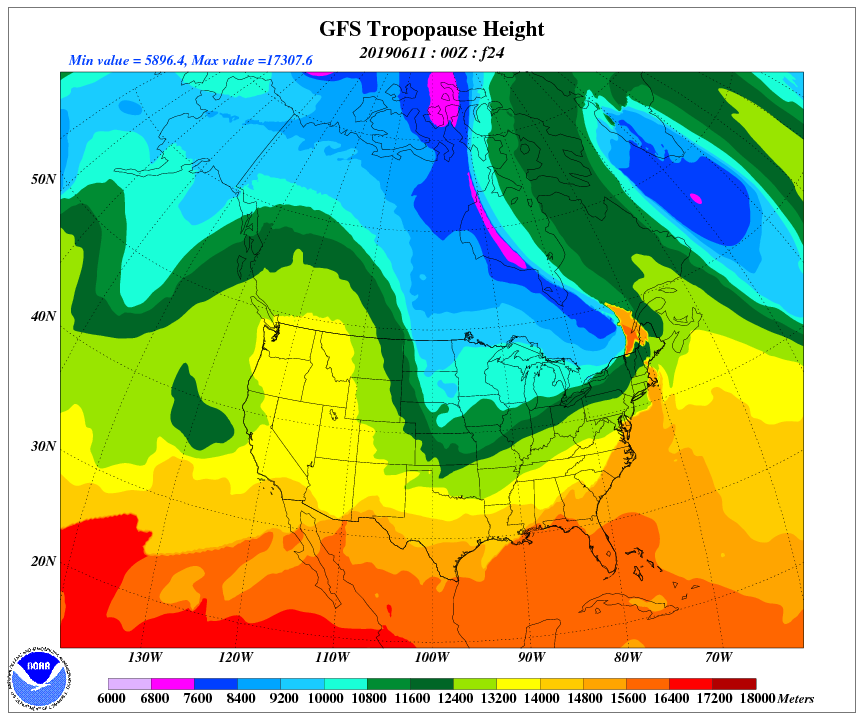
an other nice one
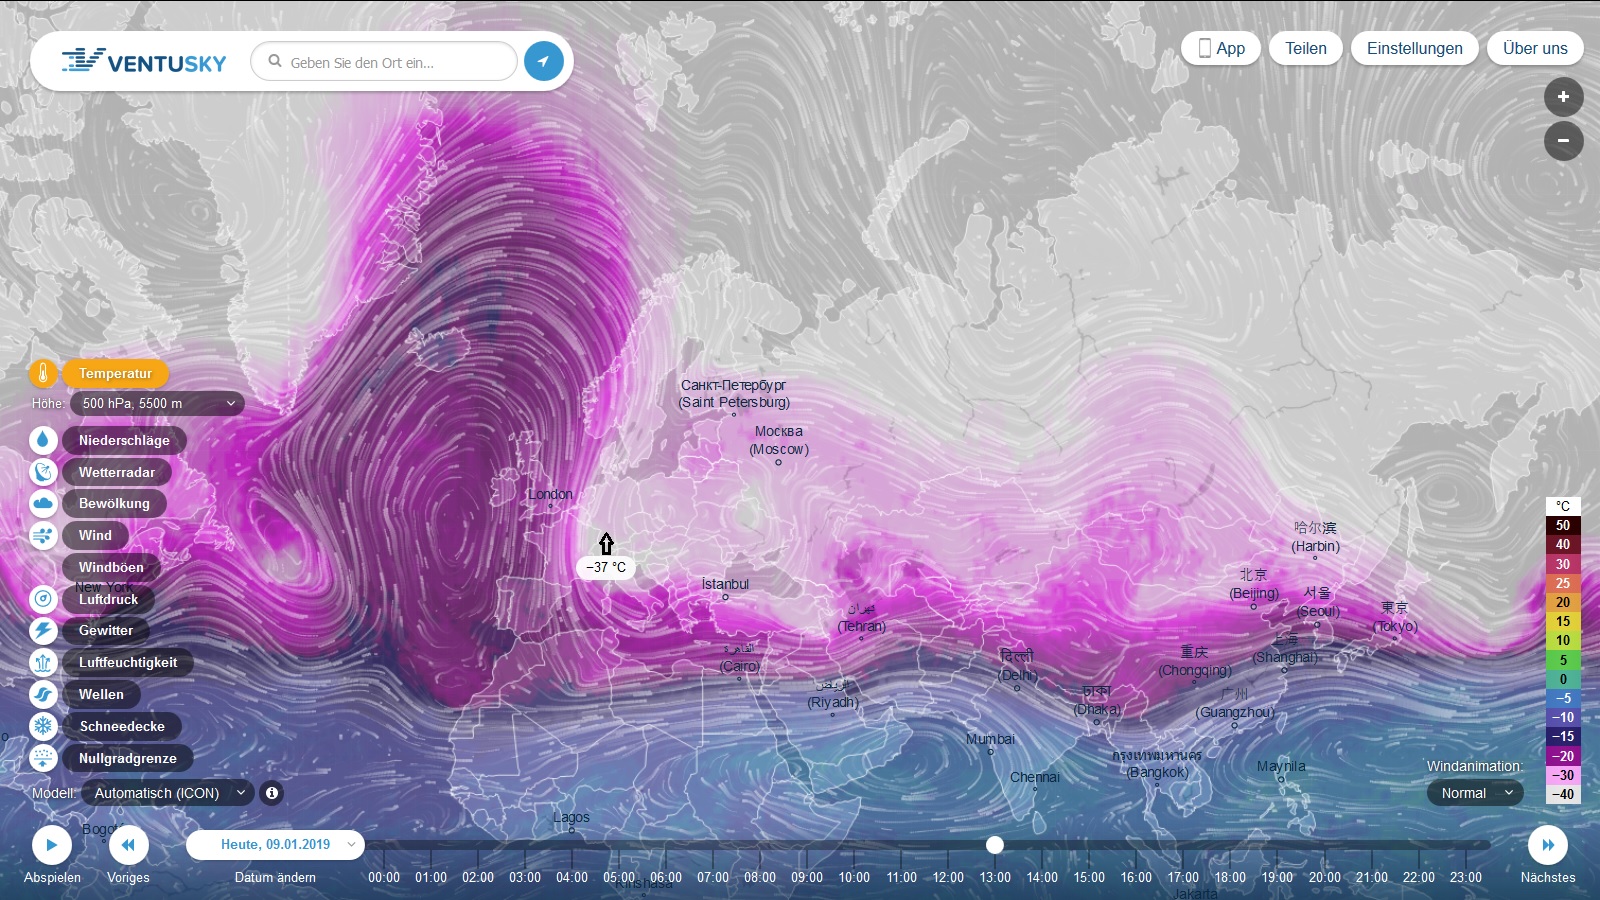
Look at the forecast of the polar vortex in the middle stratosphere.

Minimal solar wind activity.
http://www.solen.info/solar/images/AR_CH_20190108.png
Wasn’t it Loockwood teling us, that strong and cold winters are result of a low sun activity and stroong reduced UV radiation cooling the thermosphere and affecting so the blocking weather events because of polar outbreaks ?
Small chances for El Nino this month.


The Mosher quote: “please dont get your science from one dude“.
Sorry, Mosh, but people do. After that headline news from a respected scientist, in a respected newspaper (and repeated in the formerly-respected BBC), what airport manager is going to invest in the $30 million of new snow-clearing equipment that the airport desperately needs?
Any manager ‘wasting’ so much money on non-existsnt snow would be pilloried in the press, and lose their job in an instant. Try explaining that employment gaffe to the wife and kids. The result was that no equipment was purchased.
And the long-term result was that ten years later Heathrow was paralysed by snow and closed for three full days, causing hundred(s) of million(s) dollars or more in airport and airline losses. The only people laughing were the local hotels, who I am sure paid Dr David Viner to make his stupid assertion about no snow.
And this was not an isolated incident. Local councils up and down the country also failed to invest in new snow clearing equipment, and so our road and rail networks all ground to a halt.
An entire nation paralysed by one deranged scientist….! Think about it – lSlS could not have done more damage to the UK economy if they tried. So who is paying Dr Viner and the CRU?
And did the CRU ever repay UK plc for the damage they caused? No, they just went on to make even more absurd and unsubstantiated assertions about dire climate change – when the reality of ‘warming’ (what there is of it) is that the number of destructive weather events is DECREASING, not increasing.
Number of strong tornadoes have been DECREASING for 65 years.

R
The slight decrease in hurricanes and the big decrease in tornados in TX OK this year is interesting.
Increased wind shear kills a circulation for hurricane formation. I think we’ve see n that, but looking at the case by case for tornados gives us a view of synoptic scale change, much more complicated.
“An entire nation paralysed by one deranged scientist….! Think about it – lSlS could not have done more damage to the UK economy if they tried.”
Stupid brits. Like I said, dont listen to the MSM. Better to buy that plow and be fired.
Interestingly you know the story about snow in chicago?
I lived through this
Much fun
https://www.chicagotribune.com/news/chi-the-blizzard-that-got-jane-byrne-elected-20141114-story.html
The slight decrease in hurricanes and the big decrease in tornados in TX OK this year is interesting.
Increased wind shear kills a circulation for hurricane formation. I think we’ve see n that, but looking at the case by case for tornados gives us a view of synoptic scale change, much more complicated.
Mosher (from above),
I am happy you don’t subscribe to adjectives like unprecedented or dangerous. I am comforted to learn that you don’t subscribe to the incessant fear-mongering which the MSM fires almost daily (which is of course ratcheted up several times leading up to a COP meeting).
That said, you do appear to be attempting to ‘run interference’ for Mainstream Climate Science, at least regarding the dubious claims made at the end of the past century that snow would become a thing of the past [as a result of human beings continuing to combust fossil fuels at a sustained high, or even higher, rate].
As I understand it, your expertise is in compiling global mean surface temperature anomalies. Correct?
My comment was directed at your sense of intellectual curiosity and, by extension, intellectual honesty.
I noted that you agreed with the assessment by the IPCC from a decade or so ago, that over half the observed warming during the latter half of the 20th Century was in fact (now at 95% certainty, if I recall correctly) due to the increased human GHG emissions; at least you said that you could think of no other plausible cause. Do you agree that the accepted range of equilibrium climate sensitivity is still on the order of 1.5-4.5℃ per doubling of CO2? Do you find the 95% certainty above scientifically coherent with the 3-fold range given for climate sensitivity? What are your thoughts on the Hansen et al. 1988 long-term climate projections / scenarios (as a function of human GHG emissions) and how these compare to the actual record (of both human GHG emissions and the global mean surface temperature record over the past three decades?
Apparently you have considered the ‘big picture’, which, if implementing so-called Climate Policy were to gain any traction worldwide, would necessarily need to address the question of ‘effectiveness’, i.e., the success of said policy in achieving its stated goal of stabilizing long-term temperature growth to a maximum of 1.5-2.0℃ (above pre-industrial times).
In this context, I find it curious that you decline to address the apparent lack of a long-term acceleration signal in the Global Mean Sea Level (GMSL) dataset. Do you not have some intellectual curiosity here, or, indeed, a yearning for intellectual honesty?
But on the policy question, namely the stated goal to reduce human GHG emissions in 2030 to some arbitrary figure of 25 or 30% below 1990 levels, then to achieve zero human GHG emissions by 2050 or so, do you believe this is even remotely possible, given:
a) continued growth in Asia, particularly the documented, sustained carbon intensity increase per capita
b) currently available technology, namely the lack of blanket replacements for coal, oil and gas (and I’m not just talking about power generation).
https://patricktbrown.org/2019/01/04/does-the-ipcc-say-we-have-until-2030-to-avoid-catastrophic-global-warming/
“That said, you do appear to be attempting to ‘run interference’ for Mainstream Climate Science, at least regarding the dubious claims made at the end of the past century that snow would become a thing of the past [as a result of human beings continuing to combust fossil fuels at a sustained high, or even higher, rate].”
NOPE, I said the EXACT OPPOSITE, the IPCC says the decline will be small to modest
Swiss dude
“I noted that you agreed with the assessment by the IPCC from a decade or so ago, that over half the observed warming during the latter half of the 20th Century was in fact (now at 95% certainty, if I recall correctly) due to the increased human GHG emissions; at least you said that you could think of no other plausible cause. Do you agree that the accepted range of equilibrium climate sensitivity is still on the order of 1.5-4.5℃ per doubling of CO2? Do you find the 95% certainty above scientifically coherent with the 3-fold range given for climate sensitivity? ”
1. is that the accepted range, pretty much
2. I prefer my formulation: given an over under bet of 3C, I choose the under bet.
“What are your thoughts on the Hansen et al. 1988 long-term climate projections / scenarios (as a function of human GHG emissions) and how these compare to the actual record (of both human GHG emissions and the global mean surface temperature record over the past three decades?”
1. Hansen was more right than wrong.
2. The correct way to re evaluste his projection is to re run his model. Can’t be done.
(orginal model is lost to history)
3. I would not judge a science by early crude modelling efforts 30 years old.
Apparently you have considered the ‘big picture’, which, if implementing so-called Climate Policy were to gain any traction worldwide, would necessarily need to address the question of ‘effectiveness’, i.e., the success of said policy in achieving its stated goal of stabilizing long-term temperature growth to a maximum of 1.5-2.0℃ (above pre-industrial times).
In this context, I find it curious that you decline to address the apparent lack of a long-term acceleration signal in the Global Mean Sea Level (GMSL) dataset. Do you not have some intellectual curiosity here, or, indeed, a yearning for intellectual honesty?
########################
Not really, I have my policy desires, mostly on no regret actions.
SLR. Best work I’ve seen says its too early to detect acceleration, but in general
its not that important. Here’s all you need to know.
1. COntinuing to dump co2 at the current rates is not risk free.
2. Drastically changing energy sources is not risk free.
3. We currently do not plan for weather of the past, much less climate of the future.
4. One course of action includes
A) Building resilient communities
B) removing barriers to the deployment of nuclear.
C) focus on energy efficiency, its win win
Pretty modest agenda given the uncertainty and risks.
“But on the policy question, namely the stated goal to reduce human GHG emissions in 2030 to some arbitrary figure of 25 or 30% below 1990 levels, then to achieve zero human GHG emissions by 2050 or so, do you believe this is even remotely possible, given:
a) continued growth in Asia, particularly the documented, sustained carbon intensity increase per capita
b) currently available technology, namely the lack of blanket replacements for coal, oil and gas (and I’m not just talking about power generation).”
Remotely possible? How remote?
I don’t think the goals will be reached. hence the focus on adaptation.
Sorry, I may not be the cartoon warmist you imagine. Nver have been.
Here is the BIG CLUE.
I do data. period, full stop. Ya’ll want to fit me in a warmist box ( Im a luke warmer) and get all confused when I dont fit in your box. Ya’ll want me to have an opnion and position on every topic.
Sorry, I reserve judgment. Its called skepticism.. which is NOT denial, but rather reserving judgment
where you have no specific knowledge.
Mosher-Dude,
Thanks for your reply.
I agree with your reasonable suggestions under 4:
4. One course of action includes
A) Building resilient communities
B) removing barriers to the deployment of nuclear.
C) focus on energy efficiency, its win win
Pretty modest agenda given the uncertainty and risks.
Very reasonable stuff, level-headed. Chapeau.
This article was about Weather in Central Europe, specifically recent heavy snowfall in parts of Austria and Germany, including some much-deserved ridicule heaved upon one Dr. David Viner of the University of East Anglia’s CRU, for his lame prediction nearly two decades ago [foretelling the ‘end of snow’, ostensibly for at least England, possibly also he intended for the lowlands of the British Isles or even most of Central and Southern Europe; difficult to say].
Now this Viner fellow was a senior research scientist at one of climate science’s leading research institutes at the time, lavishly funded by the UK Government. As I understand it, Viner was (and still is) a contributing author to the IPCC and is still gainfully employed by the Univ. of E. Anglia.
Now you’re essentially saying, “Viner was wrong” [STFW, end of story. Move along, folks]. Funny, I don’t recall having heard Viner being panned by his colleagues, let alone the UN IPCC, nor having been reprimanded by a professional association of climatologists for having spoken out of line. To the contrary, his essential views were often repeated for the ensuing decade, not dissimilar to those of Ehrlich’s Population Bomb predictions. Then once the predictions began to fail miserably, he was quoted less often. Nowadays the dyed in the wool warmists reckon he was ‘kinda sorta right’, must’ve been off a bit on the rate of decline, but he’s basically right [about the decline in snow cover as a direct consequence of human GHG emissions, which is still the IPCC position].
Nor do I recall having seen a ‘mea culpa’ by Viner himself, nor from his employer. Have you?
Not good enough. This is what irks ordinary citizens about the field of climate science. Anything seems to get a free pass, including fear-mongering a la Chicken Little.
Which brings me back to Hansen. You say he was ‘more right than wrong’. What? Hansen was demonstrably off by a factor of two (or more), despite human CO2 emissions being 1/3 higher than his Business as Usual Scenario, using his own temperature series and methodology. The lower error bound given for the future temperature (smoothed, 5y running mean) was approx. 1/3 above the actual measured temperature trend. In an engineering field such as aviation, get your numbers off by a factor of two or more and people die, which is generally a career-changing event.
Same goes for the lack of a sustained increase in the sea level rise rate (no observable long-term acceleration signal, which would indeed be a necessary metric to underline the existence of anything resembling a human-caused warming risk). You don’t appear to appreciate that this is rather important, indeed fundamental.
It is time to put some quality standards to climate science, e.g., regarding failed projections. It is also high time to drop the catastrophism, fear-mongering rhetoric about rising sea levels, infectious diseases, etc. But of course, that could mean climate scientists losing some funding.
Don’t believe in polls. People asked to prefer ‘normal’ or ‘bio food’ of course give the opportunistic answere ‘bio’.
The same questioned persons will buy the cheapest stuff to get regardless bio label or not.
https://www.google.com/search?client=ms-android-samsung&q=polls+answers+opportunistic&spell=1&sa=X&ved=2ahUKEwi3hIaeyuHfAhWK2OAKHco2CVUQBSgAegQICxAC&biw=360&bih=560
Another awesome ski year in the making. Lived in Chamonix during the 1977-78 pounding with 100 year avalanche events and over a dozen deaths that region alone. Old timer locals recommended against building ski chalets on fields over 1/2 km from mountain base in Argentiere. Still remember seeing one of the concrete block structures completely filled with snow 20-30ft deep. Massive powder avalanche ran across the entire field killing all inside. Wise to have longer term horizons. Also recall the interesting ~1700’s woodcuts of the Mer de Glace spilling out of the Vallee Blanche nearly blocking the Arve valley. It started receding in the early 1800’s, continuing today. Would be great to understand what turned it around.
Steven Mosher: you mentioned black carbon in your earlier post. How do you think it affects the climate?
Black carbon on Arctic ice sheets greatly increases absorption of insolation.
It is entirely possible that the majority of modern warming was powered by changes in Arctic albedo, due to Chinese industrial soot, and not by CO2.
Examples of industrial soot on ice….
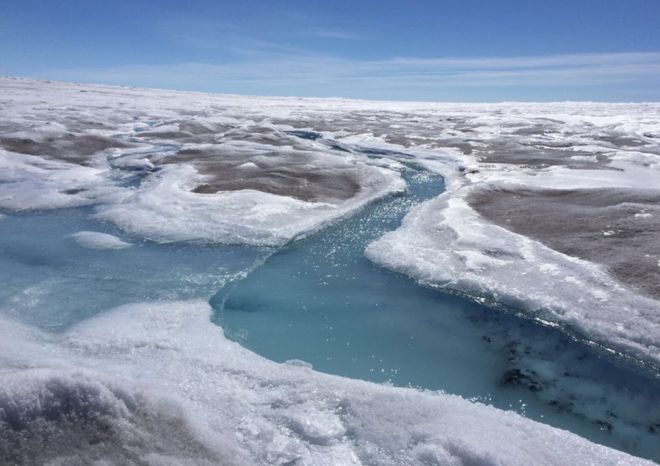
http://www.ccacoalition.org/sites/default/files/styles/listing6/public/fields/news_mainimage/box-climate-station-1024×576.jpg
The temperature we have is a function of the TOTAL of all raditive forcings.
http://www.climatechange2013.org/images/figures/WGI_AR5_Fig8-17.jpg
Not just C02, but CH4, Black carbon, CO, N20. etc
See those bars?
See the positive ones?
They all contribute.
See black carbon? At the extreme end it could be responsible for a full Watt of additional forcing
Not quite as large as C02, but compare the 2.
Policy? Seems to me you’d go after black carbon reduction before you’d go after C02.
I dunno maybe some skeptic will argue that soot is used to grow plants in green houses
and that soot is essential to life and not a pollutant
Soot in the air must block insolation, soot on the ice of course increases melting which cools the air above it. And finally after the arctic ice has melted the warmth escapes more easily to space from free water. So, I think the soot must have an overall cooling effect.
Lets recap.
article is about snow increasing in Germany
1. Folks bring up Vinter.
2. I explain that the IPCC says two things.
A) coming decades will see increased winter precipitation in germany
B) LONG TERM, the decline in snow is slight to modest. Vinter is one dude.
3. Sammy cuts and pastes a bogus chart
4. I show you.
A) a decline in annual snow
B) An increase in winter snow
C) A sharp deline in spring and summer snow cover.
5. NOBODY stays on the topic of snow, cause your view has been challenged instead
6. Folks ask me questions about different topics, energy, ECS, MWP, Acidification, SLR
ya see why folks question whether some skeptics are serious
On a good note Some folks were happy to see the snow data. THATS the old WUWT.
This is the right summary.

Thick fresh snow in Grevena, Western Macedonia, Greece last night, January 9. Report: Petros Potikas
 ?_nc_cat=1&_nc_ht=scontent-frt3-2.xx&oh=c0099f9c89ccd23cf53b64b277c9a026&oe=5CBA8999
Norwegian roof avalanche 😀
Healthy sharp debate. Not a scientist just an ankle gnawing political type myself so it’s informative. Didn’t the IPCC just generate S.R 1.5 ? AKA we are all going to fry in hell report number whatever. AKA when you don’t have crap yell louder. That was a political screed if ever there was one. Guess that’s okay as long as you’re with the IPCC. Didn’t the perv at the head of that thing call real science “Voodoo science” You should be ashamed to bring it up.
You have data, you feed it into an excel spreadsheet and it spits out information. Later you stuff in some more and you get different information. Big deal. 1.5% here. 2.09999987 % there when attempting to predict the climate of the planet? What’s your next act Lysenko. Seriously. Marketing and data. How can you tell which one you are doing when.
You’re a data entry clerk with delusions of grandeur.
Sea surface temperature anomalies oscillate from 0.15 to 0.4 degrees C.

Brocken, Harz, Germany on January 9. Report: Matthias Bein / BEST of HARZ
 ?_nc_cat=105&_nc_ht=scontent-frx5-1.xx&oh=6c9a824090ee805f276f1544a33ca742&oe=5CC0FAB2
Have a look here, it is dated 2017-11-17
https://www.radiosaw.de/winter-auf-dem-brocken
It happened before, it will happen again. We are doomed!
2017-12-17 is the correct date.
Jörg Kachelmann’s “Kachelmannwetter” summary of his most recent opinionpiece (translation by Google Translate):
The snowfalls are not unique for the Alps.
They have nothing to do with climate change.
They make people in the Alps happy, because they ensure skiing until Easter, if nothing stupid happens until then.
They make glad the glaciers that can relax under ten feet of snow, at least for an extremely warm and dry spring.
They make people happy who are interested in compensating for drought and replenishing groundwater supplies.
They make media happy because weather catastrophes click well. However, the current weather situation is not a catastrophe. Human lives are (except in the mentioned 0.1 percent problem) only in danger if people behave inappropriately.
https://www.t-online.de/nachrichten/panorama/id_85072446/joerg-kachelmann-trotz-winter-chaos-viele-profitieren-vom-schnee.html
Sorry.
Look at the forecast.
http://www.lightningwizard.com/maps/Europe/gfs_cape_eur48.png
You see now how deadly all this global warming is??? We all know about CO2 being the ‘dry ice’ you see at concerts well now there is so much of it that it has turned the atmosphere completely to snow….