Reposted from Dr. Roy Spencer’s Blog
+0.25 deg. C
January 2nd, 2019 by Roy W. Spencer, Ph. D.
2018 was 6th Warmest Year Globally of Last 40 Years
The Version 6.0 global average lower tropospheric temperature (LT) anomaly for December, 2018 was +0.25 deg. C, down a little from +0.28 deg. C in November:

Global area-averaged lower tropospheric temperature anomalies (departures from 30-year calendar monthly means, 1981-2010). The 13-month centered average is meant to give an indication of the lower frequency variations in the data; the choice of 13 months is somewhat arbitrary… an odd number of months allows centered plotting on months with no time lag between the two plotted time series. The inclusion of two of the same calendar months on the ends of the 13 month averaging period causes no issues with interpretation because the seasonal temperature cycle has been removed, and so has the distinction between calendar months.
Various regional LT departures from the 30-year (1981-2010) average for the last 24 months are:
YEAR MO GLOBE NHEM. SHEM. TROPIC USA48 ARCTIC AUST

2017 01 +0.33 +0.32 +0.35 +0.11 +0.28 +0.95 +1.22

2017 02 +0.39 +0.58 +0.20 +0.08 +2.16 +1.33 +0.22

2017 03 +0.23 +0.37 +0.10 +0.06 +1.22 +1.24 +0.98

2017 04 +0.28 +0.29 +0.27 +0.22 +0.90 +0.23 +0.40

2017 05 +0.45 +0.40 +0.50 +0.42 +0.11 +0.21 +0.06

2017 06 +0.22 +0.34 +0.10 +0.40 +0.51 +0.10 +0.34

2017 07 +0.29 +0.31 +0.28 +0.51 +0.61 -0.27 +1.03

2017 08 +0.41 +0.41 +0.42 +0.47 -0.54 +0.49 +0.78

2017 09 +0.55 +0.52 +0.58 +0.54 +0.30 +1.06 +0.60

2017 10 +0.64 +0.67 +0.60 +0.48 +1.22 +0.83 +0.86

2017 11 +0.36 +0.34 +0.39 +0.27 +1.36 +0.68 -0.12

2017 12 +0.42 +0.50 +0.33 +0.26 +0.45 +1.37 +0.36

2018 01 +0.26 +0.46 +0.06 -0.11 +0.59 +1.36 +0.43

2018 02 +0.20 +0.25 +0.16 +0.04 +0.92 +1.19 +0.18

2018 03 +0.25 +0.40 +0.10 +0.07 -0.32 -0.33 +0.60

2018 04 +0.21 +0.32 +0.11 -0.12 -0.00 +1.02 +0.69

2018 05 +0.18 +0.41 -0.05 +0.03 +1.93 +0.18 -0.39

2018 06 +0.21 +0.38 +0.04 +0.12 +1.20 +0.83 -0.55

2018 07 +0.32 +0.43 +0.22 +0.29 +0.51 +0.29 +1.37

2018 08 +0.19 +0.22 +0.17 +0.13 +0.07 +0.09 +0.26

2018 09 +0.15 +0.15 +0.14 +0.24 +0.88 +0.21 +0.19

2018 10 +0.22 +0.31 +0.13 +0.34 +0.25 +1.11 +0.39

2018 11 +0.28 +0.27 +0.30 +0.50 -1.13 +0.69 +0.53

2018 12 +0.25 +0.32 +0.19 +0.32 +0.20 +0.65 +1.19
The 2018 globally averaged temperature anomaly, adjusted for the number of days in each month, is +0.23 deg. C, making 2018 the 6th warmest year in the now-40 year satellite record of global lower tropospheric temperature variations.
The linear temperature trend of the global average lower tropospheric temperature anomalies from January 1979 through December 2018 remains at +0.13 C/decade.
The UAH LT global anomaly image for December, 2018 should be available in the next few days here.
The new Version 6 files should also be updated at that time, and are located here:
Lower Troposphere: http://vortex.nsstc.uah.edu/data/msu/v6.0/tlt/uahncdc_lt_6.0.txt
Mid-Troposphere: http://vortex.nsstc.uah.edu/data/msu/v6.0/tmt/uahncdc_mt_6.0.txt
Tropopause: http://vortex.nsstc.uah.edu/data/msu/v6.0/ttp/uahncdc_tp_6.0.txt
Lower Stratosphere: http://vortex.nsstc.uah.edu/data/msu/v6.0/tls/uahncdc_ls_6.0.txt
Who will be the first to tell us what the absolute global temperature is, instead of these silly anomaly numbers…. Shall we make a referendum. I will vote for 14.00 degrees C, and now it is up to: 14.25 degrees C.
Any better?
http://berkeleyearth.lbl.gov/auto/Global/Land_and_Ocean_summary.txt
more like 15.1C
it is getting warmer.
there was an LIA
Steven Mosher
We believe that the use of air temperatures above sea ice provides a more natural means of describing changes in Earth’s surface temperature.
Any scientific underpinnings to this statement perchance?
“Any scientific underpinnings to this statement perchance?”
This knee-jerk sniping at anything Mosher posts does not contribute to either the discussion or this site in general.
1. The statement stands on its own and it does make sense to use actual air temperatures than an assumed single temperature over ice.
2. BEST gives the results for both methods, being completely transparent about the difference their preferred choice of method makes.
I find your knee jerk defence of anything towards Mosher to be pathetic. He’s a big boy. That question Hotscot is making is legitimate.
And, ummm… the world’s temperature is best represented by something measured at a (krigged?) location near the pole? You know better than that, ctm.
Mosher, as usual, was just going out of the way to be antagonistic.
What hotscot should have done was store the phrase “there was an LIA” in his memory for later usage, because Mosher will surely give him reason to use it.
charles the moderator – January 2, 2019 at 1:14 pm
HUUUMMM, wouldn’t the air temperature “over sea ice” be highly dependent upon from which direction the wind is/was blowing?
The temperature of “sea breezes” and ”land breezes” are dependent on several factors, …… are they not?
“Mosher, as usual, was just going out of the way to be antagonistic.
What hotscot should have done was store the phrase “there was an LIA” in his memory for later usage, because Mosher will surely give him reason to use it.”
I guess I will use the phrase “There was an LIA” more consistently and more often than any skeptic.
There is a reason for this.
1. No skeptic ever challenges the existence of the LIA. it is almost an article or faith.
2 The skeptic belief in the LIA is vitally important because it shows one fundamental thing.
There is evidence that skeptics will accept without question or doubt.
There is thus some stand of evidence and proof they accept, because they
believe their was an LIA.
3. the only important questions are these.
what is that evidence, why do skeptics accept that kind of evidence?
why do they object to similar evidence used in other contexts? can they
consistently apply the same standards of evidence to other claims.
To give you an funny examples of skeptical knots
“There was an LIA. For some skeptics this means the physically meaningless global temperature of the LIA was colder than the physically meaningless global temperature of today. Now That’s funny
There was an LIA. However, expressing this as an anomaly ( we are +2C warmer than the LIA) is meaningless and misleading, so until someone posts the actual T of the LIA, there must not be an LIA. We hate anomalies but the LIA was cooler by 2-3C.
Opps I used anomalies.
In summary.
There was an LIA.
We believe in the LIA because there is historical evidence of it.
Just as there was historical evidence of the dust bowl and 1930s temperatures in the USA.
Just as there was evidence of the very hot late 1800s in Australia.
Unlike CAGW.
“HUUUMMM, wouldn’t the air temperature “over sea ice” be highly dependent upon from which direction the wind is/was blowing?
The temperature of “sea breezes” and ”land breezes” are dependent on several factors, …… are they not?”
On an hourly basis, yes, daily yes, monthly? not so much.
How do we know this?
Simple: The first stage of our process is to do a regression
For us temperature is composed of the following
T = C + W
temperature is combination of of Climate + Weather.
Further:
C = F(L,A,S) where
L = latitude
A = Altitude of site
S= seasonality.
W is just the residual
W = T-C
So we first compute the climate. using the data we have we do a regression that expresses the Climate as a function of the Season, the latitude of the site and the
elevation. Willis did something similar in one of his posts.
This regression ( we also look at interaction effects) explains 90+ % of the variance
That means given a month, latitude and altitude we can PREDICT the temperature at any location.
the regression is used to create a field, global field. Next the Climate is subtratced from the temperature: W= T-C.
The weather is the residual. It is ALL the stuff that is unexplained by the regression:
A) the weather ( winds etc)
B) the effects of ground cover
C) distance from coast
D) ERRORS in the data.
E) Changes in trend
This residual is then Krigged ( think smoothed) and added back to the climate
So for the arctic we use the climate function to determine a “base” and then the “weather part” is krigged
“We believe in the LIA because there is historical evidence of it.
Just as there was historical evidence of the dust bowl and 1930s temperatures in the USA.
Just as there was evidence of the very hot late 1800s in Australia.
Unlike CAGW.”
Great. Lets see the evidence?
A) how many locations? You know people object to the thermometer record because
it is unevern and sparse. Do you have MORE historical reports of the LIA?
B) what kind of measures? how precise? how accurate?
C) do you have actual measurements or just proxies?
So list your evidence. Then explain the principles you used when you accepted it.
Explain the ways you doubted it and tested it?
Did you consider all other explanations for the evidence?
Well look Mr Mosher is making that claim again that he can predict the temperatrure given
“a month, latitude and altitude we can PREDICT the temperature at any location”.
But neglects to say how accurate this prediction will be.
So come on Steve, How Accurate Will Your Prediction Be?
Put up or stop making the claim, just like the 1997 data I keep asking you about you also avoid answering this one as well.
ps I believe that you have added the month since you last claimed you can do this, but that doesn’t matter.
Mr Mosher I am not even going to bother, because I only had to look at the WUWT post on this subject back in 2013 to show that you are antagonistic to anything MWP & LIA being “Global”.
https://wattsupwiththat.com/2013/10/31/new-paper-shows-medieval-warm-period-was-global-in-scope/
Most people anti of the theory suggest it was only the Northern Hemisphere at most, but as Dr Spencer explains it IS the Northern Hemisphere that controls the Satellite values in the Atmosphere.
Heck, you could claim with justification that even the real Ice Ages weren’t global. Not EVERY part of Earth was cold and covered in ice. If the Equator was 6 C. colder than today then it would have been, on average, around 25C, or 78F. That’s still pretty balmy, and I doubt the inhabitants of the equatorial lowlands 20,000 years ago noticed much at all.
“There was an LIA. However, expressing this as an anomaly ( we are +2C warmer than the LIA) is meaningless and misleading, so until someone posts the actual T of the LIA, there must not be an LIA.”-Mr. Mosher
First there is an ice age
then there is no ice age
then there is.
First there is a mountain
then there is no mountain
then there is.-(to paraphrase Donovan)
Before there were thermometers there were no thermometers.
There will never be ‘actual’ temperatures of the LIA.
The LIA is before thermometers.
Happy New Year Mr. Mosher.
From the next couple of lines ” % Two versions of this average are reported. These differ in how they treat % locations with sea ice. In the first version, temperature anomalies in the % presence of sea ice are extrapolated from land-surface air temperature anomalies. % In the second version, temperature anomalies in the presence of sea ice are % extrapolated from sea-surface water temperature anomalies (usually collected % from open water areas on the periphery of the sea ice). For most of the % ocean, sea-surface temperatures are similar to near-surface air temperatures; % however, air temperatures above sea ice can differ substantially from the water % below the sea ice. The air temperature version of this average shows larger % changes in the recent period, in part this is because water temperature changes % are limited by the freezing point of ocean water. We believe that the use of air % temperatures above sea ice provides a more natural means of describing changes in % Earth’s surface temperature. ” So, apparently you didn’t read far enough.
Why are you asking him he is just providing link to data that was requested, even pointing out much of rise is due to LIA?
Thanks for you question HotScot.
I’ll make several points in individual comments so you can be sure to address them all
https://www.bbc.com/news/magazine-25862141
“matthewdrobnick”
You think Frost fairs are evidence?
1. How many global locations have data like this?
2. the water froze? what was the air temperature?
3. Did you base your belief on this one article? where you skeptical?
one hint
‘The reason why freezing increasingly
failed to happen, even though monthly
DTmin values repeatedly fell below -2.6°C, is
almost certainly that in 1825 (marked by the
first vertical black dashed line) the old London Bridge was demolished. This bridge
had many small arches and elements of a
weir, which slowed the flow and allowed
ice to form and thicken. The river flow was
further increased by the building of the
embankments, a programme completed
with the opening of the Victoria embankment in 1870 (the second vertical dashed
line). Andrews (1887) notes of the very cold
winter of 1881, “it was expected by many
that a Frost Fair would once more be held
on the Thames”, but does not explain why
there was none. In 1883 and 1896, ice floes
formed on the river but it did not freeze
solid. Hence the end of the frost fairs
and Thames freezing was caused by the
riverine developments rather than climate
change. Jones (2008) notes that the low
DTmin of 1963 did cause the Thames to freeze
upstream of London at Windsor (figure 6),
sufficient for football matches and other
activities to be pursued on the ice: by this
time the size, banks and flow rate of the
river at Windsor were all similar to those
prevailing in London 200 years earlier,
although the river at Windsor is not tidal”
https://www.researchgate.net/profile/I_Usoskin/publication/315731648_Frost_fairs_sunspots_and_the_Little_Ice_Age/links/5b15182f0f7e9b498109956b/Frost-fairs-sunspots-and-the-Little-Ice-Age.pdf?origin=publication_detail
And once again you catastrophists come up with every single excuse other than the obvious: it was much colder.
I listed the article because it mentioned the fairs not because anything the BBC says is accurate. Fairs, frozen Thames… Colder, much colder.
You want to make excuses about bridges as if that’s a legitimate reason the Thames stopped freezing.
I can counter your London only refutation with European wide confirmation from the University of Bern.
https://boris.unibe.ch/68122/1/jinh_a_00575.pdf
https://www.historic-uk.com/HistoryUK/HistoryofEngland/The-Thames-Frost-Fairs/
Between 1600 and 1814, it was not uncommon for the River Thames to freeze over for up to two months at time. There were two main reasons for this; the first was that Britain (and the entire of the Northern Hemisphere) was locked in what is now known as the ‘Little Ice Age’. The other catalyst was the medieval London Bridge and its piers, and specifically how closely spaced together they were.
THE FIRST WAS THAT BRITAIN….WAS LOCKED IN… THE LITTLE ICE AGE.
Read….The primary cause was bitter cold. Secondarily, the bridge contributed to the freezing but was not the sole reason.
“During the Great Winter of 1683 / 84, where even the seas of southern Britain were frozen solid for up to two miles from shore, ”
when is the last time this happened Mr. Mosher?
“By the 1800’s the climate had started to warm, the severity of the winters had waned and the last ever London Frost Fair took place in the January of 1814…Perhaps the river would have frozen over a few more times before the end of the Little Ice Age, but the demolishing of the medieval London Bridge in 1831 meant that this was not to be. Instead, the fair of 1814 would be the last.”
so we have a warming climate, where the possibility after it had been warming may have been assisted to freeze with the bridge, BUT already after it had been warming.
It was a contributor, but not the sole reason and the accounts of bitter cold and failed crops, overall terribly colder weather, and deaths due to famine are historical fact. You can pretend to rewrite history (just like the rest of your misanthropic MSM outlets) to fit your misanthropic narrative but you are only fooling yourself.
1. You failed to quote the whole passage.
Here is the full comment. Thanks for clicking on the link, but it does not help your case or question if you pull quote from document that is linked. The reason why is that others can look at the link and see what you avoided. The file has been there for years
Here is the full quote:
“% This file contains a brief summary of the changes in Earth’s global average
% surface temperature estimated by combining the Berkeley Earth land-surface
% temperature field with a reinterpolated version of the HadSST ocean temperature
% field.
%
% Two versions of this average are reported. These differ in how they treat
% locations with sea ice. In the first version, temperature anomalies in the
% presence of sea ice are extrapolated from land-surface air temperature anomalies.
% In the second version, temperature anomalies in the presence of sea ice are
% extrapolated from sea-surface water temperature anomalies (usually collected
% from open water areas on the periphery of the sea ice). For most of the
% ocean, sea-surface temperatures are similar to near-surface air temperatures;
% however, air temperatures above sea ice can differ substantially from the water
% below the sea ice. The air temperature version of this average shows larger
% changes in the recent period, in part this is because water temperature changes
% are limited by the freezing point of ocean water. We believe that the use of air
% temperatures above sea ice provides a more natural means of describing changes in
% Earth’s surface temperature.
%
% The percent coverage of sea ice was taken from the HadISST dataset and varies
% by month and location. In the typical month, between 3.5% and 5.5% of the
% Earth’s surface is covered with sea ice. Prior to 1900, the ice field merely
% repeats a seasonal climatology and is not directly constrained by observations.
% For more information on the processing and use of HadISST and HadSST refer to
% the description file for the combined gridded data product.
%
% Temperatures are in Celsius and reported as anomalies
% relative to the Jan 1951-Dec 1980 average. Uncertainties represent the 95% confidence
% interval for statistical and spatial undersampling effects as well as ocean biases.”
We offer 2 versions. I will explain later why and how this comes about. The scientific under pinnings you request are there in the text. There is more, however. I’ll address that in the next comment.
2. You asked for SCIENTIFIC underpinnings for our belief that it is more naturaal to use air over ice.
The word we used was “natural” I’m not particular happy with this choice of words. I would use the word SIMPLE, as its’ somewhat complicated to explain to people the difference between the 2 choices:
Choice A. the global temperature index is created by averaging 2 components
1. SST, typically the first meter of water
2. SAT, the air temperature (2m) above land and floating ice.
Choice B the global temperature index is created by averaging 3 components
1. SST, typically the first meter of water
2. SAT, the air temperature (2m) above land and
3. SST directly below floating ice.
The claim we make is that choice “A” is more natural. I would say “simple” or easy to explain. I would not say it is more Scientific to use air temperature over ice. If we thought that we would say scientific and we would not release the alternative. The choice is pragmatic, so we offer both for folks who prefer the other approach. These analyst choices form part of the structural uncertainty.
3. Why do 2 different versions?
You can blame this on me since this was my idea. First you have to understand how GISS and BEST differ from CRU in treatment of the arctic ( something mentioned in the climategate mails)
The Arctic ( say north of the last land measurement around 80 deg N is a tiny part of the whole area, so any differences in treatment will be small WRT the entire globel. This is true as long as the Artic warms or cools in concert with the rest of the globe.
But we have some evidence this is not the case. WE have some evidence the arctic is warming faster.
Next, you have to realize that all spatial statistic involves interpolation: inferring measurements where you have none. This is true if thermometers are 2 feet apart or 200km apart.
At the time we did this there were TWO choices on how to treat the arctic.
A) CRU. The CRU approach is to implicity Infill the missing arctic with the AVERAGE rate of change for the whole planet.
B) The GISS approach. They explicitly interpolate the trends at the last measured latitude
to latitudes north of that.
For example, if the entire globe is warming at .2C per decade and the latitude from
70 to 80 is warming at .4C per decade, then.
1. CRU will “effectively” use .2C for the region from 80N to 90N. This asserts a decline
in trend s a function of latitude.
2. GISS will use the .4C to interpolate the last 10 degrees.
In Cowtans and Ways work on the arctic ( Way is afriend and we talk about these things)
They showed that #2 is more accurate. They did this with bouy work, satellite work, and work with re analysis data.
CRU tends to underestimate the warming.
My idea was someone ( perhaps a skeptic) might argue that it makes more sense to use SST temperature under ice. This approach SHOULD show even less warming than CRU because the temperature of water under ice is relatively constant. Think of this as a step you take to really understand the full magnitude of the systematics or structural uncertainty. CRU chooses its approach. GISS chooses its approach. These choices change the answer slightly.
By using water under ice you get the lowest estimate of warming.
The other choice is to look at air temp over ice but to consider that when ice melts the 2m temperature is constant. That ends of being really complicated.
To recap there would 4 ways of doing the arctic.
1. Most warming: air temp over ice, inferred from 70 to 80n
2. More warming: air temp over ice, infferred form 70 to 80n, but held constant during
ice melting months ( see the DMI chart of temps N of 80n)
3. Some warming: the CRU method using the smaller warning south of 70N to efectively
infill N of 80.
4. Less warming: using water temp under ice.
Prior to this work 1 and 3 were the only approaches. I suggested #2 and $4. #4 was easy to do. we did that.
Subsequently , after looking at reanalysis data it appears that #1 may underestimate the warming.
Regardless it is warming. There was an LIA
4. You ignored the thrust of my comment and changed the subject.
The commenter was complaining about anomalies. I noted that BEST supply actual T and have for years.
Want to know something else?
RSS also supply actual T, unlike UAH.
Here is what I want to know. Skeptics here demand actual T and not anomalies. As if reporting anomalies makes it warmer. However, the love of actual T as opposed to anomalies somehow vanishes when discusing RSS versus UAH.
So which better scientifically? RSS that provide actual T or UAH who only supply anomalies?
A consistent viewpoint on this from a leading skeptic like you would be great.
which is better: UAH anomalies or RSS actual T?
Salute Steve, and great stuff for us to digest.
I would like to see both absolute data and then the “anamoly” data.
My problem with the anamoly approach is that the plots can be skewed depending upon what 30 year baseline is used.
Gums sends…
Steven Mosher,
I really like it when you respond in a detailed and thoughtful way to a drive-by criticism. It shows you and your work in a much better light than your previous terse and sometimes dismissive comment habit.
Please keep it up, I know it is more work but it is very informative and a valuable contribution to the dialog.
Mr Mosher, I prefer the data presented as an Actual and I bring this question up every time temperatures are discussed on here, will you answer it this time?
In 1998 NASA/NOAA presented the 1997 global Land & Sea Temperature as an Actual Temperature (obviously based on the Anomaly added to the then current baseline).
it was 62.45F or 16.92C, because it was an Actual Temperature it was easy to compare it to later versions of the value for the same year.
In 2016 it was stated that the newly calculated 1997 temperature was 58.13F or 14.53C.
Now if we only had the anomaly from 1998 we would never have known that the recalculaton had dropped the 1997 by 4.32F or 2.39C.
So can you tell me how they justified the change?
Funny, you get pressed for an honest answer requesting computation, but slunk out claiming you don’t have time and you get paid $800-1000/hour…
Then you proceed to shit post 4 long tirades…
You can’t even take yourself seriously, do you?
Do you possess the capacity for self-reflection, or just arrogant, drive-by pithy remarking and egoism?
You clearly have smarts but aren’t employing them consistently, which is why you deserve the criticism we love.
So answer the question passed by Alan instead of trying to win a financial pissing contest of projecting self-worth
Levy, not love
“Salute Steve, and great stuff for us to digest.
I would like to see both absolute data and then the “anamoly” data.
My problem with the anamoly approach is that the plots can be skewed depending upon what 30 year baseline is used.
Gums sends”
Anomalies are just a constant offset.
like so:
Suppose you were a wrestler in high school at 167 lbs.
Call this your baseline.
Now you can report your weight as 33 lbs over wrestling weight (200lbs)
Suppose you were 180 lbs when you got married out of college
call this your baseline. you are now, 20 lbs over honeymoon weight
We report anomalies to make it easy to see the change. its just subtraction
“Mr Mosher, I prefer the data presented as an Actual and I bring this question up every time temperatures are discussed on here, will you answer it this time?
“In 1998 NASA/NOAA presented the 1997 global Land & Sea Temperature as an Actual Temperature (obviously based on the Anomaly added to the then current baseline).
it was 62.45F or 16.92C, because it was an Actual Temperature it was easy to compare it to later versions of the value for the same year.
In 2016 it was stated that the newly calculated 1997 temperature was 58.13F or 14.53C.
Now if we only had the anomaly from 1998 we would never have known that the recalculaton had dropped the 1997 by 4.32F or 2.39C.
So can you tell me how they justified the change?”
Given their published methods I can’t tell you how they mis calculated the average as
16.92, Bottom line if you dont see it published in a paper or cant se the method, then you can pretty much ignore it
Hi matthew
“Funny, you get pressed for an honest answer requesting computation, but slunk out claiming you don’t have time and you get paid $800-1000/hour…
Then you proceed to shit post 4 long tirades…”
Ah no. I got a request to do a calculation that I think is wronmg headed. Done right its months worth of work. Next, it is outside my particular area of expertise. If I asked you to do work that you thought was wrong headed would you do it for free.
I’m a libertarian. I dont believe in giving my time away.
You can’t even take yourself seriously, do you?
Never take yourself seriously
Do you possess the capacity for self-reflection, or just arrogant, drive-by pithy remarking and egoism?
Pithy? thanks! I owe you one!
You clearly have smarts but aren’t employing them consistently, which is why you deserve the criticism we love.
Sorry pay up if you want consistency, otherise I post as the spirit moves me. what is it with you guys wanting free labor? COmmie!
So answer the question passed by Alan instead of trying to win a financial pissing contest of projecting self-worth
Alan asked a stupid question. if he has some work to show, I’m sure some expert in that feild will have a look. But the form of the question suggests he would not recognize the right answer.
Now I suppose you will ask for a discount.
Steven Mosher January 4, 2019 at 2:27 am
“Given their published methods I can’t tell you how they mis calculated the average as
16.92, Bottom line if you dont see it published in a paper or cant se the method, then you can pretty much ignore it”
I see, so the mistakes they made in 1996. 1998 and 1999, which no one noticed can just be “ignored”.
I find it remarkable that a group of NASA/NOAA Scientists could make a CAGW confirming mistake of whole Degrees on a World Report and no one noticed or bothered to correct it other than to say the Baseline changed and then just rewrite the data.
Whereas today they tout 100ths of a degree to establish new records.
“Ah no. I got a request to do a calculation that I think is wronmg headed. Done right its months worth of work. Next, it is outside my particular area of expertise. If I asked you to do work that you thought was wrong headed would you do it for free.
I’m a libertarian. I dont believe in giving my time away.
You can’t even take yourself seriously, do you?
Never take yourself seriously”
you got me pretty good on those. touché. I didn’t know it was months of work.
Do you possess the capacity for self-reflection, or just arrogant, drive-by pithy remarking and egoism?
Pithy? thanks! I owe you one!
You clearly have smarts but aren’t employing them consistently, which is why you deserve the criticism we love.
Sorry pay up if you want consistency, otherise I post as the spirit moves me. what is it with you guys wanting free labor? COmmie!
So answer the question passed by Alan instead of trying to win a financial pissing contest of projecting self-worth
“Alan asked a stupid question.”
Is it genuinely stupid or are you just claiming such. Pretty arrogant.
” if he has some work to show, I’m sure some expert in that feild will have a look. But the form of the question suggests he would not recognize the right answer.
Now I suppose you will ask for a discount.”
well, I need about tree-fiddy.
Steven, how can you possibly publish numbers from 1850 precise to thousandths of a degree? Those calculations can’t possibly be accurate to more than +/- 0.5 C, and yet they continue to be published with three significant digits.
It’s my understanding that a large number of measurements can improve the precision of the mean, but it cannot improve the accuracy. An 1850’s thermometer (and probably a 1970’s one, too) as used in weather stations is going to have an accuracy error of +/-0.5 C no matter many measurements are taken. The final number should look something like 0.500 +/- 0.136, because no amount of statistical foreplay can make a thermometer any more accurate than it was.
Thank you, Steve!
No, it isn’t. It was warmer in the 1930s.
Ya gotta read the fine print: 2018 is the 6th warmest year of the global SATELLITE record, so 1936 doesn’t count. Also, the record starts in 1979, at the end of an era so cold that climatologists of that time were writing about the coming of a new ice age. I sure HOPE it’s getting warmer!
Too bad the satellite era didn’t extend back a couple more decades. Could have saved everyone a lot of trouble. Just bad timing on that whole satellite thing.
Too true. I blame the Russians!
(sorry, couldn’t resist)
GCSquared wrote: “Also, the record starts in 1979, at the end of an era so cold that climatologists of that time were writing about the coming of a new ice age.”
Do you have any details of that era because, as far as I can see from this website, the trend from 1850 to 1979 was 0.004 (similar to the 0.006 trend from 1850 to now). The trend from 1979 to now is 0.019, so higher.
When was this ‘so cold’ era? And which climatologists were writing about the coming ice age?
http://www.woodfortrees.org/plot/best/from:1850/to:1979/trend/plot/best/from:1979/to:2018/trend/plot/best/trend
Please allow me to answer for GCS, if you have frequented this place much in the past you should be aware of criticisms about “Adjustments” to the Historical Temperature data.
Take a look at this post which displays the Hansen et al 1981 Northern Hemisphere data that Dr Spencer says controls the Atmospheric readings that the Satellites take.
http://notrickszone.com/2017/11/27/before-1960s-70s-global-cooling-was-erased-it-caused-droughts-crop-failures-glacier-advance-ice-age-threats/
It is the second chart.
The global data has been corrupted by adding Ocean Temperatures to Land Surface Temperatures and many adjustments like TOBS & Homogenisation.
AC Osborn wrote: “Take a look at this post which displays the Hansen et al 1981 Northern Hemisphere data that Dr Spencer says controls the Atmospheric readings that the Satellites take.”
What does that have to do with the BEST data that I used in the link I provided? And isn’t it true that BEST use raw data that can be checked?
That’s a great link you provided there, AC.
I especially like the chart showing the warmth of the 1930’s being erased by the Keepers of the Data. The Climate Change Charlatans can change the data, but they can’t erase past records. One of these days that will matter.
Did you have a place in mind.
Share.
John,
On average for the whole planet.
Surely for the US, with the best data for NH tropical, subtropical, temperate and polar locations.
Thirty-two state heat records were set before 1940, despite NOAA’s adjustments. And more than that when ties are considered.
No, it isn’t. It was warmer in the 1930s.
In the US perhaps but not globally.
I only care about the temperature where I live. [He, he, he, he, Gavin!]
Globally as well.
The US has the best data. It is only warmer now than the 1930s in those place where there are no valid data, only fake “data” made up by NOAA, GISS and HadCRU.
The 1930’s were hot and dry in Australia. The 1930’s had maximum temperatures which still stand as records.
Australia has one of the best and longest records of weather data not only in the southern hemisphere but also the world except that BOM has fiddled with many temperatures (but not rainfall) reducing earlier temperatures (for no verifiable reasons) and increasing recent temperatures (through closing stations, homogenising data from 100’s km away and using instant electronic measurements (ie millisecond output) instead of averaged over the response of mercury in glass thermometers as require by World metrology organisation.
“The US has the best data. It is only warmer now than the 1930s in those place where there are no valid data, only fake “data” made up by NOAA, GISS and HadCRU.”
John:
It didn’t have the best data in the 1930’s.
If you are not ware of it’s observational shortcomings, and more importantly for why, then that could be construed as confirmation bias.
That you think that the globe as a whole was warmer in the ’30’s is the product of a mind consumed by massive conspiracy ideation, akin to “we never went to the Moon”.
Keep that going, it’s doing a power of good for naysayers credibility.
https://moyhu.blogspot.com/2014/05/the-necessity-of-tobs.html
And just to show that the Japanese are also in on the “scam” (sarc) ….
Despite what you say about TOBS the US, Europe & Australia had the best data “available” in the 1930s.
Applying TOBS across the board did NOT make the data better.
“Applying TOBS across the board did NOT make the data better.”
Of course it did, and does.
If not then you must consider a max temp taken and reset on a day when that evening was hotter than the whole of next day to be “better”
How can that possibly be?
As a matter of climatological accuracy.
Of course it is to you when it is in the past.
Would you consider it better if that practice was in place today?
Your answer is the standard response, so I will give mine.
But what about all the sites where it wasn’t and all the days when it didn’t?
They do not only adjust the data where they know for certain that is what happened, they adjust them all.
And then have the cheek to call it science.
Over half of the current temperature increase is from the Adjustments see Menne et al 2009.
So why would anybody be worried about an increase of 0.6C over 100 years following the LIA?
And don’t get me started on kigging and smearing over 1200km, the most preposterous so called science I have ever heard of.
By all means make your adjustments but at the same time show the original data with an explanation.
So Mosher how much do you calculate that CO2 has raised temperatures since 1950? Give us a figure based on todays ~ 410 ppm . I have calculated it. I want your figure.
I work in temperature data products. I volunteer my time.
If you want an answer to your question then you have to pay me for my time.
I typically charge 800 to 1000 per hour.
As for the temperature rise since 1950. There are more forcings than C02, well over a dozen GHGs, aerosols, ect. So you can’t simply “calculate” the portion of the warming that is due to CO2 ALONE. I am generally not inclined to do calculations I dont believe in, especially for no charge. Simple regression would get you part of the way to an answer, but generally your question is not important. What matters is your best estimate for ECS.
However, if you think your estimate is important publish your data and code and folks will have a look at it.
Not your dancing monkey today
The contribution to warming from CO2 is important because that is the component that governments around the world have declared needs regulation, in order to prevent destructive future warming!
If we can’ t determine how much it has contributed to warming in the past, how can we calculate how much warming it will cause in the future?
I am willing to be convinced that future warming is a problem. But not when the research has a pre-determined conclusion that it is working to achieve. And the research ignores all variables, except the target variable. And that conclusion is used by governments to benefit some at the expense of others.
You may think your time is valuable, but this has morphed into an ugly political issue, with very little clarity, and a stain on science that the rest of the scientific community does not deserve.
Whether you like it or not, you are stuck in the middle of it. It does not make you a dancing monkey. It makes you someone that values an impartial approach to the analysis of data. And that is more valuable than money.
Mr. Mosher, I initially hesitated to respond to this, but after doing some research decided it was appropriate. It appears on occasion, with technical matters, when you are challenged you refuse to respond to valid criticisms or questions.
I have been interested to see who you are so I looked up your profile. I was not aware your education was in the arts and not the sciences – not that it makes you incapable of logic or good mathematical computation, it is just that I thought you were an actual climate scientist and that was the reasoning behind clinging so fervently to your CAGW faith. However, now I’m confused. Do you advocate that man is the primary driver of climate changes, and if so, those changes are likely to be catastrophic specifically due to increased Co2? Is that a fair assessment of your worldview?
Regardless, it is nice to have a face behind the name. Far too often, relative anonymity of the internet dismisses the humanity during our interactions, and I’m working on stopping such behavior.
I noticed Mr. Heller had a post regarding the same behavior I’ve noticed from you:
https://realclimatescience.com/2017/07/the-steven-mosher-challenge/
Your comment I’m responding to right now, with respect to your response to Alan Tomalty, appears to be in line with the criticisms from Mr. Heller and others. From what I gather, you spend significant time on these matters, so why not put in the effort with Mr. Tomalty? I think it is a valid question and your response may further the discussion regarding the role CO2 actually plays regarding global temperatures.
If you are here to be adversarial and genuinely believe in your side, why not defend it and politely debate Mr. Tomalty? This was a relevant request so I’m not seeing the reason for dismissing his request.
Also, I agree with the following sentiment:
“The Cob
January 2, 2019 at 1:59 pm
I find your knee jerk defence of anything towards Mosher to be pathetic. He’s a big boy. That question Hotscot is making is legitimate.”
CTM, why do you feel the need to shelter anyone on this site? Are we not all adults? It doesn’t appear HotScot was egregious or acted outside of the ToS.
“The contribution to warming from CO2 is important because that is the component that governments around the world have declared needs regulation, in order to prevent destructive future warming!
If we can’ t determine how much it has contributed to warming in the past, how can we calculate how much warming it will cause in the future?
I am willing to be convinced that future warming is a problem. But not when the research has a pre-determined conclusion that it is working to achieve. And the research ignores all variables, except the target variable. And that conclusion is used by governments to benefit some at the expense of others.
You may think your time is valuable, but this has morphed into an ugly political issue, with very little clarity, and a stain on science that the rest of the scientific community does not deserve.
Whether you like it or not, you are stuck in the middle of it. It does not make you a dancing monkey. It makes you someone that values an impartial approach to the analysis of data. And that is more valuable than money.”
There are several points here.
1. There is more to warming than C02, so the question is not posed very well.
2. There are two ways to calculate it. One would be via regression, multivariate.
The second would be by using a GCM.
3. I could do the multivariate regression, but I think that doesnt give you a very
defensible answer. We did one once in 2012. you can simply estimate the contribution of C02 by looking at the forcings. rough order of magnitude correct.
4. GCM would be my preferred approach. I dont own one
In the ned skeptics have to realize that nobody owes them answers. they have to realize that they DONT get to hand out homework.
“I have been interested to see who you are so I looked up your profile. I was not aware your education was in the arts and not the sciences – not that it makes you incapable of logic or good mathematical computation, it is just that I thought you were an actual climate scientist and that was the reasoning behind clinging so fervently to your CAGW faith. However, now I’m confused. Do you advocate that man is the primary driver of climate changes, and if so, those changes are likely to be catastrophic specifically due to increased Co2? Is that a fair assessment of your worldview?”
Weird. You believed all that? I was a math and physics major. After completing the core and being bored, i switch to stuff that was harder. Luckily I had employers who allowed me to continue my education, degrees don’t matter to me? But I forgot what feynman said. “Check the guys degree!”
1. Not a beliver in CAGW, no catastrophe. sorry BUZNT wrong
2. As for man’s contribution? I havent done the work. I suspend judgement.
However, Like Steve Mcintyre has said “IF I was policy maker I would listen to the best science. That is I would listen to the IPCC unless someone else has a better argument I would listen to that.
3. If I had to form a climate policy Nukes would be #1 approach
As for heller.
you probably dont know, but we have a history. Like when he got booted form this site for basically refusing to admit he was wrong and other misdeeds
fact is he is pretty much a cheat when it comes to data analysis ( hides tons of stuff, just look at his code)
Not gunna waste time, he is the skeptical version of mann
Steven Mosher
January 4, 2019 at 2:51 am
Weird. You believed all that? I was a math and physics major. After completing the core and being bored, i switch to stuff that was harder. Luckily I had employers who allowed me to continue my education, degrees don’t matter to me? But I forgot what feynman said. “Check the guys degree!”
Not that appeal to authority is a logical argument, it isn’t, but I was unaware you had a math background, which confused me since you are always talking about code. Basically…I was wrong and it was irrelevant so I concede on that.
“1. Not a beliver in CAGW, no catastrophe. sorry BUZNT wrong
2. As for man’s contribution? I havent done the work. I suspend judgement.
However, Like Steve Mcintyre has said “IF I was policy maker I would listen to the best science. ”
color me surprised. I don’t get those impressions from what you post on here. Maybe I’m misinterpreting the words you type or placing tone where it is not. Tough to tell, since we’ve all seen plenty of snark and arrogance from you, so…
I’ll just say this is a draw and I’m glad you don’t subscribe to Catastrophic alarmism.
“That is I would listen to the IPCC unless someone else has a better argument I would listen to that.”
This is where I have concern about your judgment on the matter, considering the copious amount of collusion and corruption with regards the IPCC. It is a political organization tasked with only man’s contribution, and has been rebuked for such. Why do you place your faith in the IPCC?
3. If I had to form a climate policy Nukes would be #1 approach
“As for heller.
you probably dont know, but we have a history. Like when he got booted form this site for basically refusing to admit he was wrong and other misdeeds
fact is he is pretty much a cheat when it comes to data analysis ( hides tons of stuff, just look at his code)
Not gunna waste time, he is the skeptical version of mann”
That sounds reasonable, but I haven’t been able to source all of the politics around him, you, and why he was banned. If what you say is accurate, that is unfortunate. I’m going to reserve judgment on who is more honest because I don’t have the information to see what transpired and why.
I’m glad I came back and read what you said because I have impressions of how you interact, and I’m thinking half is my pre-conceived notion.
Ah yes, but there were number of Holocene highs which makes current highs of no consequence since we are on a down-trend on the millennial scale
http://www.vukcevic.co.uk/DownTrend.htm
have a happy the new, even warmer, life saving, CO2 increasing, vigorous plant growing, and a good will to all men & women 2019 year.
According to Jones et al. 2015, the Global Average Temperature (GAT) was 14.0°C using HadCRUT4’s 1961-1990 reference period (means for the globe, northern hemisphere, and southern hemisphere as 14.0°C, 14.6°C, and 13.4°C, respectively).
https://cdiac.ess-dive.lbl.gov/trends/temp/jonescru/jones.html
Jones et al. 1999
https://agupubs.onlinelibrary.wiley.com/doi/epdf/10.1029/1999RG900002
Steven,
In nominating 15.1C as a likely global average surface temperature, I am interested to know whether there is a margin of error in that from the berkeleyearth figures.
Essentially are we looking at 15.1C +/- 0.5C or is that figure incorporating any margin of error?
Next, in 2013 the late Professor Bob Carter wrote in “Taxing Air”-
“ The longest established ground temperature record, termed the Central England Temperature Index ( CETI), starts in 1659, which was soon after the invention of the thermoscope but before the Fahrenheit scale came into use. This 353 year long data is archived by the British Meteorological Office and was analysed recently by the Scottish Scientist Wilson Flood. Because of the depressed temperatures that occurred in the late 17th Century as part of the celebrated Maunder Minimum, the overall CETI record does demonstrate a slight overall warming since then. Slight long term warming trends are also present in seven other long Northern Hemisphere records that date back to the late 18th or early 19th Century….It should be noted however that none of these records have been corrected for the Urban Heat Island effect.
When the CETI record is examined more closely however, Wilson notes that:
‘The average CET summer temperature in the eighteenth Century was 15.46 C while that for the twentieth century was 15.35C. Far from being warmer due to assumed global warming, comparison of actual temperature data shows that UK summers in the twentieth century were cooler than those of two centuries previously.’”
I would be interested in your comments as I respect your views.
“Estimated Jan 1951-Dec 1980 global mean temperature (C)
% Using air temperature above sea ice: 14.185 +/- 0.046
% Using water temperature below sea ice: 14.730 +/- 0.046
for the end of 2017 you have to add 0.833 +- 0.045
several things to note. I am not particulary fond of the “global average” since it is actually an index. A mixture of SST and SAT. Next, the uncertainty is rarely understood properly.
The Index is a PREDICTION of what you would measure at all the UNMEASURED places
using a perfect instrument. Explaining what it is looses most people.
CET.
Wilson Flood?
only found this
http://carbon-sense.com/2009/10/01/british-record/
hard to comment without seeing a full write up with code and data. It would be unfair to him to comment without seeing his actual work.
In general, don’t expect to understand the globe by studying an island.
Island stations, coastal stations especially those in large bays.
all fun and challenging, but not particularly helpful in predicting what you would measure in unmeasured locations.
Now plot that 0.25 C. difference on a vertical scale in increments of thousandth’s of degrees, where each .001 degree measures a fourth of an inch, so that the visual will show a steep rise on the paper of six or so inches.
In the time it took me to type this, I just aged an alarming amount.
We all got two feet older.
My two feet are always getting older. The rest of me as well. Usually at the same rate.
That’s only true when I’m lying down. When standing my feet are actually getting older a little bit slower than the rest of me.
It was 15C about 120 years ago according to Arrhenius.
15 C is what was calculated the world temperature to be when co2 levels were 280 ~ 285 ppm/v.
Yes, and that’s about what it is now with CO2 at ~410 ppm. Theory doesn’t agree with reality, but with error and uncertainty it’s questionable that we could even see a change.
There is no such thing as a global temperature – temperature is an intensive property.
Thank you for pointing this out. The so-called “global mean temperature” is a statistic, which happens to carry the dimensions of temperature, but it is not the thermodynamic temperature of anything, anywhere, at any time. And its value depends on just which “average” you choose to compute. Even if you have perfect data from everywhere.
Agreed. Still if we’d only had artificial satellites a hundred years ago we would know whether it is really warming. Certainly it’s warmed a little over the past 40 years but it cooled for about 40 years before that.
R Shearer wrote:
“Certainly it’s warmed a little over the past 40 years but it cooled for about 40 years before that.”
This is a very important point.
Fossil fuel consumption (and reportedly also atmospheric CO2 concentration) strongly accelerated starting about 1940.
Then the world COOLED until the Great Pacific Climate Shift of 1977.
Then the world warmed a little, and that warming was distributed over a decade or more by two century-scale volcanoes, El Chichon and Pinatubo.
Then global temperatures were near-flat for another decade or more during The Pause.
All this time, atmospheric CO2 concentrations reportedly increased – so THE CORRELATION OF CO2 WITH GLOBAL TEMPERATURE IS NEGATIVE, POSITIVE AND NEAR-ZERO.
That is all the evidence anyone needs to know that CO2 IS NOT THE PRIMARY DRIVER OF GLOBAL TEMPERATURE.
Regards, Allan
Post Script:
Yes, use of CAPS means (in this case only) that I am shouting, because the warmists are far too stupid or corrupt to hear anything this sensible.
R. Shearer wrote: “Certainly it’s warmed a little over the past 40 years but it cooled for about 40 years before that.”
A bit of a difference between the rates of cooling and warming, however!
1939-1979 – trend of -0.0009
1979-2018 – trend of +0.019
http://www.woodfortrees.org/plot/best/from:1939/to:1979/trend/plot/best/from:1979/to:2018/trend/plot/best/trend
JMurphy – You cited BEST temperatures – but BEST is not that good.
Nether are other Surface Temperature measurements.
View this animation of the warmists’ reduction/elimination of the global cooling period from ~1940 to ~1975:
This is my main gripe with people that continue to buy into this CAGW/AGW myth:
They continue to roll out adjusted, corrupted, unreliable data as if it were from the most holy on high. It is very similar to the Bible. Lot’s of different authors, unreliable translations, adjustments, different interpretations… yet the exoteric believers tout it as direct word of god. Well, it is the same friggin thing with global temp data sets. Corrupted and unreliable beyond recognition yet we’re still arguing about .x degrees C?! Seriously?
with all the in-filling across large swaths of land (basically faking data), temperature adjustments, satellite inconsistencies, inconsistencies in previous records with data collection, siting, UHI, weighting… come on. How can anyone consider themselves doing actual science working with such egregiously unreliable data? I’m not a scientist of any sort and I can see through this farce.
It is an exercise in ego, pure and simple. Unrealistic, self-deceiving sophistry. Both sides just want to win and it appears we’re all willing to use whatever data we need to win. Well, the data sucks so let’s drop it. We know the intent of the UN and world leaders because they are pushing for global carbon tax, based on bad science, for nothing other than more control and eugenics. It is tiresome to see these fanciful numbers being touted as gospel.
But to act on this truth would disable lots of careers and reputations instantly.
Can’t have that.
Stop and think for a moment.
After all these years, the global temperature anomaly is 0.25C – you can’t even feel a change 0.25C.
And we are supposed to destroy our energy systems, our economies and our society because of 0.25C warming?
Global warming alarmism is promoted by scoundrels and believed in my imbeciles – it is biggest scam in human history.
As usual, thank you Alan for an accurate description of the situation.
I already appreciate your comments
The long term trend is even lower. It is still 0.13C per decade or 1.3C per century. Of that the maximum possible effect of CO2 is 0.18 C since 1950. The effect of CO2 might be ZERO but we know its maximum possible effect.
http://applet-magic.com/cloudblanket.htm
Clouds overwhelm the Downward Infrared Radiation (DWIR) produced by CO2. At night with and without clouds, the temperature difference can be as much as 11C. The amount of warming provided by DWIR from CO2 is negligible but is a real quantity. We give this as the average amount of DWIR due to CO2 and H2O or some other cause of the DWIR. Now we can convert it to a temperature increase and call this Tcdiox.The pyrgeometers assume emission coeff of 1 for CO2. CO2 is NOT a blackbody. Clouds contribute 85% of the DWIR. GHG’s contribute 15%. See the analysis in link. The IR that hits clouds does not get absorbed. Instead it gets reflected. When IR gets absorbed by GHG’s it gets reemitted either on its own or via collisions with N2 and O2. In both cases, the emitted IR is weaker than the absorbed IR. Don’t forget that the IR from reradiated CO2 is emitted in all directions. Therefore a little less than 50% of the absorbed IR by the CO2 gets reemitted downward to the earth surface. Since CO2 is not transitory like clouds or water vapour, it remains well mixed at all times. Therefore since the earth is always giving off IR (probably a maximum at 5 pm everyday), the so called greenhouse effect (not really but the term is always used) is always present and there will always be some backward downward IR from the atmosphere.
When there isn’t clouds, there is still DWIR which causes a slight warming. We have an indication of what this is because of the measured temperature increase of 0.65 from 1950 to 2018. This slight warming is for reasons other than just clouds, therefore it is happening all the time. Therefore in a particular night that has the maximum effect , you have 11 C + Tcdiox. We can put a number to Tcdiox. It may change over the years as CO2 increases in the atmosphere. At the present time with 409 ppm CO2, the global temperature is now 0.65 C higher than it was in 1950, the year when mankind started to put significant amounts of CO2 into the air. So at a maximum Tcdiox = 0.65C. We don’t know the exact cause of Tcdiox whether it is all H2O caused or both H2O and CO2 or the sun or something else but we do know the rate of warming. This analysis will assume that CO2 and H2O are the only possible causes. That assumption will pacify the alarmists because they say there is no other cause worth mentioning. They like to forget about water vapour but in any average local temperature calculation you can’t forget about water vapour unless it is a desert.
A proper calculation of the mean physical temperature of a spherical body requires an explicit integration of the Stefan-Boltzmann equation over the entire planet surface. This means first taking the 4th root of the absorbed solar flux at every point on the planet and then doing the same thing for the outgoing flux at Top of atmosphere from each of these points that you measured from the solar side and subtract each point flux and then turn each point result into a temperature field and then average the resulting temperature field across the entire globe. This gets around the Holder inequality problem when calculating temperatures from fluxes on a global spherical body. However in this analysis we are simply taking averages applied to one local situation because we are not after the exact effect of CO2 but only its maximum effect.
In any case Tcdiox represents the real temperature increase over last 68 years. You have to add Tcdiox to the overall temp difference of 11 to get the maximum temperature difference of clouds, H2O and CO2 . So the maximum effect of any temperature changes caused by clouds, water vapour, or CO2 on a cloudy night is 11.65C. We will ignore methane and any other GHG except water vapour.
So from the above URL link clouds represent 85% of the total temperature effect , so clouds have a maximum temperature effect of .85 * 11.65 C = 9.90 C. That leaves 1.75 C for the water vapour and CO2. CO2 will have relatively more of an effect in deserts than it will in wet areas but still can never go beyond this 1.75 C . Since the desert areas are 33% of 30% (land vs oceans) = 10% of earth’s surface , then the CO2 has a maximum effect of 10% of 1.75 + 90% of Twet. We define Twet as the CO2 temperature effect of over all the world’s oceans and the non desert areas of land. There is an argument for less IR being radiated from the world’s oceans than from land but we will ignore that for the purpose of maximizing the effect of CO2 to keep the alarmists happy for now. So CO2 has a maximum effect of 0.175 C + (.9 * Twet).
So all we have to do is calculate Twet.
Reflected IR from clouds is not weaker. Water vapour is in the air and in clouds. Even without clouds, water vapour is in the air. No one knows the ratio of the amount of water vapour that has now condensed to water/ice in the clouds compared to the total amount of water vapour/H2O in the atmosphere but the ratio can’t be very large. Even though clouds cover on average 60 % of the lower layers of the troposhere, since the troposphere is approximately 8.14 x 10^18 m^3 in volume, the total cloud volume in relation must be small. Certainly not more than 5%. H2O is a GHG. Water vapour outnumbers CO2 by a factor of 50 to 1 assuming 2% water vapour. So of the original 15% contribution by GHG’s of the DWIR, we have .15 x .02 =0.003 or 0.3% to account for CO2. Now we have to apply an adjustment factor to account for the fact that some water vapour at any one time is condensed into the clouds. So add 5% onto the 0.003 and we get 0.00315 or 0.315 % CO2 therefore contributes 0.315 % of the DWIR in non deserts. We will neglect the fact that the IR emitted downward from the CO2 is a little weaker than the IR that is reflected by the clouds. Since, as in the above, a cloudy night can make the temperature 11C warmer than a clear sky night, CO2 or Twet contributes a maximum of 0.00315 * 1.75 C = 0.0055 C.
Therfore Since Twet = 0.0055 C we have in the above equation CO2 max effect = 0.175 C + (.9 * 0.0055 C ) = ~ 0.18 C. As I said before; this will increase as the level of CO2 increases, but we have had 68 years of heavy fossil fuel burning and this is the absolute maximum of the effect of CO2 on global temperature.
So how would any average global temperature increase by 7C or even 2C, if the maximum temperature warming effect of CO2 today from DWIR is only 0.18 C? This means that the effect of clouds = 85%, the effect of water vapour = 13.5 % and the effect of CO2 = 1.5%.
Sure, if we quadruple the CO2 in the air which at the present rate of increase would take 278 years, we would increase the effect of CO2 (if it is a linear effect) to 4 X 0.18C = 0.72 C Whoopedy doo!!!!!!!!!!!!!!!!!!!!!!!!!!
Has anyone shown that DWIR warms a water surface?
Warm(er) air over a water surface increases evaporative cooling of that water.
Seems that ~75% of the surface of the Earth covered by water would be cooled by a warmer atmosphere.
Ian, yes they have and if I remember correctly it doesn’t.
The experiments were conducted a few years and published on yet another site banned on here.
I may be able to find them.
Yes. I have three precision ASTM thermometers in my basement all within a couple of inches of each other. For grins, I just took a quick recording of each. The average was 19.96C with a standard deviation of 0.153.
A man with one thermometer knows the temperature, a man with two thermometers is never certain.
I managed a Testing laboratory including Metrology for 20 years. Temperature calibrations/verifications proved most challenging. We verified and adjusted RTDs, thermocouples, liquid in glass thermometers, SPRTs using standard baths, fixed-point cells, NIST certified reference standards and triple point of water cells. The laboratory environment was temperature and humidity controlled IAW ANSI/NCSL and ISO requirements
I was amazed how two of a same type “thermometers” soaked and prepared identically could produce different measurement results.
I have little confidence in accuracy measurements made world wide in non-controlled environments.
I might add that I was amazed (disappointed) that many of my customers (esp. engineers, scientists and technicians) did not understand (nor seem to care about) the limitations of their instruments nor the time consuming uncertainty analysis which we provided.
Cynically, I figured they didn’t care about the actual measurements – they only wanted a calibration sticker to get past their “QC”.
Czechlist
Thanks for the practical observation.
Since the quality of the data is an essential ingredient when testing any hypothesis, I wonder if anyone has though of placing two land-based thermometers side by side (in separate screens or even in the same screen) to test whether, over any prolonged period, they showed identical “anomalies”. We know that they are unlikely to show identical temperatures.
Agree 100%
Isn’t 0.25 degrees within the error range?
Yes, that’s the part of the measurements that bothers me. Statistics can reduce the error in the mean, but that’s only precision. Putting aside the fact that they are NOT taking multiple measurements of the same thing at the same time and in the same place — which is what the statistics assume you are using them for — the end result is a reduction of the error in the mean, but in the accuracy of the measurement. If the thermometer is accurate to +/- 0.5 C, then all that number crunching can do is tell you the average temp is 0.3 C +/- 0.123 C; it doesn’t let you claim the average was 0.345 C +/- 0.123 C.
But we are at the threshold like we were a decade ago. And a decade before that. And a decade before that.
Always at a threshold of catastrophic global warming and always enough mildly aberrant weather events to make proclamations about it never being so bad in recorded history. The Climate Record will state that 2018 had the worst wild fires in recorded history.
Martin Hovland:
Who will? I did.
It makes NO DIFFERENCE to the trends, or to comparing one June to another June. What it DOES allow is comparing a January to a June, by removing the average seasonal differences: http://www.drroyspencer.com/2016/03/uah-v6-lt-global-temperatures-with-annual-cycle/
And it tells you that the average temperature of the lower troposphere, as defined by the weighting function used in the analysis, is about -9°C. Does that help?
Thanks for a great debate:
It just proves how far out on a branch we are.
What we have to remind everyone we meet, is that the warming they are touting about, is about 1.2 +- 0.2 degrees C over a time period of 160 years (e.g., since preindustrial time). It is pitifully naught, as we are probably still emerging from the LIA, as Mosher says.
Have a Great New Year ! 2019
Yes, the term “anomaly” is annoying… It not an “anomaly” as it’s not abnormal for temperature to deviate slightly from the average. It would be more objective to track a moving average and to try to see if we can find factors driving changes in this moving average.
Bernard, you’re right. The word “Anomaly” is a slippery alarmist trick. It slips in the idea that today’s temperature is “a departure from the normal”….. something is amiss; abnormal; to be concerned about. Measure almost any parameter in the natural world, including Michael Mann’s pulse rate, and it’ll be sometimes up and sometimes down. Is such variation worthy of comment and cause for alarm? If your research budget depends on scaring the general public, you betcha it is!
The only time Michael Mann’s pulse rate becomes really, really important is when it goes to zero.
BTW I don’t wish any ill will on Michael Mann.. if the comment came across that way.
Like Clarence Darrow, “I have never killed any one, but I have read some obituary notices with great satisfaction.”
It’s an “anomaly” because it represents a deviation from a reference value. An anomaly is not necessarily abnormal.
A gravity anomaly is not “abnormal.” It’s a deviation from the reference value. If gravity anomalies were abnormal, very little of the Earth’s gravity field would be normal…
You calculated Twet. have you tried Twat?
Just curious, are these gravity anomalies stable in time and space or can we observe them change in time?
It depends on your definitions of time and space.
Just take a location, say the Indonesian island of Kalimantan, are there detectable changes over a year, 5 years, 10 years? Could one see that boundary on the NW side of the island move much?
Time and space are actually dependent upon the observer’s movement in restaurants according to Douglas Adams
Try Dictionary.com:
https://www.dictionary.com/browse/anomaly
noun, plural a·nom·a·lies.
1. a deviation from the common rule, type, arrangement, or form.
2. an anomalous person or thing; one that is abnormal or does not fit in.
3. an odd, peculiar, or strange condition, situation, quality, etc.
“a deviation from the common rule, type, arrangement, or form”
In celestial mechanics, the terms true anomaly, eccentric anomaly, and mean anomaly refer to angles measured from periapsis to points on the actual elliptical orbit, or the reference circle, with true anomaly measured about the periapsis focus and the others about the center of the reference circle. There isn’t anything suggestive of abnormality in them. It’s just a term of art.
In management, it is called a “Difference” graph. The word is non-emotive and not designed to scare the reader into making rash and unthinking mistakes. Which is why climate activists always use the word “Anomaly”, because it is.
So, what are we going to do about these scientists trying to scare people about gravitational anomalies?
Exactement… Vive la Différence!
I’d prefer to go for Kelvin scale; with your guess of 14C, that would be 287K rising to 287.25K.
Martin Hovland,
“Who will be the first to tell us what the absolute global temperature is, instead of these silly anomaly numbers…. Shall we make a referendum. I will vote for 14.00 degrees C, and now it is up to: 14.25 degrees C.”
In the lower troposphere? I very much doubt it’s as warm as that.
Why not use Kelvin? If Kelvin is used and the vertical scale starts at zero the “fluctuation” in temperatures over the past forty years would appear as a straight, horizontal, line.
Yeah, and if we design speedometers in cars to use a scale that starts at 0 and goes to 100000000000 mph, “fluctuations” in speed over the past forty years would appear as a straight horizontal line, at what would look like approximately 0 mph.
But no one does that speed, but many use Kelvin, in the SB. Calculations depend on it.
“But no one does that speed”
And surface temperatures on earth never get even close to 0 Kelvin.
What is the point of graphing anyway? Is it to help people understand how much change there has been, or to present it on a scale that means they can’t derive that information visually because someone wants to try and give the impression that the change is unimportant, as if importance can be determined by how straight a line looks on a large scale.
Hoooray Martin!!
PLZ tell all the warmists to use a 30 year baseline from 1925 to 1955, oooooorrrrr use a long baseline from 1000 to 2000 and show the error margin.
But best bet, and we should compromise, you know , bi-partisan, and have the reports show absolute data as well as their own cherry-picked or “adjusted” data and let the reader figure out whatis going on.
Gums sends…
Why? Temperature relative to the baseline is the critical information.
The question is “which baseline?”. The global anomaly number is the product of a product of a product. Even if you use a raw thermometer reading from a single location in 1880 as your baseline you still have hundreds of built in assumptions.
Ideally, you want a presentation of data that clearly shows the relationship between baseline assumptions, measurements and adjustments to show how these interact. Just giving an anomaly number may be useful to the extent that the method has internal consistency, but doesn’t actually tell you all that much about the state or behaviour of the system, which is what you are trying study in the first place.
Darkwing
It has been demonstrated beyond doubt that man can survive between ~ -40°C and ~+50°C.
Somewhere in between mankind flourishes.
If -41°C and +51°C represent certain death, man won’t go there, which leaves ~70% (guessed) of the planet inhabitable and +1.5°C utterly irrelevant to those living between ~-35°C and ~+45°C.
Temperature anomalies are utter bollox and only of interest to naval gazing catastrophist’s who won’t present them on a representative scale because it would look like a flat line and terrify no one.
Most of us prefer, vastly so, to be much much nearer to the oasty toasty upper end of that range.
People go to the Badwater Basin and the Sahara desert to run ultra marathons lasting for days.
Yet to see any sporting events in which people, young and old, flock to the poles for days long tests of endurance.
Jack Dennison, who at the age of 70 and then 75 became the oldest person to finish the 135 mile race:
https://www.runnersworld.com/news/a20803719/an-80-year-old-grandfather-will-run-badwater/
Turns out I am wrong…there is a marathon held in Antarctica.
And at least one held at Amunsen station at the south pole.
And at least one in the Himalayas…although none of them are in Winter in those areas.
The Badwater race is held in July.
The Sahara leg of the four deserts race is in October.
Those people are nuts.
The I was thinking “Yeah, but I bet no one ever did a triathlon in freezing cold water, and came across this when I checked:
http://scribol.com/outdoor-sports/water-sports/swimming-in-the-coldest-waters-on-earth/
But I bet he had some warm blankies waiting for him.
Wonder what the coldest water anyone has swum in unprotected, and then got out and let themselves air dry with no blankets?
I was also recalling the video of the guy who lives in Alaska, a Caucasian, who is able to be outside in the most brutally cold weather with almost no clothing on.
While most prefer to vacation at the upper end of the temperature range, some prefer winter vacations in the north for snow sports and summer vacations to the southern beaches. We are adaptable. (personal note- I don’t go to Phoenix on purpose in August)
Believe it or not – check this out:
”In February 2009 Hof reached the top of Mount Kilimanjaro within two days wearing only shorts.[12] Hof completed a halfmarathon above the arctic circle in Finland, in temperatures close to −20 °C (−4 °F). Dressed in nothing but shorts, Hof finished in 5 hours and 25 minutes.” and ”Hof ran a full marathon in the Namib Desert without water, under the supervision of Dr. Thijs Eijsvogels.”
Wim Hof aka Ice Man,
https://en.wikipedia.org/wiki/Wim_Hof
Iditarod Sled Dog Race.
Remember, this desire to excel at extreme events in extreme locations is fundamental to human nature. People either attempt to prove to themselves, or prove to their peers, that they can do better. They refuse to accept the everyone shall be equal mantra and step outside the norm.
Humans want to succeed and their peers respect this.
Is it fair? Of course not. I barely swim and run at continental drift speed. These people are clearly superior athletes to me and I will in all likely hood never even equal them. Not completely fair is it, but this is how the world works and rather than spiteful jealousy I instead admire the abilities. If I want to share their fame I know I need to exceed at something else and know if I want to exceed then it is not going to happen by moaning about it.
This is how humans work.
Yet despite all this some people still believe the idea of Socialism is a Good Thing.
The baseline used for the anomaly calculation is the thirty year period 1981 to 2010. Relative to that baseline, the trend has been an increase of .13 C per decade, or about .5 C over the course of the 40 years that this data series has been available. I believe the methodology has been pretty consistent over that time period. This is discussed in more detail at Dr. Spencer’s website – at http://www.drroyspencer.com/latest-global-temperatures/
But if one looks at the plot much of the rise is coincident upon the aftermaths of the 1997/8, 2010 and 2015/16 strong El Ninos.
If one detrends ENSO, there is very little warming in the 40 years covered by this data set.
+10000
I don’t think that’s right. The trend line takes that into account. If there were no overall trend, we would just see peaks during an en nino then a return to below the baseline after. But that is not what has happened. The last el nino ended in 2016, and temperatures since then have all been well above the baseline (i.e. positive anomalies).
Temperatures fell well below the baseline after the 1982 – 83 el nino, and to a lesser extent after 1997-98. But following the most recent el nino temperatures have not fallen below the baseline. The long-term trend is an increase of .13 C per decade, independent of el nino’s. Let me know if this does not seem right to you. Thanks.
Should also take out the negative temperature effects of the 1980’s and 1990’s large volcanoes. That drops the trend somewhat.
David, it turns out that things like ENSO and volcanoes can be thought of as noise in the climate signal. When computing a linear trend the placement of that noise can have a big effect. For example, the fact our two major volcanic eruptions happened early in the data increases the trend. They also both happened during El Nino events which would have been very warm anomalies without the eruptions.
My own personal attempt at removing this noise drops the trend by half. I get about .06 C /decade.
Add to that the fact that we had 3-4 decades of cooling prior to the start of the satellite data and you end up with almost no warming at all over the past 80 years.
I get that, and the consistency is valuable, but I was responding to the claim that temperature relative to the baseline is the critical information. I would argue it doesn’t even constitute information at all without a thorough accounting for what that reference means in a comprehensive sense (i.e. energy balances, long term trends, etc.)
As far as I am concerned, the anomaly is just useful guide to orient yourself with respect to the data, but fundamentally conveys nothing of its own beyond the raw temperature and a set of assumptions which are subsumed in the selection.
That’s not to say it isn’t useful, but its use is very limited compared to actual temperatures. Or put it another way: Trend relative to A baseline is critical information, but trend relative to THE baseline is utterly without any value.
Sorry, comment got lost in the aether, hope it isn’t duplicated.
What I meant to say is that temperature relative to THE baseline is not critical information as the comment I was replying averred. That’s simply because the baseline is arbitrary from a whole host of perspectives at best, at worst it is an easy target for cherry-picking.
Temperature in reference to A baseline is useful only in that it orients you and the data with respect to historical data, which makes it easier to read. It fundamentally adds no additional information though. The baseline selection is not data in and of itself though, it is just a frame for data. Confusing these two things is a cardinal sin of analysis.
Baseline is subject to debate.
The word anomaly in the eyes of the common person has the connotation of being “bad”. So there is a propaganda word campaign as well as one lying with statistics.
Baseline is subject to debate.
The word anomaly in the eyes of the common man has the connotation of being “bad”. So there is a propaganda word campaign as well as one lying with statistics.
Graham, critical for what?
Humans do not feel “anomalies”, you could not even feel the difference 0.25C would make in a normal room, let alone out in the world where you have weather to contend with.
On a related topic, I notice that the last update for RSS v3.3 was to October 2018, timestamped November 2, 2018. RSS v4.0 is up-to-date, with December 2018 data posted January 1, 2019. Kiss RSS v3.3 good-bye.
Why remove the response to seasonal variability? This obfuscates how the system responds to change and its this response that’s crucial to the debate.
Understanding the per-hemisphere response to seasonal solar forcing is the best way to understand how the planet behaves in response to forcing. Both the ECS and TCS for each hemisphere can be measured by this response. The ECS is characteristic of the average response across a whole number of years while the TCS can be measured by the dynamic month to month response to variable solar input. The ECS is the same for both hemispheres (about 1.62 W/m^2 (0.3C) per W/m^2 of forcing) , while the TCS less in both and smaller in the S owing to a larger fraction of water. The measured average ECS is less than the 0.4C per W/m^2 claimed by the IPCC as the lower limit.
Of course, you must pay attention to the response in the energy domain, rather than in the non-linear domain of temperature, and use SB to convert a change in power density to a change in temperature at the end. Having done this, I can say with absolute certainty that any ECS in the range presumed by the IPCC has a 0% chance of being correct. I’ve heard all the counter arguments and not a single one is sufficient to dispute this.
All I can say is that this is such an obvious flaw in the IPCC’s presumed ECS that climate scientists on both sides should be horribly embarrassed, which is perhaps why climate science remains so broken.
My “Cold Curse” on the East is still working, but the best is yet to come. Brrrr!
https://weather.com/maps/ustemperaturemap
Happy New Year! It’s going to be a cold one!
Fully ~85% of global primary energy is from fossil fuels, unchanged in decades – and essential for the survival of you and your family.
_______________________________
https://wattsupwiththat.com/2018/11/17/will-the-snowiest-decade-continue/#comment-2521702
Fair warning: I’m calling down another very hard winter on the US Northeast, extending up into Canada.
The reason I’m doing this is that you deserve it. You continue to bleat about global warming, in a world that is about to get colder.
You continue to blather on about climate change and the need to eliminate fossil fuels – do that tomorrow and most of you will be dead within a month or two.
Fully 85% of global primary energy is fossil fuels and that number has not changed significantly in decades. Fossil fuel energy provides almost everything you need to survive in this complex world. It IS that simple!
So enjoy the bitter cold and snow this winter, good people, and maybe you will actually learn something.
Cold kills far more people then heat in the world today, probably about 2 million excess winter deaths per year.
Bundle up!
Allan, unfortunately Satellite data does not reflect what we experience on the surface, it is measuring the heat leaving the earth via the atmosphere.
We can also measure the temperature of cloud tops and the surface based on the received radiation and by applying a simple radiant transfer model. This is how we measure cloud top temperatures as seen in the weather forecast.
There’s no magic between the surface and space. All that is there is a semi transparent layer that allows some surface emissions to pass through immediately while the remainder of the surface emissions are absorbed and some (about half) is returned to the surface at a later time. HITRAN line based analysis can tell us this exactly. What we measure from space is the sum of the surface radiation passed immediately plus the delayed emissions of energy absorbed in the past.
AC – I posted surface temperatures, not satellite temperatures.
https://weather.com/maps/ustemperaturemap
Yes, allow me to clarify, what you posted and what Satellites show are 2 different things, the Satellites are no use whatsoever to tell us what is going on on the surface.
So using them you cannot predict anything about ice, snow or sub zero temps, which you can do with real Surface temps.
Have you looked at the “globe” posted by ren, it shows Northern US as 1.5C hotter than usual even though many surface low temps were broken during December, in fact have look at the values Dr Spencer posted for the USA for October, November & December.
“the Satellites are no use whatsoever to tell us what is going on on the surface.”
Not at all. The surface emits LWIR and the satellite sensors detect LWIR. All you need to know is the absorption characteristics between the surface and space and surface emissions can be established which can be converted into a surface temperature using the SB Law.
Far too many are confused thinking that the surface output is temperature. It is not. The surface output is LWIR.
So why don’t they publish those results instead of lower Trop.?
So that we compare them directly with Thermometer data?
AC,
“So why don’t they publish those results instead of lower Trop.?”
Because it would require them to admit that COE and the SB Law actually apply as both are required to reconstruct surface temperatures from emissions at TOA. I’ve validated this for ISCCP ell based data by first converting the reported surface temperatures (based on uwave measurements calibrated to surface thermometers) to emissions using the SB Law and by applying a radiant model based on HITRAN line data to those emissions, the proper amount of power is both leaving TOA to offset the solar forcing and returning the surface, which when added to solar input, offsets surface emissions. The same process works in reverse to reconstruct the surface temperatures from emissions at TOA. What also emerges from the analysis is that if X W/m^2 of surface emissions are absorbed by the atmosphere by clouds and GHG’s, about X/2 W/m^2 of this must leave the planet to offset solar input and the remaining X/2 W/m^2 is returned to the surface.
Keep in mind that obfuscation is they have to prop up the bogus science so they can rely on bombastic rhetoric justified with faulty models, rather than rely on the immutable laws of physics which don’t otherwise support an effect large enough to justify the UNFCCC.
I’ll say zero anomaly by August 2019.
Thank you AMO, ENSO, Blob, and solar minimum.
Best guess forecast is weak el Niño, so that likely bumps up the anomaly a little. https://iri.columbia.edu/our-expertise/climate/forecasts/enso/current/?enso_tab=enso-cpc_plume
The AMO decline is just getting started and that long cycle and recent turning point is new to the satellite record. Also think about what goes into detrending something that long.
http://www.climate4you.com/images/NOAA%20SST-NorthAtlantic%20GlobalMonthlyTempSince1979%20With37monthRunningAverage.gif
Resource Guy,
Also a good link. Any estimate on when your linked graph get the update for the December data?
The monthly update varies in timeliness. Just keep checking back on the WUWT ocean page.
Kevin,
Thanks for that link.
Any idea why the El Nino Climatology line is tracking so closely to the La Nina Climatology line when the La Nina probability is so much lower?
ResourceGuy
Frankly, I hope the anomaly goes up and bursts through the dreaded 1.5°C as soon as possible so the entire premise of CAGW is debunked ASAP.
Heavens to Betsy and Saints alive!
| You want us all to roast like baked potatoes, and have scalding sulfuric acid rain dissolve the dead leavings of our toasted corpses?
Menicholas
I’ll risk it.
My guess is that this happens sometime in 2020 after a long due La Nina in the fall of 2019.
ResourceGuy, you may be jumping the gun a bit. While the solar minimum is here, ENSO is currently positive as is the AMO. I don’t see the AMO going negative for a few years yet.
In fact, it’s a little curious that the Dec. value is so low given these facts. We should be seeing the current El Nino conditions pushing up the anomaly and enhancing the AMO. But still, getting to zero next year without a strong La Nina seems unlikely.
According to PART 8, “Climate Pattern Recognition in the Holocene (1600 – 2500 AD)”
in http://www.knowledgeminer.eu/climate-papers.html
the present continuing temp PLATEAU has exactly the +.25 °C value above baseline.
So we are on right track level for the coming years. No more increase, models
will get more wrong every coming year. Unfortunately, the past 2016 el Nino
figures for the modellers as temp increase bonanza, but now this is back to normal
level of +0.25C again.
Odd…. all this ‘warming’ hasn’t lowered my heating bills one bit!
The fitful natural warming trend since the LIA will continue, until natural cooling begins once again.
J Mac
“……..until natural cooling begins once again.”
Just wait until you see your fuel bills rise then…….all blamed on ‘climate change’ of course!
HotScot,
If I’m still alive when cooling really becomes a trend, I’ll fire up the chain saw, sharpen the axe and wedges, and put up an extra couple of cords of firewood each winter. I’m glad I put up 2.5 cords last spring, before I found out I was having double cardiac artery bypass surgery last October! Nothing like a hot wood stove on a cold, wet winter day in the Great NorthWet!
How’s the weather so far in Scotland this winter?
ooohhh, .13c/decade! for the past 40 years, that’s .52c since satellites started keeping track. unprecedented! catastrophic! gonna result in more fires, floods, tornadoes, droughts, famine, collapse of farming, hurricanes, melt all the worlds snow and ice, coastal flooding and see level rise!
OMG! run for the hills, move back into the caves!
jeeez.
we can only hope if warms another degree or two. it appears that a little warmer actually is a good thing.
There are some people that think the caves were a bad idea. We should never have left the trees.
There are those that think the trees were a bad idea, and we should never have left the oceans!
Personally I reckon the descendants of those are the mammals in the seas. There are an awful lot of them…
Funny how those graphs don’t go back further than 1979…..wonder why….maybe because it would show the higher temperatures that occurred in the 30’s-50’s……
If we had this same sort of data back an extra 100 years, there would never have been none of this global warming catastrophe malarkey to begin with.
Really? The first satellites to measure temperatures was launched in 1979.
This data is based on satellite measurements, which have only been available since 1979. I believe Dr. Spencer’s original hope was to show with that more accurate measurement there would be no observable warming. However, it turns out that his graph is very consistent with the longer-term measurements – for example, https://earthobservatory.nasa.gov/world-of-change/DecadalTemp, which also shows about .5 degree C of warming over the last 40 years, across multiple data sets.
So as you can see from many of these posts, the old denial argument that there is no warming (or that it stopped in 2000) isn’t used much anymore, because it is not supported by data. So the new denial argument is that the warming won’t be too bad. And once that is found to be false, in about 2050, the final denial argument will be “well, its now too late to do anything about it”.
So, tell us about this CAGW you are talking about.
How much has CO2 increased in the last 20 years and how much has the Temperature increased in the last 20 years?
You do realise that just like the Thermometer temperature record started during a cold period, the LIA, the Satellite era also started ina cold period when Scientists were talking about a new Ice Age.
Thanks – its a good question. I always appreciate comparing notes on this. I will show my math, and would appreciate knowing how you see this. I have not looked at the last 20 years specifically, until now, but it should be consistent with the longer term relationships. Let me know if any of my explanations are unclear:
– CO2 – per the Keeling curve, it has increased from about 365 ppm to 400 over the last 20 years (https://scripps.ucsd.edu/programs/keelingcurve/co2-graphs/ – scroll down to the full time series), or 35 ppm. This is pretty consistent with the recent rate of about 20 ppm per decade (and accelerating, as the Keeling curve shows).
– Temperature – Dr. Spencer’s trend is .13 C per decade, or .26 C over the last 20 years. This is generally consistent with NASA’s charts – https://earthobservatory.nasa.gov/world-of-change/DecadalTemp.
– Scientists at MIT and Princeton have estimated that temperatures will increase by about 2.5 C for a doubling of CO2, from 280 at the start of the Industrial Revolution to 560 (e.g. https://www.princeton.edu/geosciences/people/bender/CO2Sampling/climate.xml).
– 35 ppm is 12.5% of the 280 ppm increase. 12.5% times 2.5 C = .31 C, pretty close to the .26 C from Spencer’s trend line and the NASA data.
– So the last 20 years are about what would be expected. The scary thing to me is that we are adding CO2 at an accelerating rate, and so could easily pass the 2 C warming level within a few decades if we don’t start cutting CO2 fast.
Please let me know your thoughts on this, or any holes in the math. Thanks.
Passing the 2C level would merely get us back to where the world was during the Medieval Warm Period.
Why would anyone be afraid of that?
PS, The planet has been as much as 2 to 5 degrees warmer than it is today for about 95% of the last 10,000 years, and none of the bad things that disturb your sleep happened.
David, I assume that you are using Excel or some other package for the trend, so I let’s talk about temperatures.
Is it hotter this month than in 1987, 1990/91, 1995, 1998 or 1999, 2001-2005?
David Overton
CO2 is a lagging indice wrt ocean temperature, therefore it’s not driving ocean warming.
All calculations regarding CO2 ‘forcing’ are useless once this is understood.
Man-made emissions don’t even register compared to ocean outgassing.
The rise in temperatures is due to solar activity. There is no need to cut CO2.
David
You also need to compare the temperatures with the AMO index, as you see correlates fairly well. You might want to look into the AMO index from other sources. Some believe the Arctic Sea Ice extent will be influenced by the AMO.
http://www.euanmearns.com/wp-content/uploads/2015/09/hadamo.png
Mr. Webber, that plot on Dropbox is quite telling. Did you make it or do you have a reference?
Thank you RShearer. I made it. It confirms Humlum etal 2013, “The phase relation between atmospheric carbon dioxide and global temperature“. From their abstract:
“Passing the 2C level would merely get us back to where the world was during the Medieval Warm Period.”
Really?
I read that a lot here – and always in hand-wavy fashion.
Would you care to elucidate that with, err, evidence?
Here’s the latest scientific consensus…
http://sci-hub.tw/https://doi.org/10.1038/ngeo1797
“Past global climate changes had strong regional expression. To elucidate their spatio-temporal pattern, we reconstructed past temperatures for seven continental-scale regions during the past one to two millennia. The most coherent feature in nearly all
of the regional temperature reconstructions is a long-term cooling trend, which ended late in the nineteenth century. At multidecadal to centennial scales, temperature variability shows distinctly different regional patterns, with more similarity within
each hemisphere than between them. There were no globally synchronous multi-decadal warm or cold intervals that define a worldwide Medieval Warm Period or Little Ice Age, but all reconstructions show generally cold conditions between ad 1580 and 1880, punctuated in some regions by warm decades during the eighteenth century. The transition to these colder conditions occurred earlier in the Arctic, Europe and Asia than in North America or the Southern Hemisphere regions. Recent warming reversed the long-term cooling; during the period ad 1971–2000, the area-weighted average reconstructed temperature was higher than any other time in nearly 1,400 years.”
That you refute this study and all others in order to say the above, is, of course a self-fulfilling prophecy.
Very “scientific”.
You have a right to your own belief.
But not your own data.
One thing that you all have to remember about the Satellite data is that it is NOT measuring the temperature at the surface, it is measuring the brightness of the Atmosphere at the height where the Atmosphere averages -9.0C.
It is NOT what we experience at all and it is NOT the surface temperature.
But it is where the impacts of CO2 is to be mainly felt. Look at the IPCC CMIP5 model results for the tropical troposphere vs measurements; wildly different. The IPCC AR5 had to arbitrarily reduce “projected” temperatures over the next decade, admitting the models ran too hot.
2 things wrong with your opening comment “Here’s the latest scientific consensus…”
First of all it is a concensus, just as CAGW is a concensus, it is not evidence of anything.
Second how can 2013 be “the latest” of anything?
It is 5 years ago, there have many papers on the subject peer reviewed and printed since then.
I saw your reply to my comment, but there was not a way to reply to that one. You asked “Is it hotter this month than in 1987, 1990/91, 1995, 1998 or 1999, 2001-2005?”. I would respond that monthly (or yearly) ups and downs don’t really matter – there is lots of variability for lots of reasons over short time frames (natural variability, el ninos, etc.). That said, most of the hottest years on record are recent years, consistent with a general warming trend.
What matters is the long term trend and that is clearly increasing. This basically takes me back to my earlier post on the math. If you have any reactions to that, I would be interested. Thanks.
Once again, the alarmist wants us to believe that all warming, even if it is actually happening, is caused by CO2, and it’s gonna be bad. Someday.
I believe you are correct that temperatures have been much higher (and lower) in the past. But the concern about the two degree increase is the effect of the change itself. If mankind had developed in a 16 degree world, we would be fine. There would be no Miami, or much of Florida, and if there were a New Orleans it would be farther north than it is. Farming and people would be located in different places.
The problem is with the change – leading to sea level rise, changes in rainfall patterns, and movement of people. Some countries, such as Russia and Canada, will benefit, while the countries where most people now live will become less able to support their populations.
Much has been written about these concerns, for example http://dels.nas.edu/resources/static-assets/materials-based-on-reports/booklets/warming_world_final.pdf.
Are there sources that you believe support the idea that a 2 degree C increase in temperatures would not have a significant negative effect? I would appreciate knowing about them. Thanks.
About half of that 2 °C has already occurred. New Orleans has been in the same place for a very long time. The city was founded in 1718. The Earth’s average surface temperature has increased by about 1 °C since the city was founded. It’s still in the same place. Miami Beach has also not moved.
Sea level isn’t behaving any differently than it has throughout the Holocene.
Sea level was 1-2 meters higher than it currently is during the Holocene Highstand. All of the sea level rise since 1700 is insignificant relative to the natural variability of Holocene sea levels.
Sea level rise in the Miami area is not accelerating and it is rising at a rate of about 1 foot per century.
The mean sea level trend is 2.39 millimeters/year with a 95% confidence interval of +/- 0.43 mm/yr based on monthly mean sea level data from 1931 to 1981 which is equivalent to a change of 0.78 feet in 100 years. https://tidesandcurrents.noaa.gov/sltrends/sltrends_station.shtml?stnid=8723170
The mean sea level trend is 2.40 millimeters/year with a 95% confidence interval of +/- 0.15 mm/yr based on monthly mean sea level data from 1913 to 2016 which is equivalent to a change of 0.79 feet in 100 years. https://tidesandcurrents.noaa.gov/sltrends/sltrends_station.shtml?stnid=8724580%5B
The mean sea level trend is 3.63 millimeters/year with a 95% confidence interval of +/- 0.48 mm/yr based on monthly mean sea level data from 1971 to 2016 which is equivalent to a change of 1.19 feet in 100 years. https://tidesandcurrents.noaa.gov/sltrends/sltrends_station.shtml?stnid=8723970
The satellite data indicate virtually no statistically significant sea level rise in the Miami area:
CU Sea Level Research Group University of Colorado http://sealevel.colorado.edu/content/interactive-sea-level-time-series-wizard?dlat=26&dlon=280&fit=n&smooth=n&days=60
I intentionally retained the “seasonal terms and mean” and did not smooth the data because the seasonal variability is real and at least 10 times the magnitude of any secular trends in sea level.
To the extent that there is a trend (R² = 0.0945), the rate of sea level rise in the Miami area is about 3 mm/yr. This would lead to about 5.5 inches of sea level rise over the next four decades.
Miami FL Area Sea Surface Height (cm). Data from CU Sea Level Research Group University of Colorado. http://sealevel.colorado.edu/cgi-bin/table.cgi?q=content%2Finteractive-sea-level-time-series-wizard&dlat=26&dlon=280&fit=n&smooth=n&days=60
A review of USGS topographic maps reveals very little in the way of inundation by rising seas:
Miami Beach, Florida topographic maps from 1950 and 1994.(USGS).
Miami Beach topographic maps for 1950 and 1994. Note that the 5′ elevation contour has not shifted (USGS).
Miami Beach, Florida topographic maps for 1994 and 2012. The 2012 map has no 5′ contour because it has a 10′ contour interval. However, it is abundantly obvious that Florida is not being inundated.
Topographic profile A-A’. The NOAA sea level trend has been plotted at.the same vertical scale.
The global warming trend is driven by slightly warming winter temperatures in the higher latitudes. A global catastrophe this does not make.
The global warming trend is driven by slightly warming winter temperatures in the higher latitudes. A global catastrophe this does not make.
DavidO, last time I checked, mankind was around for the entirety of the last 10,000 years.
Warmer temperatures mean a wetter world and a much longer growing season. All good for man. More CO2 also means plants can handle both less water and warmer temperature all the while growing faster and bigger.
What’s not to like.
Mark – I was interested in your comment – “Passing the 2C level would merely get us back to where the world was during the Medieval Warm Period.
Why would anyone be afraid of that?
PS, The planet has been as much as 2 to 5 degrees warmer than it is today for about 95% of the last 10,000 years, and none of the bad things that disturb your sleep happened.”
I have not been able to locate long-term temperature reconstructions that show such a large increase in the last 10,000 years. The graphs at https://www.theatlantic.com/technology/archive/2013/03/were-screwed-11-000-years-worth-of-climate-data-prove-it/273870/ are typical – showing a variation of just .5 C or so. On that basis, a change of 2 degrees C would be well beyond anything in the last 10,000 years. Can you provide links to temperature reconstructions that show the larger variations? I would appreciate it. Like you, I am just trying to figure this out, and the historical comparisons would be important to consider. Thanks.
Mark – I wanted to follow up on your comment about temperatures over the past 10,000 years. I had not focused much on that, but it seems an important point – is what we are now experiencing unusual relative to the past? From the reconstructions I can find, however, there is little evidence that temps have been much higher over the past 10,000 years than they are now.
One longer term chart that received a lot of attention on WattsUp is at https://wattsupwiththat.com/2016/09/29/earths-obliquity-and-temperature-over-the-last-20000-years/. It shows that temps have never been more than a few 10ths of a degree C higher than current levels. It also shows that the current rate of change is pretty unusual.
Are there other reconstructions that you believe show a different comparison? Interested in anything you can share. Thanks.
You can’t directly compare reconstructions to instrumental data. The proxy-based reconstructions have lower temporal resolution. While the climate may have warmed by 0.2 to 0.4 °C more than what might be expected to occur in a 100% natural warming phase of the millennial cycle, all of the apparent excess warming may very well be due to resolution differences between the instrumental and proxy data. The lower frequency of the proxy reconstruction signal attenuates the amplitude response.
Ljungqvist (among other reconstructions) demonstrated that the modern warming has not unambiguously exceeded the range of natural variability. The bold black dashed line is the instrumental record. I added The red lines to highlight the margin of error. According to Ljungqvist…
[…]
[…]
Ljungqvist is recommending caution in comparing the modern instrumental record to the older proxy reconstructions because the proxy data are of much lower resolution. The proxy data are showing the “minimum of the true variability on those time-scales.” Ljungqvists’s and other 2,000-yr reconstructions probably have an overall temporal resolution of 10-20 years.
Ljungqvist, F.C. 2009. N. Hemisphere Extra-Tropics 2,000yr Decadal Temperature Reconstruction. IGBP PAGES/World Data Center for Paleoclimatology Data Contribution Series # 2010-089. NOAA/NCDC Paleoclimatology Program, Boulder CO, USA.
Ljungqvist, F.C. 2010. A new reconstruction of temperature variability in the extra-tropical Northern Hemisphere during the last two millennia. Geografiska Annaler: Physical Geography, Vol. 92 A(3), pp. 339-351, September 2010. DOI: 10.1111/j.1468-459.2010.00399.x
Longer multi-proxy reconstructions, like Marcott et al., 2013 have even lower temporal resolution, on the order of 100-400 years. The instrumental record would be averaged down to a single data point at this resolution. The authors of Marcott et al., 2013 acknowledged this… Yet they still included a hockey stick at the end of their reconstruction, which they described as “not statistically robust.”
Dot Earth Blog
Even with the acknowledgement that the “uptick” was not statistically robust, Dr. Shakun then proceeded to say that their conclusions were not based on the uptick, but on a comparison of high frequency instrumental temperature data to their low frequency Holocene temperature reconstruction… Which is even worse than relying on the uptick.
I genuinely believe that these folks simply can’t grasp the concept of resolution. This is a pervasive problem in the climate “science” community and will continued to feed claims of “unprecedented” changes in [fill in the blank] until we have about 1,000 years of high resolution instrumental data.
WUWT contributor Andy May put together a spectrally consistent, statistically robust, high resolution, Holocene climate reconstruction.
It’s not possible to integrate or even compare the instrumental data to this reconstruction. It has a resolution of about 100 years. However, two things are very clear: 1) The Little Ice Age was the coldest period of the Holocene and 2) The Modern Warming began well-before humans began burning fossil fuels on a large scale.
Dr Spenser’s original hope was merely to get an accurate satellite measuring system up and running, not to show no warming, please.
Spencer has consistently argued that climate sensitivity is much lower than most scientists believe. In his book, he says ““A careful examination of the satellite data suggests that manmade warming due to a doubling of atmospheric carbon dioxide could be less than 1ºC – possibly much less.” However, his own data shows a relationship much closer to the estimates from MIT and Princeton, of 2.0 to 3.0 C for a doubling of CO2. (e.g. https://www.princeton.edu/geosciences/people/bender/CO2Sampling/climate.xml)
In the 40 years of his data, we have seen a temperature increase of .52 C, and a CO2 increase of about 70 ppm ), equivalent to about 2.1 C for a doubling of CO2 (280/70*.52) – closer to the mainstream estimates than to Dr. Spencer’s.
I really don’t know what Dr. Spencer wanted to show, but it is clear what his data does show – steadily increasing temperatures over time, with a relationship to the change in CO2 that is far greater than 1 degree C for a doubling of CO2. Do you see the relationship differently? I am always interested in other perspectives on this. Thanks.
“I really don’t know what Dr. Spencer wanted to show,”
Then why did you claim that you did?
PS: Your claim that most scientists disagree with Dr. Spencer regarding sensitivity is just another lie.
All of the actual science shows that sensitivity is much lower than the figure the IPCC uses. The only place those large sensitivities can be found are the climate models, and they were written with large sensitivities as their starting assumption.
PS, I just love the way you once again assume that all of the warming of the last 50 years must have been caused by CO2. Even the IPCC isn’t willing to lie that big.
Dr. Spencer’s sensitivity estimate was derived from radiation balance calculations, not a simple crossplot of CO2 and temperature. A crossplot of UAH 6.0 with MLO CO2 yields a climate sensitivity (TCR) of 1.82 °C per doubling of CO2, about 1/2 of the so-called consensus value. Of course, this assumes that all of the warming in the UAH time series was driven by CO2.
Great! All of the temperature increase over the past 40 years is caused by CO2. There is no AMO, PDO, etc.
When you are going to invent a lie, might as well go all out.
I clearly said it is what I believe (that Dr. Spencer wanted to support his long-standing claim that climate sensitivity is significantly lower than most scientists believe). Why do you have to use a disparaging word like “lie”? If you will look at my posts, I have tried hard to be factual and respectful. Is it possible for us to have a dialog at that level? If you are willing to apologize for the lie accusation, I would like to respond to your comment about the mainstream view of climate sensitivity. But not if you are going to just throw insults. I am serious about this – if we cannot discuss this with facts and respect we are in big trouble. Do you agree with that? Let me know – thanks.
So what you believe trumps data. Nice work if you can get it.
And Dr. Spencer has supported his contention regarding climate sensitivity.
Unlike the IPCC which only has computer models to support their beliefs.
As to your posts, you keep posting your beliefs as if they were proven facts, and then when called on it, partially retract them.
Mark – sorry to repeat my question, but do you believe we can have a respectful dialog about climate change? I really believe that if we were discussing this in a Starbucks together, you would not throw around words like “lie” or sarcastic remarks like “nice work if you can get it”. Please think about how you want to have conversations like this. It is clearly something you care about, and I believe it is important that people with different views be able to share them in a reasoned, respectful way. I always try to do that. If you think we can discuss this respectfully by comparing facts and logic, I am interested. Let me know. Thanks.
Mark, as I indicated, I would like to compare notes with you on climate sensitivity. Multiple sources estimate 2.5 – 3.0 degrees for a doubling of CO2. And, the 2.5 – 3.0 estimate is consistent with the increase observed so far – roughly 1 degree C for a 40% increase in CO2 (from 280 ppm to approx. 405ppm), and with the increase over shorter time frames such as the last 20 years. Changes in sun radiation would actually have a cooling effect over the past several decades, so the impact of other factors is even larger than the temperature change would indicate.
I would be interested in knowing what you believe is the most reliable source for the lower sensitivity estimate. I know a lot has been published on this (Curry and Lewis, etc.) but interested in what you find most convincing. I will read it. Thanks.
Will the World be warmer than it was during the MWP or the Roman Warm Period?
Yes, hopefully as soon as within the next 1000 years.
From what I have been able to find, the variations in the “Roman” and “Medieval” warming periods were smaller than the increases we are creating in the next few decades – they were on the order of 1 Degree C, and we are moving past that with no end in sight as long as we continue to increase CO2 levels. For example at our current emissions levels we are likely to exceed 2 degrees C warming by 2050 or 2060. Would appreciate your thoughts on this. (source – http://www.globalwarming.org/2012/07/26/is-todays-climate-warmer-than-the-medieval-and-roman-warm-periods/).
You do know that it is projection and also the fact that it has cooled 0.5C in just 2 years?
Why don’t you try projecting that ahead instead?
What that would show is much more worrying than a degree warmer.
“David Overton January 3, 2019 at 11:14 am
From what I have been able to find,”
seek and ye shall find … exactly what you want to find. That doesn’t mean what you find isn’t indistinguishable from cow paddies
“well, its now too late to do anything about it”.
Weren’t we supposed to be at that point several times already? Every five years we get a five year extension. In 2050, we will STILL be hearing, “we have five year to act before catastrophe becomes inevitable.”
David, sorry but you are flat out wrong. There’s been no climate warming since 2000. You are confusing the recent ENSO influence on trend computations with the actual climate trend. Silly mistake.
http://www.woodfortrees.org/plot/uah6/from:1996.66/to/plot/uah6/from:1996.66/to:2014.66/trend/plot/uah6/from:2014.66/to:2016.12/trend/plot/uah6/from:2016/to/trend
David has claimed several times that all warming over the last 100 years is 100% caused by CO2, therefore there are no such things as El Ninos.
That is because between ENs come LNs.
They are cyclic.
the heat of ENs transfers to the atmospher from the Pacific equatorial waters, and going into them in LN years.
cyclic
Zero-sum.
If ENs where heating the atmosphere more than LNs are cooling it then you would expect that the oceans would cool also.
Yes?
As in the conservation of energy.
Unless you propose that they get their heat from something other than the Sun.
They are not cooling.
They are in fact receiving/storing 93% of the climate systems energy.
https://www.researchgate.net/figure/ocean-heat-content-oHC-changes-from-1960-to-2015-for-different-ocean-basins-for-0-2-000_fig5_325408846
I am glad that you agree that it is the sun and not CO2.
Like most alarmists, Anthony loves to simplify things past recognition.
The fact that both EN and LNs exist is meaningless and does not prove that they are in any way cyclical.
You can have multiple ENs in a row, you can have multiple LNs in a row. You can also have a strong EN followed by a weak LN, or vise versa.
As to what’s happening with the temperature of the oceans, despite the lies of the alarmists, we really don’t know. We would need to increase the number of sensors being used by a factor of 1 million or so before we could start to say with any range of certainty what the current temperature of the ocean is.
“I am glad that you agree that it is the sun and not CO2.”
Increasing CO2 is slowing the oceans ability to cool.
Same as with the atmosphere.
The energy comes from the Sun.
If it is true it does not work at all well, as evidenced by the fall in temperature every night in Dry Desert Areas, they are the closest to the Moon in Diurnal temperature swings.
I don’t think I have claimed that CO2 is responsible for all warming. And there are certainly El Nino’s, and their effect on temperature is very clear. You can see it in Dr. Spencer’s graphs.
However, I do believe the increase in CO2 is the biggest driver of climate change over long time periods (see for example https://www.ucsusa.org/global-warming/science-and-impacts/science/CO2-and-global-warming-faq.html#.XC934lVKipo). It is also persistent in the atmosphere for a long time. CO2 levels are now over 40% higher than they were at the start of the industrial revolution (400+, vs. 280), and climbing by 20 – 25 ppm per decade.
Do you believe there are other causes of climate change that are as significant as the increase in CO? I would be interested in your thoughts on what is causing climate change, because that has a large bearing on solutions.
Anthony Banton, I agree that over a very long period (millennia) we are likely to see ENSO to be zero sum. However, over the short term (many decades) that is not true. All you have to do is look at various trends and you will see big changes based on exactly when you start and end the trends.
It is obvious from my chart that there was no warming for around two decades right up to the super El Nino. It is also evident we have returned to levels very near where we were at in 2014.
Sure, you can create a trend that look like it is going upward by including the super El Nino. Why anyone would do that is beyond me. Do you enjoy fooling yourself?
David Overton ,
“Do you believe there are other causes of climate change that are as significant as the increase in CO2?”
For me the answer is clearly … yes. Over the short term we have the influence of the AMO and over the long term there is the Millennial cycle. Of course, there are other ocean cycles as well as solar influence.
The combination of these cycles could be responsible for 100% of the warming. This makes it impossible to determine if CO2 is having any effect at all.
The lack of any strong effort to understand ocean cycles within the field of climate science is one reason I don’t consider the field to be real science. In fact, there was as strong effort to kill research funding for Dr. William Gray when he was looking into ocean currents.
You can always pick a high point in the past – like the en nino in 1998 – and compare it to a non-el nino sometime later and show a flat line. But that is not comparing apples to apples. We are not in an el nino now. If you look at the trend over time, it has been increasing, and that has not changed since 2000.
Here is a pretty good article on the discussion about the possibility of a “slowdown” since 2000 – https://www.scientificamerican.com/article/did-global-warming-slow-down-in-the-2000s-or-not/. Even if slower than the prior decade, warming from 2000 – 2010 was .11 C, and of course recent years have seen several record temperatures.
Dr. Spencer currently estimates long-term warming at .13 C per decade. I was curious what that estimate was 20 years ago. It is hard to find his anomaly reports from prior years, but I did find one for 1996. Interestingly, in 1996, Dr. Spencer and Dr. Christie stated: “For the 18 years, however, there is no evidence of global warming in the revised data. The temperature trend for that time is a cooling of 0.035 degrees Celsius (about 0.06 degrees Fahrenheit) per decade.” So since then the trend line has changed from cooling (over an 18 year period) to warming of .13 C over the longer timeframe. That is unlikely without some warming since 1996, since that 18 year period and the 22 years since 1996 comprise almost the entire time that Dr. Spencer has been measuring temperatures. Interested in your thoughts.
What conditions are necessary to say the pause has resumed?
Zero trend or falling for 15 years or more.
Current pause, eyeballed is about 2 years and non significant. Really need to get back to a trend line flat from 1998, one good big La Niña would do it even though it would be cheating to count it. Makes up for the El Nino’s.
The pause never stopped. People need to get out of their heads the idea that a linear trend through noisy data is meaningful. It might be if all the noise cancels out but that is not even close to the case with temperature data.
Look at the SH SST data for the last 22 years. It probably has the least amount of noise. There’s no logical reason it shouldn’t be tracking the climate signal fairly closely. Note what the signal looks like if you treat the recent super El Nino as noise and use separate trend lines to describe it.
http://www.woodfortrees.org/plot/hadsst3sh/from:1997/to:2018.66/plot/hadsst3sh/from:1997/to:2014/trend/plot/hadsst3sh/from:2014/to:2016.2/trend/plot/hadsst3sh/from:2016/to:2018.66/trend
A reported anomaly of +0.25 deg C is meaningless without an estimate of the accuracy (e.g., +/- one sigma values) of the measurements used to quantify that anomaly. I seriously doubt the UAH satellite measurements of the temperature of the “lower atmosphere” when expanded to a weighted-average over the entire surface of the Earth will have a one-sigma accuracy of even 1 deg C, let alone 0.25 deg C.
In other news, it has been reported that exactly 11,267 fairies can dance on the head of a pin.
11,266– one fell off
michael
“I seriously doubt the UAH satellite measurements of the temperature of the “lower atmosphere” when expanded to a weighted-average over the entire surface of the Earth will have a one-sigma accuracy of even 1 deg C, let alone 0.25 deg C.”
If that’s the case I’d have to wonder why nearly every month has been within 0.5°C of the trend line, and no month has been over 1°C away from the trend.
Amusing, is it not, that governments spend astronomical sums of taxpayers funds alleviating or “combatting” the effects of so-called “climate change”, particularly as presented by charts such as the one in the post by Roy Spencer. Yet no such energy goes into controlling, let alone reducing government debt, which has ballooned beyond imagining. Both the action regarding the one matter and the inaction regarding the other depend upon huge numbers of people believing various claims reckoned “scientific”.
I very much doubt that history as a discipline will survive the present age, which is a shame because the behavioural questions thrown up by “authorities” today should provide grist for any number of historians’ mills.
The warmest is in the Arctic.

Sorry. The warmest is in Australia.
Yep, GLORIOUS weather down here on the central NSW coast.
Apparently rather warm inland…
but heck, that never happened before, did it 😉
On January 5, a small polar vortex will separate in the stratosphere over eastern Canada.

The temperature in the Pacific and the Atlantic is not growing.
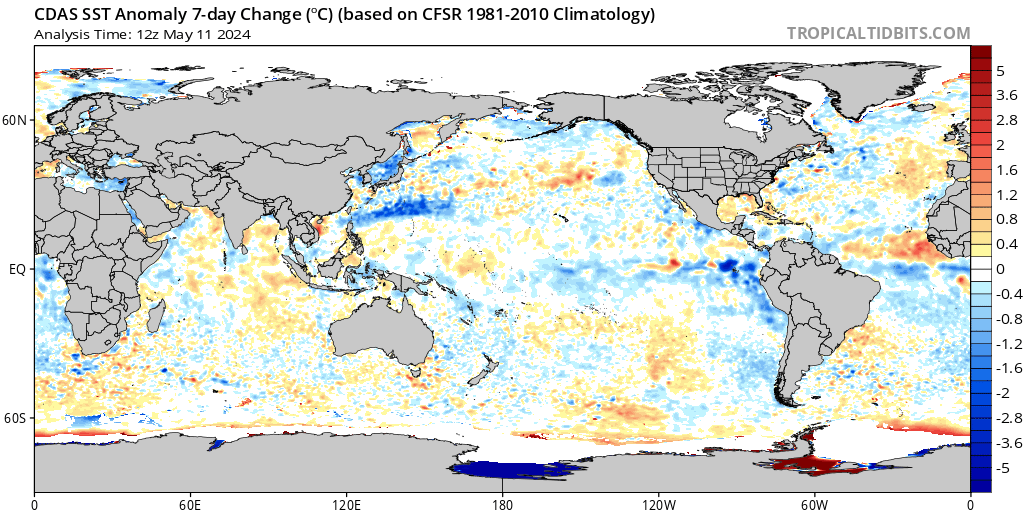
and because CO2 in the atmosphere has a coolant effect (if any), we perceive that:
The Desert is advancing nicely
Even the Dead Sea is being killed.
https://news.sky.com/story/shrinking-dead-sea-could-become-tiny-pool-within-decades-11596592
Well Done Mankind, you’ve actually managed to kill A Dead Thing
What would Cap’n Picard ‘say’?
Sure, posthumous executions are a thing.
https://www.amusingplanet.com/2018/08/posthumous-execution.html
Mankind has absolutely nothing to do with it, or did forget the Sarc tag?
The Dead Sea is shrinking because water is being diverted for irrigation.
Much like the Aral Sea.
Who cares what the badly over-acted character performed by Patrick Stewart would spew??!
Sixth warmest? Hmmm, what’s the margin of error on all these measurements? How do the various years rank once you provide a properly determined margin of error?
When I received my science degree, your reports were marked incomplete if you failed to provide statistical analysis with a resulting margin of error.
So for the past two years the global temperature anomaly has been dropping and the atmospheric content of CO2 has been increasing. With CO2 allegedly being the dominant control mechanism affecting temperatures this appears counter to CAGW theory.
Hmmm, perhaps its not all our fault.
Anomaly?
Not convincing. If we take 2001-2006 as baseline, there would be no warming. Let me please rephrase:
If we assume that temperatures (T) are measured at regular time intervals time(t) and find that
T= a x t +b
And now subtract b from measurements to calculate the anomaly , the trend will be simply a
However, if we subtract c from the relationship the trend will be a+(b-c)/t . If c is not absolutely equal to b, one can see that the trend will be always higher, or lower than what it is.
How confident we are that the baseline selected for the anomalies is accurate?
“However, if we subtract c from the relationship the trend will be a+(b-c)/t .”
Very strange maths there. The trend will still be a.
Maybe.
The signal is both auto correlated and stochastic. You would trade in the regression coefficient, which is not stellar to start with.
The fact that we are now in the Holocene Epoch which began 11,800 years ago when the last Ice Age, which started 2.6 million years previously, may have something to do with the gradually increasing temperatures? The absence of sunspots as we enter Solar Cycle 25 is a major cause of concern too because if we get a repeat of the Maunder and Dalton Minima, which is highly likely, our technology-based economies will crash because ‘renewable’ energy will not provide either reliable nor sufficient energy to maintain them. In my view, we are entering very dangerous times dominated by bigotry and ignorance.
Is the strength of the solar field decreases?
http://wso.stanford.edu/gifs/Polar.gif
Whatever future GAT fluctuations and perturbations occur the cult has gone too far, or the ‘sunk cost’ is far too great for it to be abandoned.
‘Doomsday’ is flexible, data can be easily ‘adjusted’ without kerfuffle as it has been, and any lack of future warming can be attributed to ‘carbon’ reduction efforts so far that must be continued and expanded.
It’s not about the GAT now if it ever was and will take a generation or two for the mania to recede into history (IMO).
As soon as you read the word ‘Mosher’, you move on to the next article and not just because of the bad spelling and grammar.
Apparently ‘English major’, so he does it intentionally, odd sense of humour.
.25C — OMG! And most of that is in polar regions in winters! A truly earth-destroying situation. /snark
Looking at Dr. Spencer’s graph (red line) there are some eleven (approximating one in early 2000s) distinct peaks during period of about 40 years which would suggest periodicity around 3.5 years.
Detailed spectral composition analysis (see graphic link ) shows
– 3 yr 8 months ……. most likely ENSO
– 7 yr ……. possibly a sub-harmonic of the above otherwise not known ( anyone ? )
– 9 yr 4 months ……. assumed the be AMO
Data: Dr. Roy Spencer
http://vortex.nsstc.uah.edu/data/msu/v6.0/tlt/uahncdc_lt_6.0.txt
Meanwhile, El Niño moves away in time.

Methinks we are all dancing on a very expensive pinhead here.
I have a thermometer with an additional remote sensor some 2 feet away. There is usually about a 1.0 degree difference between that and the in-house sensor.
A 0.25 degree anomaly over X years is to me a very stable situation. Doubt I could draw a line freehand as strait as this.
In my comment to Allan Macrae above, I noted that I have three precision ASTM thermometers in my basement all within a couple of inches of each other. For grins, I just took a quick recording of each. The average was 19.96C with a standard deviation of 0.153.
Always follow the data. In the past 17 years CO2 has increased by >14% and temperature has gone up (at most) 0.05 degrees. Looking at these numbers makes it very difficult to agree with the hypothesis that CO2 is the primary driver of global warming.
What data are you following Robert?
According to ESRL (MLO), CO2 in 2002 was 373 ppm compared to 408 ppm in 2018. That’s an increase of 14%. According to UAH, using linear regression, temperature since 2002 has increased by 0.20 deg C, not ~ 0.05 deg C.
When you follow the data, instead of a >14% increase in CO2 and an ‘at most’ increase in temperature of 0.05 deg, what you actually get is an increase of <10% in CO2 and a best estimate increase of +0.20 deg C in temperature (with UAH showing the smallest increase of all the data sets over that period).
Should read “that’s an increase of <10%", not "14%". (408-373)/373*100= 9.4%
What has linear regression got to do to with it.
The temperature average anomaly for 2018 is 0.226C and in 2002 it was 0.216C, what has happened in between is neither here nor there for COMPARISON purposes.
So as Mr Stokes suggests the baseline temperature is -9.0C it means that 2018 is -8.774C and 2002 was -8.784C which is an increase of 0.114%.
So CO2 has increased by slightly less than 10% and the temperature 0.1% and not all of it is due to CO2.
As the calculatons for the temperature are Actually in degrees K the calculated temp in 2018 was 263.924 and for 2002 it was 264.024 then we get an increase of 0.038% Are the instruments that accurate I wonder?
A C Osborn
I wonder why you didn’t address that point to Dr Spencer, who quoted the full ‘trend’ of 0.13 C/dec for UAH in his article, which is of course calculated using linear regression?
It would be equally spurious of me to claim that because the temperature in, say, 2017 was 0.375 C (-8.63 in absolute terms, assuming -9.0 C) and that 17 years earlier in 2001 it was 0.116 (-8.88 abs.), therefore temperatures between 2001 and 2017 increased by nearly 3%.
Using this ‘direct comparison’ method, that is, just picking 2 samples 17 years apart and ignoring all the data in the middle, misses all the twists and turns over the period and weights the respective start and end periods disproportionately, especially over relatively short periods like 17 years.
For instance, my warmer example is overly weighted by the increase in temperatures at the finish end due to the 2015/16 El Nino; while your cooler example overly weights the 2002/03 El Nino at the start end and recent lower ENSO conditions at the finish.
That is why a trend is more often used and linear regression is probably the most often used method for estimating this, including by Dr Spencer and co at UAH. The linear trend in UAH from Jan 2002 to Dec 2018 is 0.12 C/dec, or 0.001 C per month, times 204 months (17 years) = 0.20 C best estimate warming in total; not “(at most) 0.05” as claimed by poster Robert Wager above, he who urges us to “[a]lways follow the data”.
In the post of Robert’s that you responded to there was no mention of “trend”, it has nothing to do with trend.
The point in that it is no warmer now than it was in 2002 even though CO2 has increased 9.4%.
The fact that 2 individual months decades apart have similar anomaly values doesn’t negate the observation that it is warmer more recently overall. The proliferation of temperatures is higher now than it was in the early 2000s.
Indeed, even if you look only at the decadal average temperatures in UAH and ignore the trend altogether, you’ll see that each ‘decade’ (period of 10 full years, now that there are 4 of them in the UAH record) has been warmer on average than the previous one:
1979-88 -0.14
1989-98 -0.02
1999-08 +0.09
2009-18 +0.23
They were not months it was for the whole year.
Like I said what has happened in between in is not the discussion, it is where we are now compared to CO2 increase.
Excuse me, yes, whole years; but the same principle applies.
Whether you look at the decadal averages or the trend, it’s clear that there has been warming over the past 40 years in the UAH TLT data set. This has coincided with an increase in atmospheric CO2 concentrations.
Correlation is not proof of causation, of course, and whether the degree of warming is commensurate with the degree of CO2 increase is another question also. However, over the longer term, global temperatures have risen as CO2 has increased, which is a long-standing prediction of AGW theory.
Oh for Gods sake, how is it possible that so many intelligent people can be drawn off to comment on so many meaningless tangents.
Dr. Spencer, thank you for showing us that there is no “C” in AGW.
“SMS
January 2, 2019 at 2:20 pm
Oh for Gods sake, how is it possible that so many intelligent people can be drawn off to comment on so many meaningless tangents.”
My estimation:
in a select few cases here: unrestrained ego and lack of self reflection, admission of personal errors
the rest: frustration at constantly having to engage with their smug, self-righteous bloviating
As I understand it, there’s a view that the late 1970’s to late 1990’s warming trend petered out in about 2001.
Looking at UAH v6, the totals of all monthly global “anomalies” (apologies to those who don’t like the term) for 2001 was 1.39, whereas for 2018 it was 2.72.
The difference is 1.33. Divide by 12, and you get the actual difference in measured annualised anomaly.
0.1108333 (recurring).
Divide by 17 and multiply by 100 and you get a trend of less than 0.66 degrees warming per century.
And 2001 started with the tail end of a la nina whereas 2018 has been on el nino watch, so if anything that trend exaggerates the warming.
Macro scary!
“And 2001 started with the tail end of a la nina whereas 2018 has been on el nino watch, so if anything that trend exaggerates the warming.”
2001 was an El Niño year, at the time it was the second warmest in the UAH data set.
Bellman, 2002 was an El Nino year. Maybe you need new glasses.
http://origin.cpc.ncep.noaa.gov/products/analysis_monitoring/ensostuff/ONI_v5.php
Sorry, my mistake. Which make the fact that 2001 was the 2nd warmest year on record all the more remarkable.
Not really remarkable at all. Most of the satellite data set prior to 2001 is during the -AMO.
Go back to ~1930 and see how many years prior to that were warmer that the years after that date.
Most of that is due to the AMO induced warming of the Arctic. You can minimize this effect by only using Spring/Summer months (April-Sept.). I think if you redid your numbers you’d see even less warming.
I think people are over-thinking this a bit. Point # 1…There is zero trend since 2002
Point #2 For all intents and purposes the temp today is the same as it was in 1988. That’s 30 years = One climate data point = no global warming = co2 is not doing much.
Remember too that after 88 nothing happened apart from some COOLING.
Can we really let the ’89 and ’16/17 peaks distort our judgement of what’s actually happening?
That should be 1998 not ’89 of course…
It’s past time for another “theory” that is consistent with the unpredictable behavior of weather and climate. The models of a “greenhouse effect” forced by CO2, have failed to realize a viable concurrence with observation.
“Point # 1…There is zero trend since 2002”
The trend since the start of 2002 is 1.2°C / century according to UAH.
“Point #2 For all intents and purposes the temp today is the same as it was in 19[9]8.
That’s 30 years = One climate data point = no global warming = co2 is not doing much.”
1998 was an extremely hot year. Over 0.4°C warmer than any year seen up to that point. If you’re using that as a yardstick for change, you should also say that there had been about 0.7°C of warming between 1979 and 1998, warming at the rate of around 3.5°C / century.
“Remember too that after [9]8 nothing happened apart from some COOLING.”
After 1998 there were 2 years that were nearly identical to the two years before it, followed by 7 years that were warmer than any year prior to 1998. Of the past 8 years all but three have been warmer than any year prior to 1998.
Bellman,
When your alarm clock goes off and you wake up, you may just realize that you are prattling on about weather – NOT climate.
Give me a call when they start growing pineapples in Labrador City.
I’m replying to Mike’s comment above. He used 1998 as a benchmark for future warming. I agree that isn’t about climate – I was just responding to his points in kind.
Bellman, how long are you going to deny that ocean cycles can affect the global temperature?
I don’t think he is
But you said it – they are “cyclic” and as such come out a zero-sum.
They lie over and above the AGW signal.
Let me correct that for you “They lie over and above the rebound from the LIA.”
There sorted.
Very scintific A C.
It’s all a acam.
The every-ready nayayers get-out.
And why “talking” to them is useless.
And they never landed on the Moon, or, if they did, they found Elvis there.
What you mean you don’t believe in the LIA?
Richard M
” how long are you going to deny that ocean cycles can affect the global temperature?”
I made no mention of ocean cycles. I’m simply trying to explain why I think the data suggests there has been global warming and gives no indication of that stopping. There could be many causes for that, though one leaps to mind.
I’m sure ocean cycles can affect global temperature, but it’s difficult to see how they can can cause long term warming, being cyclical in nature. If a 60 year cycle was the only thing affecting temperature we would expect current temperatures to be comparable to those in the late 50s.
”The trend since the start of 2002 is 1.2°C / century according to UAH”.
Rubbish
”1998 was an extremely hot year. Over 0.4°C warmer than any year seen up to that point. If you’re using that as a yardstick for change, you should also say that there had been about 0.7°C of warming between 1979 and 1998, warming at the rate of around 3.5°C / century”.
I don’t care about 1979 to 1998
”Of the past 8 years all but three have been warmer than any year prior to 1998.”
Who cares?
“”The trend since the start of 2002 is 1.2°C / century according to UAH”.
Rubbish”
So how are you defining “trend”? I was using an ordinary least square regression, and it gave the .2°C / century figure. If you think this is rubbish explain why.
“I don’t care about 1979 to 1998”
Why not?
“”Of the past 8 years all but three have been warmer than any year prior to 1998.”
Who cares?”
You should if you want to maintain your claim that “Remember too that after 98 nothing happened apart from some COOLING.”. In my view the fact that despite all this COOLING temperatures are still warmer than before 1998 is at the very least an important piece of context.
The satellite era started at the end of the biggest cooling scare of the 20th century and you are still only talking about an increase of 0.7C over a 40 year period.
As Dr Spencer notes on his Forum the Satellite data is dominateded by the Northern Hemisphere, according to Hansen et al from 1880 to 1940 the Northern Hemisphere temperature increased by 0.8C, it then cooled by 0.5C in the next 30 years.
Nothing new at all.
Of course the Current temperature data no longer shows the same rise and fall as it has been homogenised out.
All reporting agencies agree there has been little or no change in average global temperature since 2002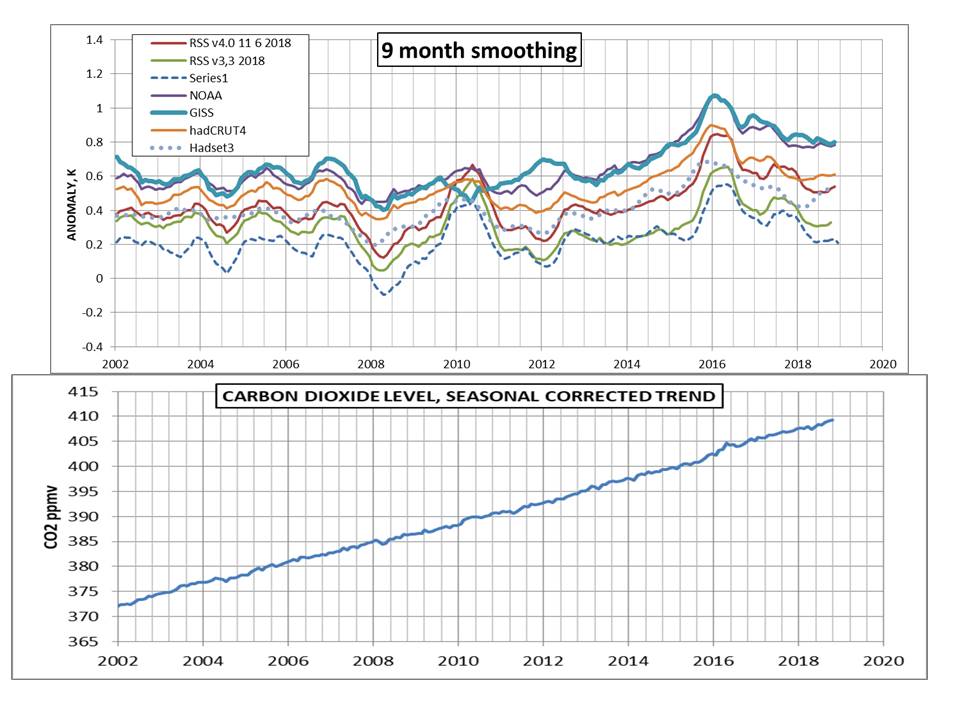
CO2 has increased since 2002 by 40% of the increase 1800 to 2002
Apparently CO2 has little if any effect on average global temperature
Discounting the aberration of the last el Nino, it appears water vapor trend has settled at about 7% more than it was in 1960.
The GHG effect was characterized in isolation, then extrapolated, modeled with global, yet low resolution, proportions. It forms the foundation of a theory that is not viable in the wild.
Also very illuminating.
It will be a bitter winter in the USA.
https://www.tropicaltidbits.com/sat/satlooper.php?region=us&product=wv-mid
December was very warm in the north.
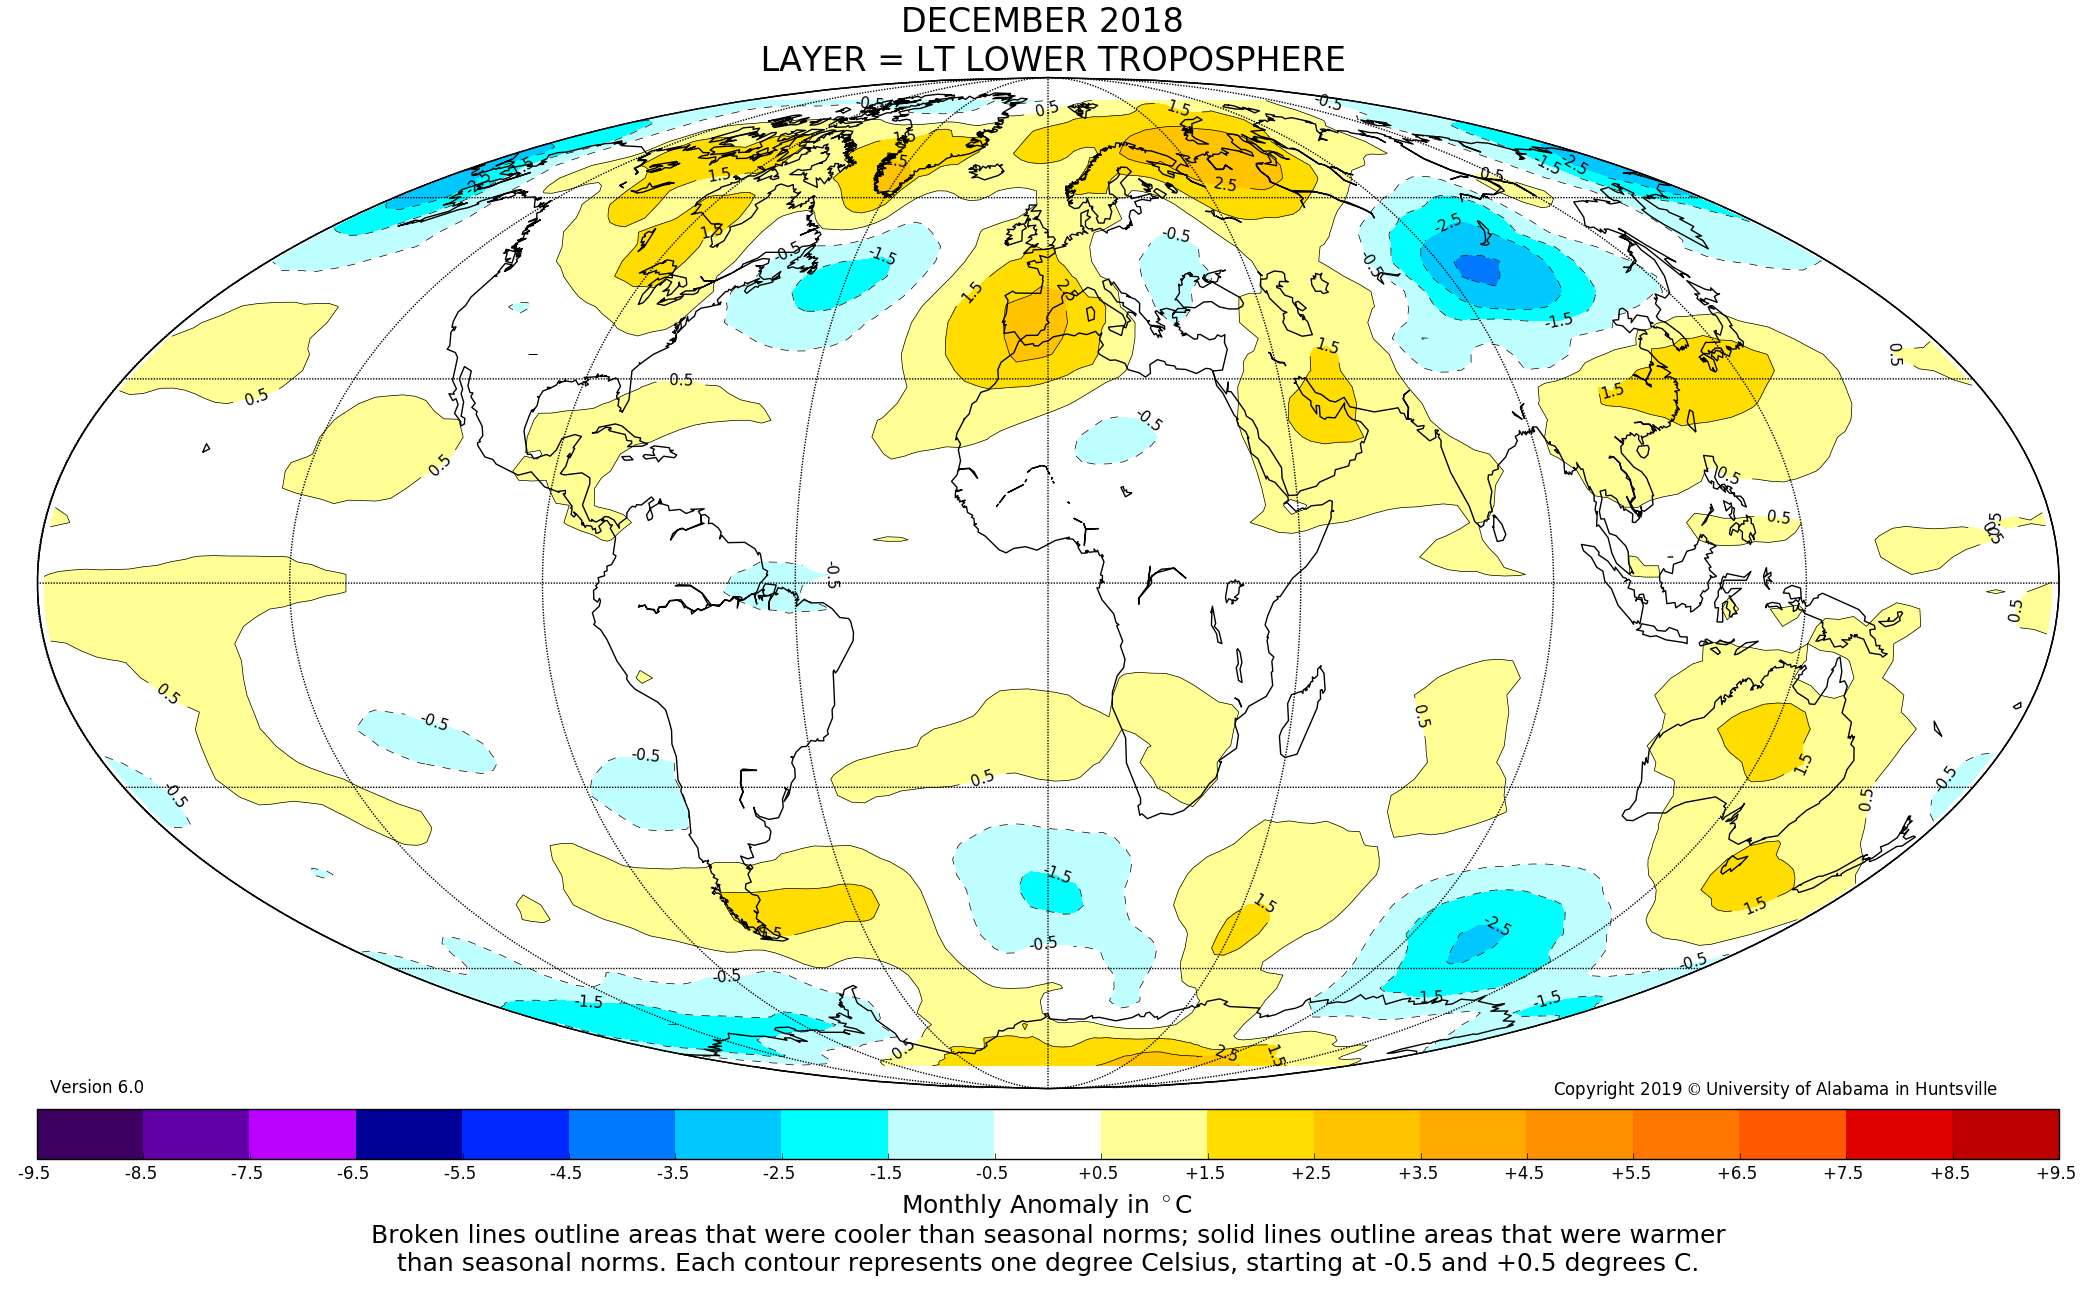
I just love that depiction, it shows the Atmosphere over North America was 1.5C warmer than normal, try telling that to all those with record breaking low temps and feet of snow. I can’t really see the old USSR areas, but they also had record cold temps as well.
It also doesn’t show the record breaking low temps in Brazil either.
It just shows the heat leaving the Atmosphere.
The surface was not so warm.

The only real question of worth is: Will there be enough ice in the Norton Sound for the Iditarod Sled Dog Race to go over? I’ll bet yes.
“I just love that depiction, it shows the Atmosphere over North America was 1.5C warmer than normal, try telling that to all those with record breaking low temps and feet of snow.”
And further above …
“One thing that you all have to remember about the Satellite data is that it is NOT measuring the temperature at the surface, it is measuring the brightness of the Atmosphere at the height where the Atmosphere averages -9.0C.
It is NOT what we experience at all and it is NOT the surface temperature.”
Compare and contrast.
Yes exactly.
AC : You sqid it yourself.
The answer.
Sat trop temps dont “measure” the surface.
Your “record cold’ could easily have occurred under that atmosphere. It is actually near average over most parts but Canada and the NE States.
Ever heard of a surface inversion?
Over a snow surface?
Oh, and snow is not a proxy for cold.
Ever heard of the CC relation and,the mysterious fact that warmer air can hold more moisture?
Hi Anthony,
what is your stance, precisely, regarding human contribution to climate?
what role does CO2 play?
what do you think is the most appropriate method to address your estimation of the current state and potential future of climate?
As a retired yachtsperson I love Valentia, the remote SW Ireland weather station with its very long data set. Without tampering it seems about 0.43C warming a century. Can live with that but not when ‘homogeneous ‘ with Paris.
Ype, don’t even go there with Berkeley’s final product, complete and utter nonsense for any island or coastal area when they smear the temperature the way that they do.
If it is the 6th warmest year, it means that there have been 5 hotter years in the last 40. This would suggest that it is getting cooler now.
See what the stratospheric polar vortex currently looks like at a pressure level of 10 hPa.
https://earth.nullschool.net/?fbclid=IwAR3AxTqHo_WT6BViWvaXVQTq4WlHIoMqewC_00P4mUw6xohoLICfPMG95JQ#2019/01/03/1500Z/wind/isobaric/10hPa/orthographic=-31.29,77.63,407
The new year starts with a significant pattern change and a strong Arctic cold airmass outbreak across the eastern half of Europe, including east-central Europe, Balkan peninsula, parts of Mediterranean and black Sea / Turkey region. After Jan 3rd, a few very cold days are expected over these areas with temperatures locally more than 10 °C below normal.
The current temperature (C) in California.

The temperature increases in the lower stratosphere.
http://ds.data.jma.go.jp/tcc/tcc/products/clisys/STRAT/gif/pole30_nh.gif?fbclid=IwAR1loya_Iauv8Gg0VdAJP2fwLoCwF_ZIkTnw5Ug2bO_mQQ1pxgdWcAHW2I4
You have to ask the question is that an Instrument malfunction?
It usually takes about 5-months for El Niño warming spikes to manifest in lower troposphere temps.
Since the current weak El Niño peaked in October 2018, UAH global temp anomalies will likely peak in a few months, and then fall steadily until the next La Niña cycle starts in 2020.
The next La Niña cycle should be a strong one since the last strong one was in 2010/11, and they usually occur every 10 years or so. If it is a strong one, UAH could hit -0.20C ~ -0.3C. At the same time, the PDO/AMO/NAO should all be in their respective 30-year ocean cool cycles, and the 50-year Grand Solar Minimum will start.
CAGW advocates will soon find it impossible to explain the huge and growing disparity between model projections vs reality..
I think so too. Everything seems to point to coming cool in the next few years.
I don’t like too much cool, I prefer heat, but I would gladly see it if it kills the co2 hypothesis once and for all.