EL NIÑO/SOUTHERN OSCILLATION (ENSO) DIAGNOSTIC DISCUSSION
issued by CLIMATE PREDICTION CENTER/NCEP/NWS and the International Research Institute for Climate and Society 13 December 2018
ENSO Alert System Status: El Niño Watch
Synopsis: El Niño is expected to form and continue through the Northern Hemisphere winter 201819 (~90% chance) and through spring (~60% chance).
ENSO-neutral continued during November, despite the continuation of above-average sea surface temperatures (SSTs) across the equatorial Pacific Ocean (Fig. 1). The latest weekly SST indices for all four Niño regions were near +1.0C (Fig. 2). Positive subsurface temperature anomalies (averaged across 180°-100°W) weakened slightly (Fig. 3), but above-average temperatures persist at depth across the central and eastern equatorial Pacific Ocean (Fig. 4). However, the atmospheric anomalies largely reflected intra-seasonal variability related to the Madden-Julian Oscillation, and have not yet shown a clear coupling to the above-average ocean temperatures. For the month as a whole, atmospheric convection remained close to average near the Date Line and suppressed over Indonesia (Fig. 5). Also, the low-level and upper level winds were mostly near average across the equatorial Pacific. The equatorial Southern Oscillation index (SOI) was negative, while the traditional SOI was near zero. Despite the above-average ocean temperatures, the overall coupled ocean-atmosphere system remained ENSO-neutral.
The majority of models in the IRI/CPC plume predict a Niño3.4 index of +0.5C or greater to continue through the winter and spring (Fig. 6). The official forecast favors the formation of a weak El Niño, with the expectation that the atmospheric circulation will eventually couple to the anomalous equatorial Pacific warmth. In summary, El Niño is expected to form and continue through the Northern Hemisphere winter 2018-19 (~90% chance) and spring (~60% chance; click CPC/IRI consensus forecastfor the chance of each outcome for each 3-month period).
This discussion is a consolidated effort of the National Oceanic and Atmospheric Administration
(NOAA), NOAA’s National Weather Service, and their funded institutions. Oceanic and atmospheric conditions are updated weekly on the Climate Prediction Center web site (El Niño/La Niña Current Conditions and Expert Discussions). Forecasts are also updated monthly in the Forecast Forumof CPC’s Climate Diagnostics Bulletin. Additional perspectives and analysis are also available in an ENSO blog. The next ENSO Diagnostics Discussion is scheduled for 10 January 2019.

Figure 1. Average sea surface temperature (SST) anomalies (°C) for the week centered on 5 December 2018. Anomalies are computed with respect to the 1981-2010 base period weekly means.

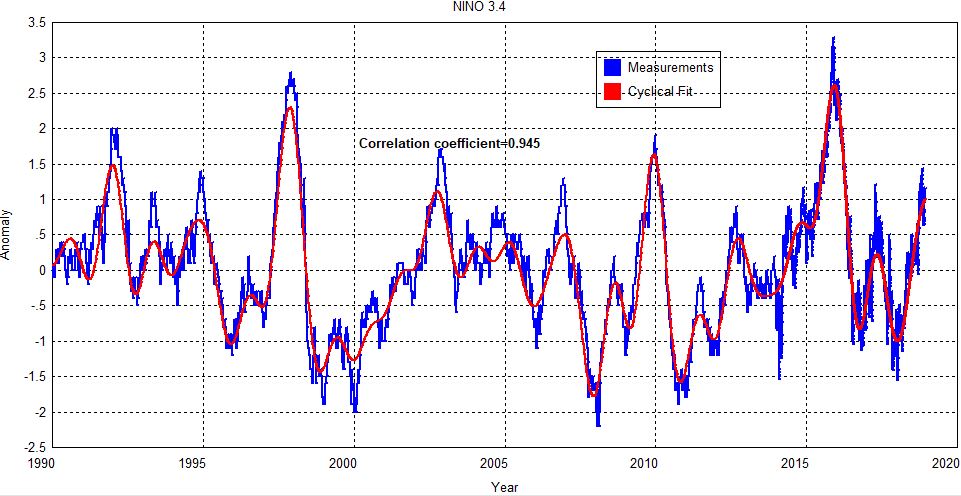
Figure 2. Time series of area-averaged sea surface temperature (SST) anomalies (°C) in the Niño regions [Niño-1+2 (0°-10°S, 90°W-80°W), Niño-3 (5°N-5°S, 150°W-90°W), Niño-3.4 (5°N5°S, 170°W-120°W), Niño-4 (5ºN-5ºS , 150ºW-160ºE)]. SST anomalies are departures from the 1981-2010 base period weekly means.

Figure 3. Area-averaged upper-ocean heat content anomaly (°C) in the equatorial Pacific (5°N5°S, 180º-100ºW). The heat content anomaly is computed as the departure from the 19812010 base period pentad means.

Figure 4. Depth-longitude section of equatorial Pacific upper-ocean (0-300m) temperature anomalies (°C) centered on the pentad of 4 December 2018. Anomalies are departures from the 1981-2010 base period pentad means.

2) for the period 9
Figure 5. Average outgoing longwave radiation (OLR) anomalies (W/m
November – 4 December 2018. OLR anomalies are computed as departures from the 1981-2010 base period pentad means.

Figure 6. Forecasts of sea surface temperature (SST) anomalies for the Niño 3.4 region (5°N5°S, 120°W-170°W). Figure updated 19 November 2018.
h/t to reader Dennis Wingo
source: http://www.cpc.ncep.noaa.gov/products/analysis_monitoring/enso_advisory/ensodisc.pdf
With the OLR anomalies non existent or even negative and SST anomalies significantly positive, the only reasonable explanation is that there’s anomalously high cloud coverage reducing the net OLR emissions as seen from space. This makes sense as higher SST means more evaporation which means if not more clouds, taller clouds with colder tops.
This also suggests increased reflection as clouds increase and/or increased retention of surface emissions as clouds get taller. Whether or not the SST anomaly shrinks or grows would seem to be dependent on whether the increased clouds decreasing the ratio of OLR to SST^4 are increasing reflected energy by more or less than the OLR anomaly. It would be interesting to see the albedo anomaly.
yep…and Ventusky agrees
https://www.ventusky.com/?p=-9;-141;2&l=clouds-total
Significant cloud cover is amazingly coincident with the El Nino related SST anomaly. The open question is how anomalous is the reflected incident energy relative to the increased reflection from increased cloud cover. This should suggest whether a potential El Nino will intensify or dissipate.
It’s not occurring that way though, I’ve been watching it and the equatorial convergence activity has been steadily migrating westward to the central and now western Pacific. The eastern tropical pacific has had much less cloud cover for about a month, and the easterly trades are now much stronger than they have been in months.
Index SOI is positive from November 20, 2018.

https://www.longpaddock.qld.gov.au/soi/
REALLY – I would say EL NINO is not going to form and the recent attempt is in the process of falling a part.
SOI INDEX will remain positive for many days yet to come.
Circulation in the western Pacific does not indicate El Niño.
http://tropic.ssec.wisc.edu/real-time/mtpw2/product.php?color_type=tpw_nrl_colors&prod=wpac×pan=24hrs&anim=html5
When NOAA came out in October with the prediction of a “much milder than normal winter” and some areas north and east to be especially warm, while NO PART of the USA could be expected to be below normal, I was rolling and laughing on the ground.
http://www.nukepro.net/2018/11/noaa-in-amazing-display-of-hubris.html
My prediction was for the “Quiet Sun” (low sunspots, but most importantly, low magnetism) to have it’s expected shifting of the polar vortex, off the pole, and pushing south and east (in relation to USA), and bringing more cold Canadian air down, more often. This is playing out in spades in the Midwest and the east coast.
After a momentary increase, geomagnetic activity decreased again.
This is the circulation at the equatorial Pacific.
http://tropic.ssec.wisc.edu/real-time/mtpw2m/product.php?color_type=tpw_nrl_colors&layer=tpw&prod=midpac×pan=24hrs&anim=html5
https://www.tropicaltidbits.com/analysis/ocean/
I do not think the climate models had region 3.4 to be +.40c at this time. I think rather they had it well in excess of +1c deviation. Way off.
I think, SST Anomaly Time Series is a daily value changing once a day
I submitted a comment and it never showed?
http://www.nukepro.net/2018/11/noaa-in-amazing-display-of-hubris.html
Will try again.
Prior comment was more lengthy, maybe I didn’t hit the “accept cookies” button, to keep EU off backs of WUWT.
I understand the practicality of mitigating problems, as stupid and inappropriate as the EU telling me, an American citizen, what I HAVE TO DO, to comply with their rules. Eff them and the horse of the Apocalypse they wish they could rise in on.
stock
That’s the whole point of the EU though, to compete with America.
But America grew organically on the back of Capitalism, the EU has been herded into socialism.
You have 51 states with a common language and a common currency. The EU has 27 states with 27 different languages and a common currency imposed on most which has been little short of disastrous.
America has a single leader, your POTUS, the EU has a bureaucracy to lead 27 leaders because they are too frightened to vote anyone leader in case he/she turns into Hitler.
Europe has great car manufacturers (German), they have great financial instruments (British) they have great nuclear energy, wine, cheese and yellow vests (French) they have great agriculture (Spain) they have great Pizza’s (Italy) and great olives (Greece) but they had to look to America to create a consistently good (?) burger across the continent. The Germans only copied Henry Ford’s manufacturing methods and the French adopted American nuclear technology, but kept it to themselves (almost).
Europe is disparate, America united. Our Queen is a product of Germany, her husband a product of Greece. King Edward abdicated to marry an American yet Meghan Markle is now welcomed into the royal family (presumably as she will never be Queen).
The UK and Europe have been trying to make friends for centuries yet the Scandinavians didn’t like us, the Romans didn’t like us, the Normans didn’t like us, Napoleon din’t like us, Bismark didn’t like us, and Hitler didn’t like us and the Irish are reluctant friends, amongst many others.
We have been to war with many countries, including America, but it seems our consistent ally has been America.
Phuck Europe I say, I’ll stick with our American allies.
I may not be bright but I’m damn sure I can learn a lesson.
Ah yes, the EU, where the cuisine is British, the military is French, the diplomats are German and the engineers are Italian. (with apologies to, well, everyone).
stock,
Comments seem to be posted in batches every few minutes, so it may take several minutes for a comment to appear after you’ve submitted it. This behavior started after the last site was hacked and this one was built to replace it. There’s probably a site configuration option somewhere to change this behavior.
co2isnotevil
I understood this site, the new one, was hacked, not that last.
hotscot,
They probably all have been hacked or at least attacked. I see almost constant attacks on my network.
I noticed that it was about when we lost the ability to edit them, that comments started getting batched. I thought it was that UI that got hacked and couldn’t be restored, so it was replaced with the more generic UI because it’s less vulnerable.
3 comments, 1 briefly appeared, now all are scrubbed. Quite odd.
[By site policy, you are permitted to use only one login_id. .mod]
From January 2016 to January 2018, the temperature anomaly records of all 5 major world gauges show a plummeting of about 5.6 degrees Celsius ( See GissTemp in particular).
Two years of global cooling do not disprove a global warming trend and may be insignificant in terms of a Climate Normal of 30 years.
However the same comment applies to the late 20th Century Warming from 1976-1998.It is not probative of CAGW.
My point is that the 2015/16 spike and the 2016-2018 decline is ENSO caused and nothing else.
Is there any dispute on this in the settled science?
“Is there any dispute on this in the settled science?”
The settled science has so much stated uncertainty and it still doesn’t seem to be enough. So according to the settled science, anything and everything can be confirmed or disputed depending on the cause it serves.
Herbert
According to GISS (since you mention that data set in your comment), temperatures during the period you describe as “late 20th Century Warming” (1976-1998) rose at a rate of +0.17 C per decade. In the period since then, from 1999 to the present, temperatures have risen at a rate of +0.21 C per decade. In fact, the rate of temperature rise over the entire period 1976 to the present is faster than 1976-1999 too (+0.18 C per decade).
The period you single out as “late 20th Century Warming” actually warmed at a rate slower than the period 1999 to the present; it also warmed at a rate slower than the period 1976 to the present. It follows that if the period 1976-1999 was one of ‘warming’, then that warming has continued, perhaps even accelerated slightly.
http://www.woodfortrees.org/plot/gistemp/from:1976/plot/gistemp/from:1976/to:1999/trend/plot/gistemp/from:1999/trend/plot/gistemp/from:1976/trend
Poor old Estragon and Vladimir still waiting for El Ninot…
BOM is talking down El Niño:
(13 Dec):
The tropical Pacific Ocean remains ENSO-neutral, despite some indicators reaching El Niño levels. As a result, the Bureau’s ENSO Outlook remains at El Niño ALERT. The positive Indian Ocean Dipole (IOD) event in the tropical Indian Ocean weakened in the past fortnight.
Sea surface temperatures in the tropical Pacific Ocean have now exceeded El Niño thresholds for more than a month. However atmospheric indicators—such as trade winds, cloud patterns, and the Southern Oscillation Index (SOI)—have not reached El Niño levels. This indicates that the tropical ocean and atmosphere are not reinforcing each other and remain ‘uncoupled’. This coupling is required to establish and sustain any ENSO event
Some equatorial Pacific warming is climatology for Christmas time every year. A simple consequence of the Southern Hemisphere summer. And every year without fail there is excited but vacuous talk of El Niño. There has been no proper Bjerknes-driven El Niño since 1999.
You need to watch it all.
Nigel Farage is even more unpopular in the UK that Trump is in the US.
He shouldn’t be.
https://www.youtube.com/watch?v=XaSnZB848ew
Then Tucker and Nigel Farage.
https://www.youtube.com/watch?v=5nsc2v43URU
The US thinks they have problems?
What he said “Tasfay Martinov Poor old Estragon and Vladimir still waiting for El Ninot…BOM is talking down El Niño:”
–
This is good.
“The 30-day Southern Oscillation Index (SOI) to 2 December was +1.6 [now +2.9], and the 90-day SOI was −2.2. The SOI has remained within the neutral ENSO range since early September, when it briefly reached El Niño thresholds. Sustained negative values of the SOI below −7 typically indicate El Niño while sustained positive values above +7 typically indicate La Niña. Values between +7 and −7 generally indicate neutral conditions.”
–
This is the only ray of light at the moment. Temps up for nearly 2 months at El Nino base levels. Where it will go is always anyone’s guess but it usually goes the way one does not want.
Confounding issues more ice and snow up North. South still too warm.
It takes a long time to permanently gain or lose heat energy despite the massive natural variations in short term gain or loss.
A non ENSO expert observation. While ENSO is reasonably well understood in hindsight (thanks, Bob Tisdale), its not well predicted in foresight. Color me skeptical for multiple reasons.
I have my doubts about this, the latest sub-surface anom from BOM, dated 18th Dec 2018:
http://www.bom.gov.au/archive/oceanography/ocean_anals/IDYOC007/IDYOC007.201812.gif
Plus there’s a much stronger easterly trade flow in place at present compared to two months or one month ago. The anom conditions for a Nino looked much more impressive 6-months ago, then just faded. And it looks like this latest attempt has peaked and is now fading off too. Appears to be little chance of Nino development to me, at least for now.
Ditto, Rud. Solar input may be insufficient in the short to medium term, but that remains to be proven…… Brett
I have made a number of predictions about the start of the next El Nino in 2019. They are posted here:
http://astroclimateconnection.blogspot.com/
November – posts 1 and 2
December – posts 1, 2, and 3
I am even testing a hypothesis that there will be a nascent cyclone-pair forming across the equator around the 18th to 20th of December somwhere between the islands of Sulawesi and the Solomons. The current MJO is near Sumatra and the pair of nascent cyclones that was formed across the equator around the 9th of December (off the coast of Sri Lanka) has developed into a full-blown tropical cycle pair.
The cyclone pair is visible on the earth.nullschool.net site.
Willis might find the following piece of speculation, from the posts cited above, of interest to his theory about the equatorial thunderstorm temperature regulator.
Speculation: If you were to observe the Moon from a fixed point on the Equator at the same time each day, you would notice that the sub-lunar point on the Earth would appear to move at a speed of 15 to 20 m/sec from west-to-east. This suggests that lunar tides are emphasizing or reinforcing a weather phenomenon that routinely occurs at roughly the same time each day. One such phenomenon could be the peak in convective thunderstorm activity that routinely takes place at roughly the same time each afternoon along the equator.
Note:
* Equatorial Kelvin Waves (EKWs) travel through Madden Julien Oscillations (MJOs).
* The phase velocity of an EKW is typically 15 — 20 m/sec (west-to-east) over the Western Pacific ocean and 12 — 15 m/sec (west-to-east) over the Indian Ocean.
* EKWs are non-dispersive waves, so their phase velocity is equal to their group velocity. The slower speed of an EKW over the Indian Ocean is attributed to the fact that the wave is coupled with the atmospheric convection and precipitation.
* The west-to-east velocity of the Moon along the Ecliptic (as seen from the Earth’s centre) varies between 15.2 — 19.8 m/sec. This is very close to the west-to-east group (and phase) velocity of 15 — 20 m/sec of the convectively-decoupled EKW.
Back in June I showed that the solar minimum is expected from Dec 2018 to Jul 2019. My own prediction is for Feb 2019.
https://wattsupwiththat.com/2018/06/07/the-approaching-solar-cycle-24-minimum/
And in July I showed that a shift to El Niño conditions has taken place close to the solar minimum the last five solar cycles since 1965 (more than 50 years).
https://wattsupwiththat.com/2018/07/05/solar-minimum-and-enso-prediction/
Therefore, that there are El Niño conditions by February 2019 seems appropriate enough. That’s what I have been expecting the last 6 months.
Watch out for a big La Niña by late 2019 to 2020.
Javier
I think you are close. Here is what I have.
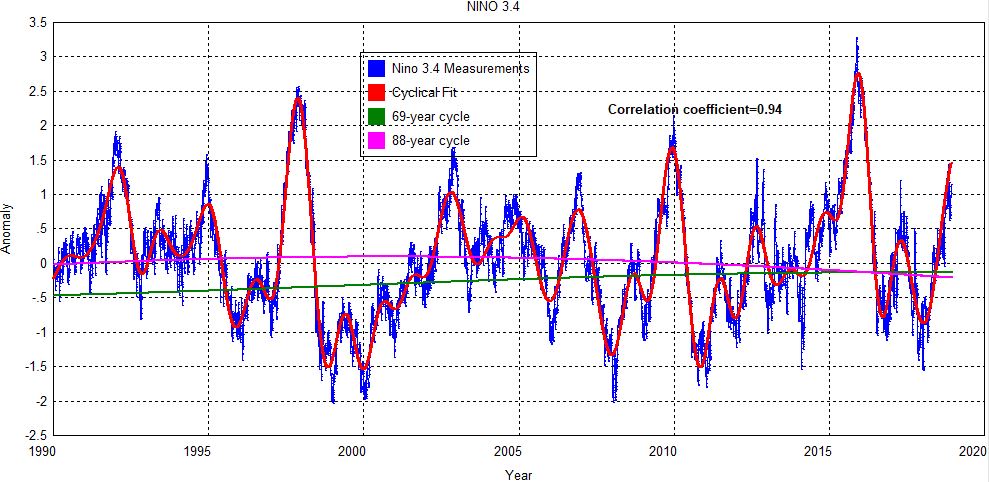
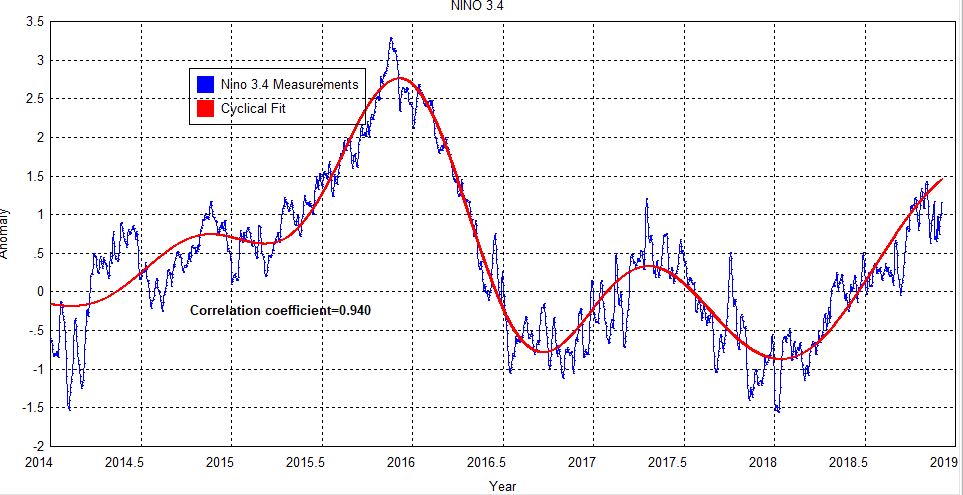
I do my own analysis of the Nino regions using a cyclical analysis. I have two solutions that are showing about the same for Nino region 3.4. The first solution only goes back to 1981 with only the daily data. The second solution uses all the data. It is monthly data from 1854 until 1991. It is weekly data from 1991 until 2014 and then daily data.
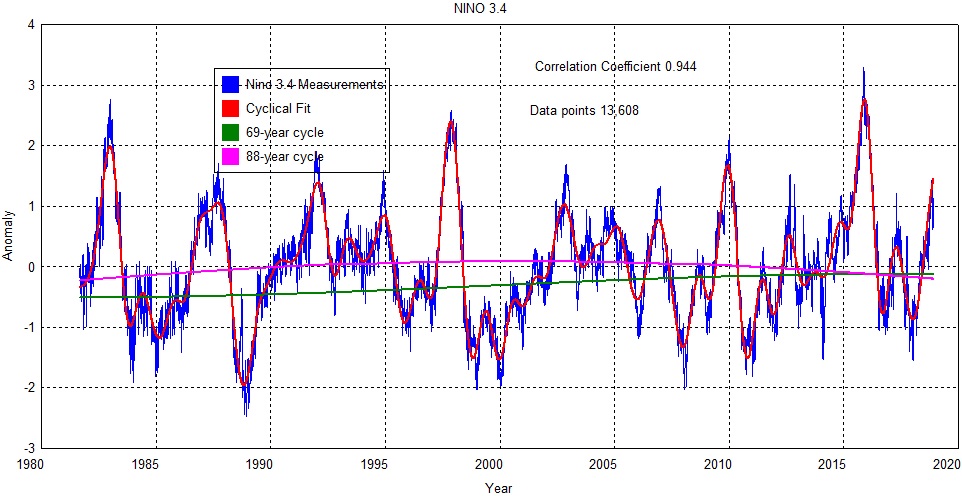

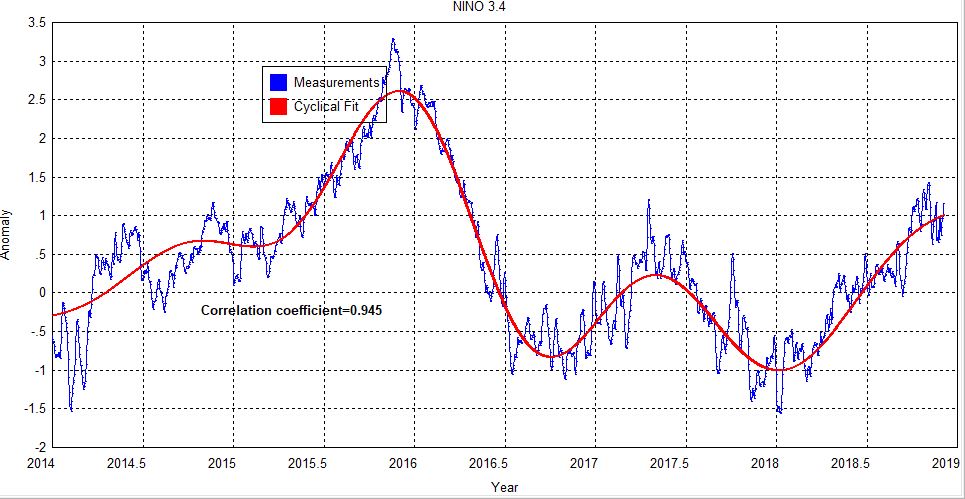
The first solution has 13,608 daily data points.
Note the presence of a 69-year and 88-year cycle. In all the datasets that I look at I seem to have a common thread of a 60-yer cycle. In the Hadcrut4 data it is 67 years. I believe the 88-year cycle is Gleissberg.
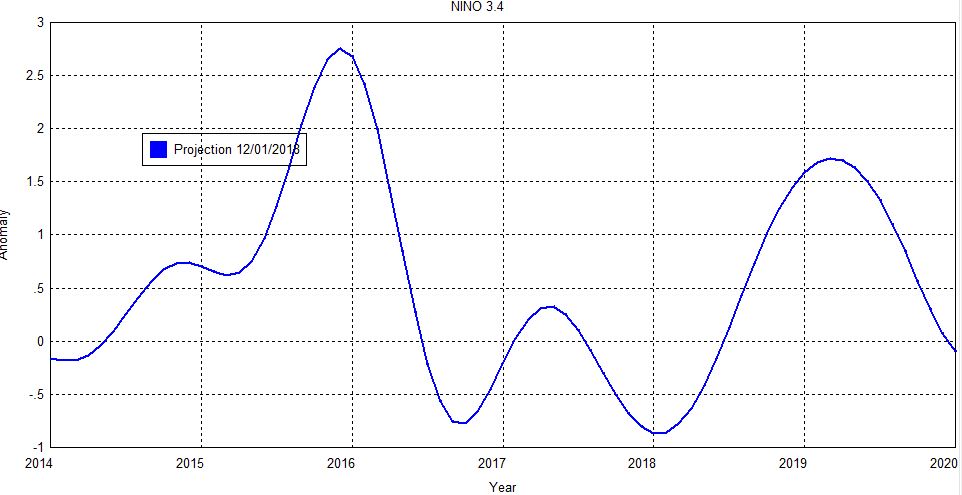
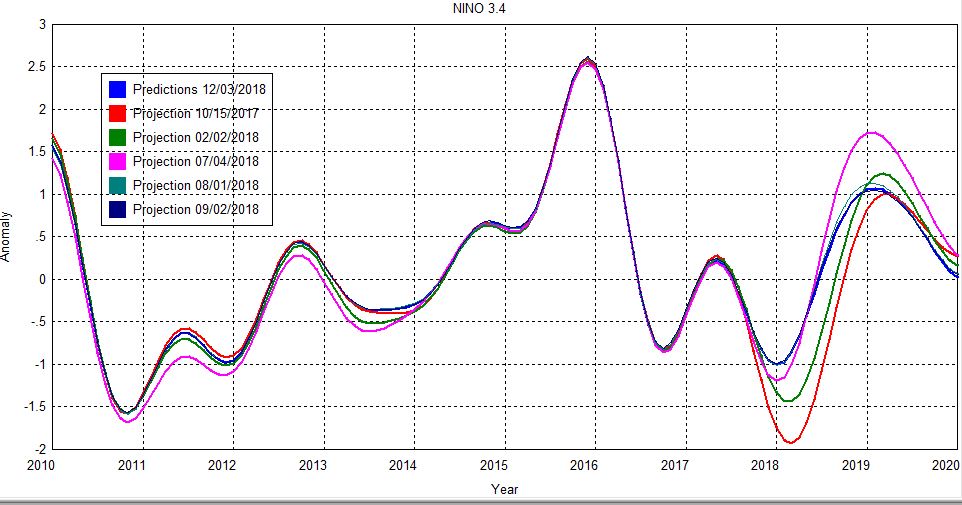
The projection until 2020 is
For the second solution composed of the three different intervals I get
The projection until 2020 is
In this last picture you can see how the projection has changed but there has always been a modest or weak El Nino in 2019.
There have been a number of predictions as to will happen to our climate, now that ENSO is increasing. Let me add my prediction to the mix, as to what I believe will happen:
All La Ninas and El Ninos are caused by increasing or decreasing amounts of SO2 aerosols in the atmosphere.
The 2014-2016 El Nino was caused by a 30+ Megaton decrease in anthropogenic SO2 aerosol emissions, primarily due to Chinese efforts to reduce air pollution, which were implemented in 2014.
This El Nino ended because of two VEI4 volcanic eruptions in Apr-May of 2015, whose SO2 aerosol emissions caused the 2016-2017 La Nina, after the usual 12-15 month delay.
When their emissions settled out, the La Nina ended, and temperatures began to rise. However this rise was interrupted by 4 closely-spaced VEI3 eruptions in late 2016, which caused the 2017-2018 La Nina.
Their emissions have now settled out, and temperatures are beginning to rise. However, there have been no new eruptions to dampen the cooling, so warming should continue for about a year after the next VEI4 eruption occurs, whenever that may be.
All La Ninas and El Ninos are caused by increasing or decreasing amounts of SO2 aerosols in the atmosphere.
From?
Need to be more specific.
Angech:
I have a paper at the pre-publication site https://www.Osf.io/bycj4/ “Atmospheric SO2;
Principal Control Knob Governing Earth’s Temperatures” which offers more specifics.
The El Nino may have peaked as there has been weakening for the last week with more to come, but the sensible weather has certainly been El Nino like here in the West, especially the Pacific Northwest.
We have seen a lot of split flow (classic Nino) and the storms that have made it to the PNW have been warmer storms instead of the colder storms the polar jet usually brings us.
Strong highs in the Eastern Pacific do not indicate El Niño.

Lows that reach to Vancouver do not indicate El Nino. Cold fronts reach California.

El Nino does not mean there are never any lows that get to Vancouver Island or the PNW. Even the worst El Nino is not bone dry. But so many systems have split, which is classic El Nino. And California has been wetter, which is classic El Nino.
All the NWS forecast discussions have mentioned that we have been strongly influenced by El Nino so far. And BTW, the real dry part of the winter that you are implying usually starts about mid January.
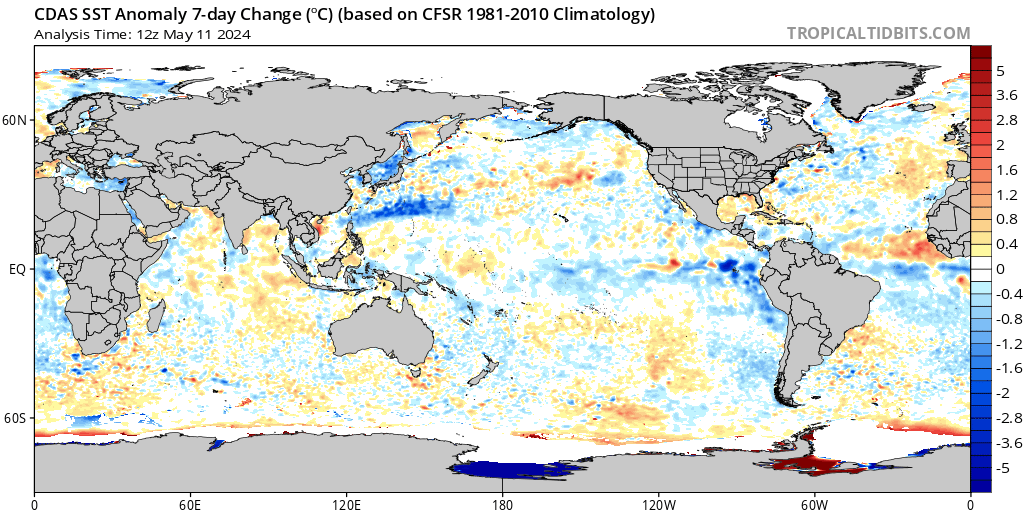
SST Anomaly 7-day Change
Circulation over North America does not indicate El Niño.
http://tropic.ssec.wisc.edu/real-time/mtpw2m/product.php?color_type=tpw_nrl_colors&layer=tpw&prod=namer×pan=24hrs&anim=html5
SSW over Canada, with a decrease in geomagnetic activity.
http://umtof.umd.edu/pm/latest2day.imagemap?251,128
The polar vortex is stronger than the Pacific temperature anomalies.
https://earth.nullschool.net/#2018/12/14/0300Z/wind/isobaric/70hPa/orthographic=-87.89,74.28,296
Great low over eastern Australia.
http://tropic.ssec.wisc.edu/real-time/mtpw2m/product.php?color_type=tpw_nrl_colors&layer=tpw&prod=ausf×pan=24hrs&anim=html5
Destroying the idea that el ninos have anything to do with CO2 and caused in part by mans co2, these are exciting and relatively new finds that I don’t see much discussion or awareness of:
http://www.plateclimatology.com/emerging-2015-el-nino-fueled-by-deep-ocean-geological-forces/
http://www.plateclimatology.com/further-proof-el-nios-are-fueled-by-deepsea-geological-heat-flow/