One of the constantly repeated, sympathy-seeking (and basis for wealth distribution) messages by politicians, by alarmists, by the mainstream media, and by brainwashed good-intentioned people, is that the world’s poorest countries have been hit hardest by human-induced global warming/climate change. Is it true or just some more of the constant stream of global warming/climate change disinformation? Let’s find out, shall we?
Berkeley Earth provides surface air temperature data for individual countries, so all we need to do is select a couple of logical references to compare with the poorest countries—that is, a couple of not-poorest references—and ways to present the surface air temperature data for the poorest and not-poorest countries so that we can confirm the claims, determining whether they’re real or outright baseless fabrications.
IMPORTANT INITIAL NOTE: I fully understood that poor people have the least financial resources with which to prepare for, and respond to, and shelter themselves from, changes in temperature and precipitation, i.e. from weather in general. That is NOT the topic of this post.
In this post, we’re going to illustrate and discuss if, since 1900, surface air temperature data confirm that the multidecadal rates of change in the surface air temperatures of the poorest countries have been greater or less than changes in a couple of reference not-poorest countries. We’ll also confirm something that should be obvious to anyone who had bothered to determine where those poorest countries are located around the globe. [End note.]
The ranking of countries in terms of wealth (GDP/capita) can be found at the Central Intelligence Agency’s The WORLD FACTBOOK webpage here. The list begins with the wealthiest country Liechtenstein—a teeny land-locked principality between Austria and Switzerland—and works its way down to the poorest country, which the CIA lists as Burundi.
Berkeley Earth provides near-surface land air temperature data broken down by countries here. Unfortunately, there is no data at the Berkeley Earth website for some of the poorest countries listed by the CIA. That is, according to the CIA, the countries of Tokelau, South Sudan, and Eritria are among the top-10 poorest countries in the world, but Berkeley Earth does not have data isolated for those countries. (I’m not pointing fingers. I just wanted to document why those countries weren’t included.) So I’ve included the next three poorest countries in terms of GDP/capita and one more for good measure, for which Berkeley Earth does have data. The countries included in this post are, in alphabetical order (links are to their respective CIA The WORLD FACTBOOK webpages), along with their latitudes according to Google:
- Burundi – (3.4 S)
- Central African Republic – (6.6 N)
- Democratic Republic of the Congo – (4.0 S)
- Haiti (not in the top-10 poorest, but included because it’s located near to the United States) – (19.0N)
- Liberia – (6.4 N)
- Madagascar – (18.8 S)
- Malawi – (13.3 S)
- Mozambique – (18.7 S)
- Niger – (17.6 N)
- Sierra Leone – (8.5 N)
- Yemen – (15.6 N)
Hmmm, looking at the latitudes, I believe I see something in common that might dispel some rumors, but let’s confirm that suspicion with data.
REFERENCE COUNTRIES
The countries I’ve selected as references are Liechtenstein and Norway. Why would I use those countries for references? First, according to the CIA’s The WORLD FACTBOOK, the richest country is Liechtenstein…the polar opposite in terms of wealth to the poorest countries. The Berkeley Earth data for Liechtenstein are here. Liechtenstein is found at 47N latitude, so it’s a European nation located in the mid-latitudes of the Northern Hemisphere. Second, considering that most if not all of the poorest countries are in the tropics (often described as the latitudes 24S-24N) and some are large enough so that they also extend into the subtropics (the subtropics include the latitudes from the tropics to 35N or 35S, depending on the hemisphere), I’ve selected Norway (data here) as the other reference. Norway is the northernmost country in the world. Undoubtedly, Norway has one of the harshest climates on Earth in terms of surface air temperatures for any country. Norway’s climate and the changes there are perfect counterpoints to those of tropical poor nations.
WHAT’S BEING PRESENTED?
Three comparison graphs of surface air temperature data are provided for each of the above-listed poorest countries, the curves for which are always shown in maroon. The curves for the reference country of Liechtenstein are in green, while for the other reference Norway they are in light blue.
Figure 1 includes a sample of one of the graphs. It includes surface air temperature data for Haiti along with those of Liechtenstein and Norway. Haiti is among the poorest countries in the world, but it’s not among the poorest 13, of which Berkeley Earth had data for 10. Also, Haiti neighbors the United States.
The graph in Figure 1 presents the multidecadal (30-year, actually 360-month) rates of change in surface air temperatures for the poor country (Haiti) and for the reference countries (Liechtenstein and Norway). 30-year rates of change in surface air temperatures are a great way to present the harshness of climate change for a country. Because weather is always changing, and because the standard definition of climate is weather averaged over periods of 3 decades or more, the 30-year rates of change (trends) in surface air temperatures are prime examples of climate change at work, regardless of whether you believe the changes are caused naturally or as a result of human activity.

Figure 1
But this is not how surface air temperature data are normally presented, so a graph like this may be confusing if you’re not familiar with it. For those requiring an explanation, first note the Title Block where the top line reads “30-Year Trends (Trailing) in Country Land Surface Air Temperatures”. Also note the units of the y-axis (the vertical axis) shown to the left of the graph. The units are Deg C/Decade, not simply Deg C. In other words, we’re illustrating how quickly or how slowly those 30-year trends were and whether, over those 30-year periods, the surface air temperatures were rising (positive data points) or falling (negative data points). The greater a positive [negative] data point is, the faster the surface air temperatures were rising [falling] over the 30-year period. Conversely, the closer a data point is to zero, the slower the surface air temperatures were rising (positive data points) or falling (negative data points) over the 30-year period. Also note the word “Trailing” in the top line of the title block. That means the trend for every 30-year (actually 360-month) period is shown in its final month. The x-axis, of course, is time in years.
If a series of data points is growing farther and farther away from zero with time, that means the 30-year trends are accelerating. Conversely, if a series of data points is growing closer and closer toward zero with time, that means the 30-year trends are decelerating. That is, a drop in the 30-year trends does not mean the surface air temperatures are cooling. To be showing cooling, the data points have to drop into negative values. For example, referring to the trends of our reference country Norway in blue, they peaked at the 30-year period ending about January 2008 at a rate of roughly 0.7 deg C/decade. But as you can plainly see, the 30-year trends dropped off after that so that five years later, the 30-year trends ending in 2013 were down to 0.4 deg C/decade for Norway’s changes in surface air temperatures. That is, the warming there continued through to the 30-year period ending in 2013, but the warming wasn’t happening as fast over the more-recent 30-year periods ending in 2013 as it had been during the 30-year period ending early in 2008.
The massive variations in the rates of surface air temperature change for Norway should come as no surprise to anyone who understands the naturally occurring phenomenon called polar amplification, which not only amplifies the warming at high latitudes of the Northern Hemisphere, but it also amplifies the cooling taking place there during cooling periods (see Figure 3 in the post Notes on Polar Amplification)…except in climate models as we illustrated and discussed in the post Polar Amplification – Observations Versus IPCC Climate Models.
NOTE: The surface air temperature data for individual countries at Berkeley Earth end in 2013, so we don’t know whether the 30-year rates of change in the surface air temperatures of Norway continued their decline…or whether they rose again. I’m not trying to hide anything by stopping the graphs with the 360-month period ending in 2013. The data from mid-2013 to now simply doesn’t exist on those Berkeley Earth webpages for individual countries. [End note.]
There are many noteworthy things shown in Figure 1—one of them being, because the number of positive trend data points exceed the number of data points for negative trends, the overall trend is positive. Another thing that I feel I have to mention now is, even before 1950—after which it is said that mankind began to be the primary influence on global climate—with the reference countries of Liechtenstein and Norway, there were major variations in the 30-year rates at which the surface temperatures for these countries were changing, sometimes warming and sometimes cooling over multidecadal timeframes. Sadly, the rest of the noteworthy things would keep us away from the intent of this post. But feel free to discuss them in the comments.
IMPORTANT NOTE ABOUT THE TREND GRAPHS: As you can plainly see, the variations in the 30-year rates of change in the surface air temperatures of the two reference countries far exceeded the variations in the 30-year rates of change in the surface air temperatures of the poor country Haiti. SPOILER ALERT: You’ll find that to be the case for all of the poorest countries presented in this post. In other words, with these examples, you’ll see that the poorest countries have NOT been hit hardest by climate change in terms of surface air temperature changes. Far from it. In fact, compared to the two references, especially those of Norway, the multidecadal variations in temperature-change rates for the poor country Haiti (and other poor countries, as you shall see) are quite mild…as we might expect for any country located in the tropics. [End note.]
Examples of the second two graphs provided for each country are shown in Figure 2. Both graphs present the average annual variations in monthly surface air temperature for the subject poor nation—Haiti for the example poor country—and the two reference countries Liechtenstein and Norway. The top graph is presented in Deg C, while the bottom graph is presented in Deg F…for visitors from the United States who are more familiar with those units. The curves are based on the average monthly surface air temperatures for the period of 1951-1980, which Berkeley Earth lists on their individual data webpages for each country, along with temperature anomalies. So, we can plainly see that the annual variations in the surface air temperatures of the reference countries are far greater than annual variations of the poor country Haiti. Also, the average monthly surface air temperatures in both reference countries fall below freezing for much of the year, while the average surface air temperatures for the poor country Haiti remain balmy.

Figure 2
And as we all know, cold ambient outdoor temperatures are many times more deadly to humans than hot ambient temperatures. I don’t recall ever discussing that point in a blog post, but I did in my well-illustrated ebook Dad, Why Are You A Global Warming Denier?- A Short Story That’s Right for the Times. In it, the Dad character was having a conversation about that subject with his daughter Anna. That exchange in the ebook, written in the first person by Anna, reads:
Dad was silent while he surfed the web, but then he suddenly said, “Change of topics. Consider this study from a few years ago that confirmed what many people have always thought: far and away more human deaths are caused by cold than heat. The paper Mortality risk attributable to high and low ambient temperature: a multicountry observational study, by Gasparrini, et al., was published in a medical journal, The Lancet, not a science journal, in July, 2015. There was an article in USA Today about it. Ah, there it is. Study: Cold kills 20 times more people than heat. Would you like to read it, Anna?”
“I remember that story. I wondered then why global warming was supposed to be bad, if cold kills more people than heat. Back then I figured it meant that precipitation and sea level were the key problems with global warming. But, you’ve already straightened me out on those two aspects.”
IMPORTANT NOTE ABOUT THE COMPARISON GRAPHS SHOWING THE ANNUAL CYCLES IN SURFACE TEMPERATURES: Not only are the 30-year changes in the surface temperatures noticeably more extreme in the reference not-poor countries than they are in the poor country (Figure 1), the local climates in the reference not-poor countries are also much harsher in terms of annual variations in surface temperatures than they are in the poor country, as shown in Figure 2. Of course the annual variations in temperatures are more temperate in the poorest countries; the poorest countries are located in the tropics. [End note.]
Just in case: While you’re running through the following series of graphs, you might start to think, as I did, that the temperatures of the poor countries are what you want see while you’re on your winter holidays, when you’re trying to get away from Old Man Winter. You’re probably right. Refer to Figure 3, which includes the annual monthly cycles in surface temperatures for Hawaii, Miami and Puerto Vallarta. The data for Hawaii are here, Miami are here, and Puerto Vallarta are here.

Figure 3
That’s enough for the introductory stuff, Bob. Let’s get on with the rest of the presentation.
And I’ll do it without commentary about what the graphs indicate, because, for the most part, I’d be repeating the commentary for the comparisons using Haiti in Figures 1 and 2.
NOTE: Many of the curves for the poor countries are very similar in the 30-year trend graphs. I can assure you they are different. With the annual cycle graphs, the curves for the poor countries can also be similar. But, sometimes, they are different enough to justify changing the scale of the y-axis, as you shall see. But you will find that a couple of the poorest countries have wider variations than the others. Look to see where those countries are located, and you’ll find the answer to those additional variations. [End note.]
Again, the data presentations for the poorest countries run in alphabetical order.
BURUNDI
Figures 4 and 5 present the comparisons of 30-trends and of annual cycles in surface air temperatures for Burundi (data here) compared with the reference countries of Liechtenstein and Norway.

Figure 4
# # #

Figure 5
CENTRAL AFRICAN REPUBLIC
Figures 6 and 7 present the comparisons of 30-trends and of annual cycles in surface air temperatures for Central African Republic (data here) compared with the reference countries of Liechtenstein and Norway.

Figure 6
# # #

Figure 7
DEMOCRATIC REPUBLIC OF THE CONGO
Figures 8 and 9 present the comparisons of 30-trends and of annual cycles in surface air temperatures for Democratic Republic of the Congo (data here) compared with the reference countries of Liechtenstein and Norway.
Figure 8

# # #

Figure 9
LIBERIA
Figures 10 and 11 present the comparisons of 30-trends and of annual cycles in surface air temperatures for Liberia (data here) compared with the reference countries of Liechtenstein and Norway.

Figure 10
# # #

Figure 11
MADAGASCAR
Figures 12 and 13 present the comparisons of 30-trends and of annual cycles in surface air temperatures for Madagascar (data here) compared with the reference countries of Liechtenstein and Norway.

Figure 12
# # #

Figure 13
MALAWI
Figures 14 and 15 present the comparisons of 30-trends and of annual cycles in surface air temperatures for Malawi (data here) compared with the reference countries of Liechtenstein and Norway.

Figure 14
# # #

Figure 15
MOZAMBIQUE
Figures 16 and 17 present the comparisons of 30-trends and of annual cycles in surface air temperatures for Mozambique (data here) compared with the reference countries of Liechtenstein and Norway.

Figure 16
# # #
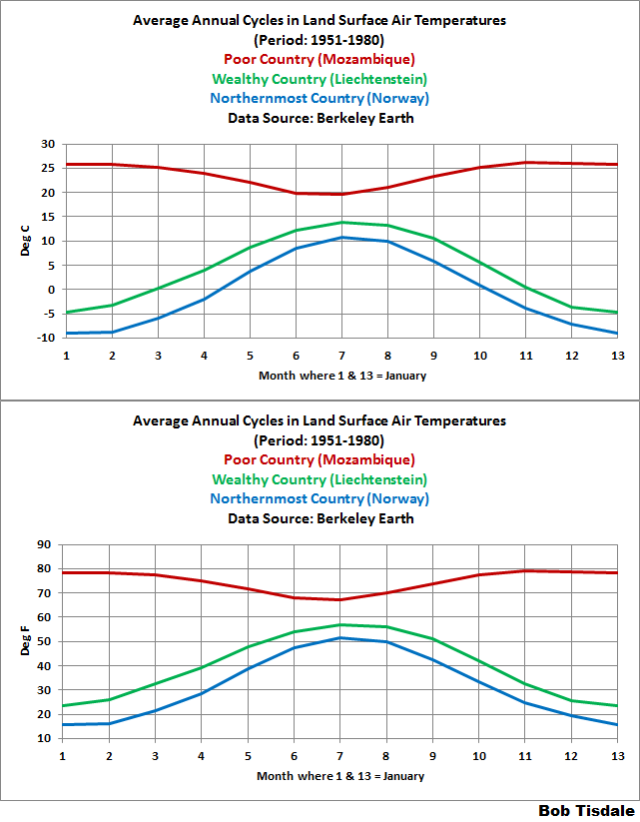
Figure 17
NIGER
Figures 18 and 19 present the comparisons of 30-trends and of annual cycles in surface air temperatures for Niger (data here) compared with the reference countries of Liechtenstein and Norway.

Figure 18
# # #
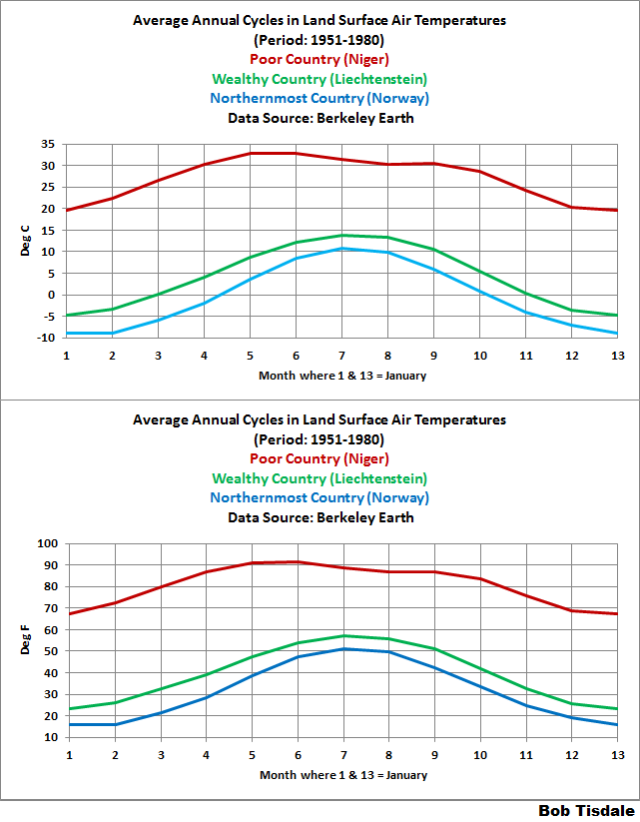
Figure 19
SIERRA LEONE
Figures 20 and 21 present the comparisons of 30-trends and of annual cycles in surface air temperatures for Sierra Leone (data here) compared with the reference countries of Liechtenstein and Norway.

Figure 20
# # #

Figure 21
YEMEN
Figures 22 and 23 present the comparisons of 30-trends and of annual cycles in surface air temperatures for Yemen (data here) compared with the reference countries of Liechtenstein and Norway.

Figure 22
# # #

Figure 23
Well, the data confirms something most of us understand, and it is, climate is always changing, so we humans and the non-human residents of this planet are always used to changes in climate, which result from changes in weather, which is chaotic. And that brings to mind…
THE QUOTE FROM DR. GAVIN SCHMIDT, THE DIRECTOR OF THE NASA GODDARD INSTITUTE OF SPACE STUDIES (GISS)
And that quote, if you’ve been following my recent posts, is:
To be clear, no particular absolute global temperature provides a risk to society, it is the change in temperature compared to what we’ve been used to that matters.
Of course, the above quote comes from Gavin Schmidt, who is the Director of the NASA Goddard Institute of Space Studies. It is from a 2014 post at the “Climate science from real climate scientists” blog RealClimate, and that quote comes from the blog post Absolute temperatures and relative anomalies (Archived here, just in case.). So not to be accused of quoting Gavin out of context, I’ll present the full paragraph. The topic of discussion for the post was the wide span of absolute global mean temperatures [GMT, in the following quote] found in climate models. Gavin wrote (my boldface):
Most scientific discussions implicitly assume that these differences aren’t important i.e. the changes in temperature are robust to errors in the base GMT value, which is true, and perhaps more importantly, are focussed on the change of temperature anyway, since that is what impacts will be tied to. To be clear, no particular absolute global temperature provides a risk to society, it is the change in temperature compared to what we’ve been used to that matters.
Anyone with the slightest bit of common sense knows that, annually, the local ambient temperatures where they live vary much more than the 1-deg C change in global surface temperatures that data show we’ve experienced since preindustrial times and way much more than the 0.5-deg C additional change in global mean surface temperatures the UN has set its sights on trying to prevent in the future.
THAT’S ALL FOR NOW, FOLKS!
Makes you wonder, doesn’t it? With temperature-based climates like those and a little wealth, the poorest countries could be paradises…vacation spots that more and more people from wealthier countries would want to visit on their holidays. I’ll leave it to you to discuss what could help the poorest countries rise up from being poorest, and I think I can guess your answers.
Well, I’ve been stuck indoors for a number of days preparing this post. And it’s another beautiful day in Newfoundland, if you like snow and wind and cold…that’s what they’re forecasting anyway. I’m going to wander outside to go sit on a dock of the bay and watch the tide roll away—Thank you, Otis—so I may be a little slow responding to comments.
If necessary, for a Part 2 to this post, we’ll discuss and illustrate the horrendous climate model performance in their hindcasts of surface temperature and precipitation variability for the tropics/subtropics and for the mid-latitudes.
Have fun in the comments, and enjoy the rest of your day.
STANDARD CLOSING REQUEST
Please purchase my recently published ebooks. As many of you know, this year I published 2 ebooks that are available through Amazon in Kindle format:
- Dad, Why Are You A Global Warming Denier? (For an overview, the blog post that introduced it is here.)
- Dad, Is Climate Getting Worse in the United States? (See the blog post here for an overview.)
And please purchase Anthony Watts’s et al. Climate Change: The Facts – 2017.
To those of you who have purchased them, thank you. To those of you who will purchase them, thank you, too.
Regards,
The poorest countries on Earth have been hit hardest by the mental retardation called socialism. They would be far more capable of handling climate/weather issues if they had access to cheap, abundant energy.
Despotism waiving a banner of Socialism to make it sound benevolent.
Note that several of the major proponents of socialism in America are and have been linguistics professors. Twisting language to hide what you are doing when it is something the majority of people do not want is a very useful tool. Ranks right up there with changing historical facts to fool people about the reality of the past.
2hotel9
Hit hardest?
Many of them vote for it, then suffer the consequences and bitch about it when it’s too late.
The entire concept of socialism should be outlawed considering it’s abject failure wherever it’s raised it’s ugly head.
It really is the scourge of humanity.
That’s because the leftospjere evolutionarily selects for the least intelligent among us. … a bunch of envious, misguided entitlement wonks who think the world owes them a living because somebody did their great great great great ancestor wrong.
I would really love to ask the “caravan” … why do you want to come to the US and vote in the same people who made a dung heap of your home land?
Robert Heinlein laid this out in some detail long before it happened. In the novel To Sail Beyond The Sunset, published in ’87, he goes into it thoroughly in one section. Given he wrote this after seeing much of what he earlier predicted come to pass it sums it up quite well.
“Many of them vote for it” Keeping people misinformed and wrongly educated is the primary weapon in the socialist quiver, another is rigging/manipulating voting to control the outcomes of elections. Vote harvesting has become a popular term in the States of late, it has been used in Third World elections for decades.
“Hit hardest by climate change…” could be a debatable point – you try to spell it out but the statement should be more like “There is less change in land temperature…”. It is easy to argue that “hardest hit” would be a combination of how much temperature change has occurred, how vulnerable is the area, and how much wealth do they have to adapt to it. That is, of course, assuming the arguer already believes in AGW, and that man can actually control the climate (which I don’t).
It is unfortunate that most (maybe all) really poor countries will receive the least benefit from global warming. Places like Russia and Canada are going to really improve in their ability to grow food. What most poor countries need is either really well built seawalls and dikes to keep water out, or really efficient water desalination plants to bring more water in. It seems water plays a big part in poor areas of the world, much more so than mere temperature.
It is just possible that as the Earth warms (mostly naturally), some deserts will receive more rain – I mean Egypt wasn’t always so dry… Wouldn’t that be something, the greening of some desert areas. It is just possible (oh wait! Let me go build a computer model PROVING my point!).
Bad weather is pretty much always affects you more on your bicycle than in your BMW, so We can surmise that poor countries suffer more than rich ones in their 30 years of weather averages that end up being called “climate”. Hence a strong urge for them to insist that “climate” is getting worse, and they feel compensation from rich fuel consuming nations is appropriate. Except that it is usually fuel consuming nations that have the worst climate in terms of cold and snow.
DMacKenzie, you wrote, “Except that it is usually fuel consuming nations that have the worst climate in terms of cold and snow.”
Sounds like a great idea for a post with graphs similar to the ones in this post.
Cheers,
Bob
DMacKenzie, I just ran a quick check and the countries with the highest co2 emissions per capita are generally in the middle-east and the Caribbean (I kid you not). The USA ranked 12th in the list I saw…cold and snowy Canada and Russia weren’t in the running for a top spot.
Regards,
Bob
As a Canadian I am shocked by that statement. I know I have been told that we are one of the top emitters and that made sense to me. We are a big, cold country and we engage heavily in mechanised agriculture. I’ll have to check this out.
On another note, your charts of historical temperatures for Norway are in agreement with my memories of the last 60 years on the Western Canadian plains, at least in terms of the general trends. Tweak the temps the tiniest amount for methodological inconsistencies and the 2000’s are just a repeat of the 1930’s.
An interesting submission. Thanks from the other side of the country, where it is a perfectly normal -17C December morning. Just a little colder than average.
Bob, I spoke far too generally. It’s always more complicated. Those are some interesting numbers there on Wikipedia. Canada 14, US 17, Mexico 4, Panama 2.6, all tons of CO2 yearly per capita. So there is a correlation by how far North one goes, but actually it is mostly by level of industrialization, and also by energy production as you note in the Middle East. Here in my home province of Alberta we are at a shocking 67 compared to most of Canada around 12, search “conference board provincial per capita emissions” to corroborate that number.
Oil and gas production, cement production, fertilizer and chemical plants, coal fired electricity, big agriculture, low population all converge to make the emissions number look high, when in fact we emit all this CO2 on behalf of someone else who gets to claim low emissions. Our own actual home heating, vehicle fuel, etc are quite average.
Those Caribbean nations likely generate their electricity with Diesel fuel and it ends up being a big per capita number.
It is not primarily poverty in certain countries that has made them so vulnerable. It is because incompetence, mismanagement and corruption is so rife. They have not been able to respond adequately to floods, droughts, heat and cold, or take advantage of the better times.
There are many historical records of people dying from the consequences of the weather conditions but invariably other factors made the situation far worse. Take Scotland that from 1695 had three successive harvest failures:
The crops were blighted by easterly “haars” or mists, by sunless drenching summers, by storms, and by early bitter frosts and late snow in autumn. For seven years this calamitous weather continued – the corn rarely ripening and the green, withering grain being shorn in December amidst pouring rain or pelting snow-storms.
It is lunacy to think we can change weather events by squandering huge sums of money on fantasy schemes while a small fraction of this would be more than adequate to manage and adapt to these changing conditions.
The Global Warmunists no longer care about warming, because, well, it pretty much stopped, and also, it isn’t scawy enough. They needed a bigger boogieman, so, enter “Climate Change” and all it’s variations like “Climate Chaos”, and “Climate Catastrophe”, and their favorite “proof” of the existence of this new, bigger, and uber-bad monster is “extreme weather”. Of course, all of this is just magical thinking, that CO2 could suddenly be responsible for all the bad weather, and fires. And that is why CAGW is more like a religion, or “cargo-cult”. No thought, no facts, and no rationality is required. Just Belief.
Poverty and its effects can usually be tracked back to government policies, corruption and stupidity. However, at some point the burden of responsibility does fall upon the people of each country who allow this to go on and do not revolt. For instance, it looks like the French might be waking up to the stupidity of their present administration and much of Europe for that matter seems to be catching on to the fact that they have been lied to. Lack of arms in some of the poorer countries cannot be blamed for lack of revolt as most European countries are functionally disarmed, in the name of safety, of course. Subjugation is, it seems, a state of mind on the part of the subjugated. And no history of freedom to fall back on seems to intensify this state of mind. The Russians went from tzarist oppression to communist oppression and now a basically mafia type of oppressive government run by the previous communists. Freedom is not even a memory there, like in many 3rd world countries with much less or no technological advantages. Government corruption becomes a way of life.
“However, at some point the burden of responsibility does fall upon the people of each country who allow this to go on and do not revolt.”
Revolt is much harder when you don’t have the weapons of said government. Thank god for the 2nd amendment here in the US. The realistic means of revolt against tyranny and, up until recent decades a stellar education system, are probably the biggest reasons our government has been kept in check for 230 years. Okay, being able to publicly point out to the masses how stupid the government is without much fear (first amendment) has certainly helped as well. And we’re quickly losing all of these. Hmmm. Probably not an accident.
keep them stupid and keep them poor
https://www.spectator.co.uk/2017/10/how-the-world-bank-keeps-poor-nations-poor/
Natural disasters hit poor countries most. There is no rise in natural disasters. There is a rise in people. Poor people are decreasing, percentage wise and in absolute numbers.
Bob
I would be very cautious about taking the temperatures of many of these ‘poor’ countries as being any sort of accurate indicator. Taking detailed temperature measurements back to 1930 wouldn’t be high on their list of priorities. The instruments may not also be accurate.
As a further complication is the rapid urbanisation of many of these countries as people have flocked to the cities and population has exploded.
Whilst not specifically mentioned in your article, those who remember bob geldof and Live Aid might like to google at the astonishing rate of population increase since that event in Ethiopia . That must have some impact on temperatures
Tonyb, with respect to your opening paragraph, without reliable temperature and precipitation data for the individual poorest countries, the alarmists cannot document their claims. All I’ve done is present what’s available.
And, lo and behold, not surprisingly in the least bit, what I’ve presented contradicts the claims.
Regards,
Bob
If there was a threat from Global Warming, then the poorest countries would be the hardest hit as they have less resources to deploy against it. As the problem is imaginary, reducing poverty in these nations should be a priority over any idea of combating Earth’s remarkably stable Climate System.
Cannot we just acknowledge that 3rd world countries will not have the intelligence to rectify their dependence on hydrocarbons? Burn wood, burn dung. This is not my fault. And I will not allow myself to feel sorry for their plight. Live within your means — not mine.
If nothing else, this post illustrates a good reason to call the phenomenon “climate change” rather than “global warming.” Since climate is about more than temperature, the article doesn’t effectively rebut the claim that climate change doesn’t adversely affect poor countries more than wealthy ones.
Kristi, you wrote, “Since climate is about more than temperature, the article doesn’t effectively rebut the claim that climate change doesn’t adversely affect poor countries more than wealthy ones.”
Kristi, I’ve clearly shown that the temperature portion of mantra “poorest countries have been hit hardest by human-induced global warming/climate change” is false. It is NOT my responsibility to prove that another portion is wrong. Someone from the other side of the debate has to prove it’s true for other variables like precipitation and supply links to the data in easy-to-use form (as I have done) so that we can verify the results.
With that in mind, I have not found precipitation data for individual countries that are available from a single source, in easy-to-use form, as the temperature data are from Berkeley Earth. But I can show the multidecadal variations in the precipitation data for tropics/subtropics (where the poorest countries are located) as a whole and also the same for the mid-latitudes. I had actually started a post that includes model-data comparisons of those variations. Right now, it’s at the back of a long list of posts, though.
Regards,
Bob
PS, Kristi, In response to your, “…climate is about more than temperature…”:
Temperature is the primary metric used in discussions of climate change. In fact, it is the metric upon which international treaties are based.
Regards,
Bob
PPS: Kristi, how or why did you edit your comment? It now looks like I’m initially responding to some you didn’t say. Please return your comment to its original form.
Bob
Bob … don’t waste your time. You cannot have a reasonable conversation with a card carrying leftist.
‘rebut the claim that climate change doesn’t adversely affect poor countries more than wealthy ones.’
Then advance your economy and stop mitigating GHE.
Climate changes constantly, always has and always will. That does not change the fact that leftists use “climate change” as a tool to keep poor people poor and try to make those who are not poor less wealthy. It is not and has never been about climate, or weather, or sea level, it is about control. People have always adapted to the climate, its what we do.
“……….the article doesn’t effectively rebut the claim that climate change doesn’t adversely affect poor countries more than wealthy ones.
Except the wealthy, i.e. you and me, and everyone else in the western world, including those sleeping rough, can afford the consequences of ideologically driven ‘climate change’, ‘global warming’, or whatever you care to name it because they ultimately have access to fossil fuelled energy to cook and heat with.
For the genuinely poverty stricken in developing worlds, the difference between life and death may mean cooking contaminated bush meat over an open fire made of scavenged twigs.
It beggars belief you can be inhuman enough to hide behind science and justify the deaths of millions every year from abject poverty whilst spouting your utter nonsense on this blog.
Fossil fuel derived energy means the end to poverty and starvation amongst the most deprived yet you support the consensus opinion that the stuff is evil and must be eradicated because CO2 is a problem for you.
How about getting your priorities right. Take care of those dying right now from lack of fossil fuel use instead of worrying about an imagined dystopian future.
Whilst perhaps not politically correct, I think a lot of the problems of the likes of Africa are because of their way of life, not the temperature or the weather.
The “Whiter” races went through at least 3 big ice ages and thus only the fittest to survive did so.
A good example is Australia, before the Whiles arrived in the 1700 period it had no developed in the 60, 000 years of aboriginal occupation.
Australia is situated at almost on the equater at the top, to cold conditions at the bottom, Hobart in Tasmania , but its considered to be a first world nations. .It has extreme weather of all sports, yet the white races coped with whatever nature threw at it.
No doubt I will cop some flack for daring to say this, but history proves that some races appear to cope far better than other races.
MJE
Michael
Development is not only material.
Multiple cultures in “poor countries” assess the “white” Euro cultures as quite backwards when it comes to valuing family, respecting age, and refinement of the spiritual capacities of the human race.
An anthropologist told me, warned me, that it is not possible to know if a culture is static or in rapid internal transformation by looking in from the outside.
Said the “cultures” in the ONLY places left on earth to tolerate slavery, condemn women and children as sex slaves, affirm rape and religious-killings as morally-correct (even mandatory) required actions …
Tolerate? They advocate, merrily.
Just why are we supposed to feel responsible for poor responses from these idiots?
Regarding the Lancet study, by far the highest excess mortality was due to moderate cold, not extreme cold. This makes it unclear how much, if any, positive effect global warming might have on mortality rates.
What is not addressed in the study is why moderate cold is risky. It may be due to indirect factors, such as the greater tendency to stay in enclosed spaces, resulting in higher exposure to airborne germs or indoor air pollution.
“Risk increases slowly and linearly for cold temperatures below the minimum mortality temperature, although some locations (eg, London and Madrid) showed a higher increase for extreme cold than did the others. By contrast, risk generally escalated quickly and non-linearly at high temperatures.”
If climate change tends to increase extremes in heat, in some areas this may outweigh any decline in risk from cold. It’s clearly not a one-to-one ratio, where 5 C above a normal mid-July day in Orlando, FL will result in the same increase in deaths that 5 C above the normal mid-February low would save. In poor, tropical countries like Brazil and Thailand, where death from moderate cold is not high, and extremes cause about equal numbers of deaths, an increase in 5 C at the extremes may be a bane, since these are hotter and more humid to begin with, the poor are less likely to have air conditioning, and may be more likely to work in manual labor outdoors, while the lives saved due to a 5 C increase in low temperature extremes is not likely to have the same impact (judging by the Lancet study). In this case, global warming (manifested by mortality risk in response to extreme temperatures) may impact poor countries more than wealthy ones, on average. In other words, the Lancet study might actually partly support the claim that Tisdale is trying to rebut…but I don’t know. It would be a matter of data and statistics that I don’t have.
Well, if not? And then you’re just wrong. Increase T-min, that’ll be just good
Kristi,
“If…then…may…might…less likely…more likely…not likely…may impact…on average…might actually partly support…But I don’t know.
Good comment.
Kristi
You can look for an upcoming report on the health effects of increased average temperatures in rural homes of poor people in Kyrgyzstan. It is from Fresh Air Netherlands and should be out in January. It addresses several of the questions you pose.
Excessive heat is stressful but has nothing like the impact of chronic cold (defined as being below 18 C). The excess death impact effect of cold is 20 to 50 times as much as extreme heat events, though one can make more general claims for below adequate for above adequate. The cold:hot ratio for deaths is 8:1 in Canada and 16:1 in China.
If the world warmed an average 2 degrees, it would more strongly impact regions closer to the poles and would greatly improve this statistic. Warmer is better for cold, poor people. It also has a positive impact on food production.
The Fresh Air study in Kyrgyzstan is one of the first to study examine the impact on health of highly improved coal and dung burning stoves, locally produced in Bishkek under a World Bank pilot project on winter heating. Reports on that are pending in review. One of the stove designs is already available at the ESMAP website in the Library.
Most of the developing countries are located tropical warm zones. In this zone moisture is the limiting factor for agricultural production. In the middle latitudes where majority of developed countries are located, withdrawal and onset of winter define the crop growing season and thus agricultural production. Moisture availability vary country to country; within a country region to region. However, they vary with natural variability in precipitation — droughts and floods are defined by such cyclic variations. Cyclonic activity is another factor that affect the agricultural production. Here the major problem is transportation of food from surplus to deficit zones and government policies. These vary with country to country — these I presented in my books in 1993-2011. Temperature is not an important factor as crops are grown in three seasons and accordingly the seeds are selected. The UN and World Bank slogans are to pocket money only.
Dr. S. Jeevananda Reddy
This was all predicted by the IPCC that projected that higher latitudes North and South would experience the most warming, as an increase in T-Min rather than T-Max.
These countries are supposedly more likely to be subject to more extreme weather (Cyclones & Hurricanes), but the evidence to support such supposition just isn’t there.
So remember when they bang on about ‘extreme’ ‘heat waves’ in Northern Australia / Southern USA & the Euro-Mediterranean – they are just talking outta their butts.
Well, no, it isn’t true because most people, rich or poor, haven’t been hit by much of anything at all. Most of it still remains in the speculative, modeled, future, and let us not forget that most of the warming after the end of the little ice-age had already occurred before the IPCC and modern global-warming alarmism got into its stride.
It reminds me of the ‘good-old-days’ when Al Gore would talk incessantly about building an “information superhighway”, only for it to suddenly give way to claims that not only had he invented it, but that it was already built. Yet somehow we missed all the intermediate steps.
No one, neither skeptics nor alarmists, should be taken in by claims that large changes due to human climate-influences have already occurred. They have not, and not even the IPCC has claimed that they have. They are merely predicted to (maybe) occur. I’ve probably said that at least twice now, so I’ll stop ranting.
“The war against weather cycles and natural-variability will be long and unimaginably expensive, it may never end so you’d better brace yourselves and be ready to pay through the nose.” – UN IPCC
“We’ve always been at war with natural-variability” – George Orwell, 1984
Close down the United Nations. It had as did its previous one, the League of Nations, such lofty Ideals, but today with its black and brown mix, its nothing more than a soap box for the lesser well off nations to bemoan their lot, and to yet again “Put there hands out for MORE.
M<JE
From what I got used to hearing from climate alarmism, the problem is not the temperature change at any one place in the world, but how it translates into more [droughts]/floods/storms (hurricanes, cyclones). It can be said with high confidence that, no matter what the temperature change is for Norway, the probabilities of hurricanes becoming worse for Norway are about zero. Because there are none. I believe that when they say that the poorest countries will suffer the most, it is not just because they are poor. It is also because they tend to be located in climately hazardous places which could perhaps be one of many reasons why they tend to be poor, while probably not the most important.
This is my understanding, which could be right or wrong, but bottom line is that what matters is how climate extremes are changing, if they are, in each country. Not the average temperature.
https://goo.gl/images/F3vzGv
The biggest problem for “poor countries” is NOT an eventually sea level rise.
But, as landlocked, the lack of access to their own ports by the sea.
With the effect that these landlocked countries have to pay high tariffs and duties to the surrounding countries for both import and export.
Biggest hampers countries can experience.
MOZAMBIQUE:
Home > m > Morak, Franz > Mozambique
Mozambique Songtext
von Franz Morak
Noch keine Übersetzung vorhanden.
Jetzt Übersetzung hinzufügen
MOZAMBIQUE SONGTEXT
Der Schnee vom letzten Jahr hat dich verweht, hat dich verweht.
Die Straßen fegt der Wind, der mir die Seele bläht.
Ich wär’ so gern in Mosamique,
wo die bunten Papageien
on medmose in caramell
still ihre Liebe schreien.
Die Bank ist längst geplündert
und der Zug steht längst schon bereit
und ich sitze hier als lebt ich ohne Zeit.
Ich wär’ so gern in Mosamique,
wo die bunten Papageien
on medmose in calamelle
still ihre Liebe schreien.
Ich sitze hier wie angeklebt
an meinem Tisch, an meinem Tisch
und schütte Gin in mich hinein
wie ein kiemenlsoer Fisch.
Ich wär’ so gern in Mosamique
wo die grünen Papagein
on medmose in Caramelle
schrill ihre Liebe schreien.
Ich wär’ so gern in Mosambique
wo die bunten Papageien
on medmose in caramelle
schrill ihre Liebe schreien.
Der Schnee vom letzten Jahr hat Dich verweht,
die Strassen fegt der Wind…
Noch keine Übersetzung vorhanden.
Jetzt Übersetzung hinzufügen
Lyrics powered by http://www.musixmatch.com