Guest Post by Willis Eschenbach
[UPDATE] I’ve discovered an error in the calculations that invalidates most of this post, with the exception of the snow extent data. See the explanation here.]
As I mentioned in a recent post, the CERES satellite folks have released another year’s worth of data. Since this should have gotten us past the temperature bump related to the 2016-2017 El Nino, I thought I’d take a look at the temperature and the temperature trends. First, the temperature:

Figure 1. Global average surface temperature, CERES satellite data.
Interesting … the trend is quite small, and is not statistically different from zero. Looking at that, I thought I should look to see which parts of the planet have warmed and cooled over that 18-year period. Figure 2 shows that result:

Figure 2. Map showing temperature trends on a 1° latitude by 1° longitude grid, Pacific centered. Areas in green and blue are cooling, and yellow to red are warming.
I love science for the surprises. Here’s the first surprise in this result—on average, the oceans are warming, but the land is cooling. In particular, the entirety of North America has been cooling over the 18 years. Here’s the view from the other side of the planet:

Figure 3. Map showing temperature trends on a 1° latitude by 1° longitude grid, Atlantic centered. Areas in green and blue are cooling, and yellow to red are warming.
And the second surprise is that the southern hemisphere is warming … but the northern hemisphere, with a trend of 0.00°C/decade, is neither warming nor cooling.
Now, we all live on the land. And almost 90% of us live in the Northern Hemisphere. For the last two decades, we’ve been subjected to endless harangues from climate alarmists telling us that the signs of runaway global warming are ALREADY HERE! BE VERY AFRAID!
But for everyone living in North America, in Europe, and in Asia, that’s simply not true. For the last eighteen years, the land has been cooling …
Finally, I’ve never seen a climate model from the turn of the century that predicted that for the first 18 years of the 21st Century the land would be cooling … and despite that, we’re supposed to believe that those same climate models can tell us what the temperatures will be doing in the year 2100 … yeah, that’s totally legit …
And there you have the results of my latest peregrination through the CERES data.
[UPDATE] More information on the time period in question.

Here on the North Coast of California, we’ve had two days of rain, then yesterday a day of sun. After the recent fires we’ve been cleaning up the forest floor, so yesterday we burned a couple of the big piles of limbs and brush that we’ve gathered over the last couple of months. Today … rain again, indoor work.
Best of both rain and sun to everyone,
w.
PS—When you comment, please quote the exact words that you are referring to, so we can all be clear on just who and what you are discussing.
It would be interesting to have temperature soundings that go down x number of feet into various types of ground at strategic points throughout the continents.
If cloud cover is decreasing over land at night, maybe the continents are experiencing radiational cooling.
I think you will find that ground temperatures remain pretty well constant throughout the year at a depth below 3 feet or so.
Looking at the graphic of temperatures two things struck me, firstly to my eyes it looks as if there is a greater area of cooler ocean than warmer. Willis saw it slightly the other way.
Secondly the poles show some 2deg warming which puzzles me. I believe that the satellite data of the poles is difficult to obtain due the orbit and angles ? Antarctic temperature recordings taken at the surface show cooling across the bulk of the continent.
Puzzling ………
Interesting,
the last lot of (air) data I had from a tunnel 3 m down and 5 m in with fully exposed clay faces , grassland above and vertically open to atmosphere at one end shows humidity 80 to 100% variations and temperature 9.5 to 11 C daily variations, I`ll fully encase a datalogger tonight, result back in one month.
The US Geological Survey has run numerous temperature logs in wells of various depths. I have one, for example, that we logged to about 1131 feet below land surface in Maryland (MD Geological Survey Report of Investigations No. 41).
Many workers (myself included) have placed dataloggers in wells to record water level and water temperature. Depending on the hydrologic setting, temperature variation can be interesting and informative. Temperature data are available from the USGS for wells in various settings.
Here is a very good report from the Danish Meteorological Institute (DMI) regarding Greenland snow accumulation. This is the second year in a row of increased mass in Greenland. There is also a great chart showing that glacier retreat has practically halted. This year glaciers are growing in Greenland.
So much for the narrative.
http://polarportal.dk/fileadmin/user_upload/polarportal-saesonrapport-2018-EN.pdf
you missed the fine print
” As this data is
unavailable, it is not possible to say whether
the high SMB of this season also means that
the total mass loss for the 2017-2018 season
is low, as was the case in the 2016-2017
season.
SMB is not the total mass.
As for the narrative, we dont expect monotonic declines. Narrative is told in decades not in years
Narrative, as used by activists, is a rhetorical device. link
The alarmist narrative (CO2 causes everything evil) takes any useful tidbit and blasts it out full force. There shouldn’t be a scientific narrative. Science should not engage in rhetoric.
Everyone, except the rabid, agrees that, when we’re talking climate, we’re working with an extended period. I’m not sure we should use the term ‘narrative’ in that context because the term has picked up a bad connotation and has become tainted in the minds of many.
sorry every prediction is a narrative. A narritive is nothing more than facts in a time sequence.
We we predict a rock will fall we are telling a story. A happens, then B happens.
The most twisted rhetoric is the story that we can avoid rhetoric.
A few other things. There is bad rhetoric, like the strawman.. for example
‘(CO2 causes everything evil)”
I have scoured the IPCC, the master narrative, and I didnt find this claim. If you are going to burn strawmen please get a burn permit from the moderator here
You ignored or did not understand what I said. Activists have a special use for the term ‘narrative’ as pointed out in the link I provided. It produces a separate connotation for the term ‘narrative’ which is that of a propaganda tool. You can insist on the dictionary definition if you wish but please be aware that many of your readers will get a meaning that you did not intend.
The fact that the alarmist narrative is that CO2 produces everything evil is amply demonstrated by the plethora of alarmist pronouncements. You will not find those exact words cited by the IPCC but relying on that just makes it obvious that you are being disingenuous.
The events in a narrative don’t have to be true nor do they have to be facts.
A prediction of rain tomorrow is not a fact until tomorrow becomes today. Prior to that it remains a probability.
Sorry that makes no sense. A prediction cannot be a fact. So how can a narrative (prediction) be facts in a sequence?
And a narrative is just a story. It doesn’t have to be facts nor does it have to be in as time sequence.
But since you don’t understand the literary devices hyperbole you can’t be expected to understand narrative I suppose. Odd given your degree?
And have you really scoured the literature or is that a hyperbole too?
Yet we are told that climate scientists don’t make predictions, they make projections.
The next time I read there was no MWP because of a lack of synchronization of warming, I’ll think of these maps.
“Sorry that makes no sense. A prediction cannot be a fact. So how can a narrative (prediction) be facts in a sequence?”
simple: I say fact B will happen and then fact J will happen.
If you do X, you will see Y
both X and Y are ‘facts”, future facts to be sure.
Noting that both of these “facts” are in the future and technically not facts, is a rather dumb interpretation.
you have to work hard to misunderstand people. pat yourself on the back
Ya’ll seem hypersensitive about the term “narritive” It’s not scary.
Steven is correct. To be clear, it should be referred to as the alarmist narrative. The alarmist narrative is told on a minute by minute basis, with the claim that 100 years from now it will be very, very bad. A boring narrative since the end is always the same.
that’s been obvious (to most everyone who reads his drive-by posts) for a long, long time now.
It’s not an interpretation, it’s a fact (as opposed to your “facts”).
Fact: a thing that is known or proved to be true.
if it hasn’t happened yet, then it isn’t known or proven to be true ergo by definition it is not a fact. You were going on about definitions earlier, so you of all people should understand the usefulness of definitions. So calling things that are not facts as facts is a lie.
I’ll give you an example. When I was a pup, the word fulsome was accepted to mean excessive and, in the case of ‘fulsome praise’, insincere. Since about 1961, some folks have started using the word with its obsolete meaning as in: ‘We must have a fulsome discussion’. As far as I can tell, folks who use it that way aren’t aware of the dictionary definition. Apparently they use the word because they just think it sounds more sophisticated. Never mind, language change is often led by the illiterate.
As a result of the above, I do not normally use the word ‘fulsome’ unless I’m feeling mischievous.
The word ‘narrative’ has picked up a bad connotation. Many here use it in a pejorative sense and it is mostly understood as such. You have to reflect on whether insisting on the strict dictionary definition might make you a mumpsimus.
Well, yes, “narrative” is a bit of a scary word. It doesn’t have to be and it certainly depends on the context. If I understand Mosher correctly, he’s saying that the scary alarmist narrative isn’t in the IPCC, and this may be true, but I’d say that the way the narrative is couched by the IPCC, in terms of probabilities or percent uncertainties, allows the scary narrative to unfold and be used by others in a form such as: “if we don’t do something NOW we MIGHT destroy the earth.” And then we get silly things like Exxon knew and those evil bastards are out to destroy the earth for profit, and so on, in a type of mass hysteria.
But more than that, the narrative (of possible disaster) is what allows causation to be misappropriated in order to support the derivative narrative that it’s all happening right now before our eyes. My biggest gripe with climate science isn’t that is supposes that certain things might happen and has some evidence to support this. My biggest gripe is that it assumes that certain things must be caused by what they suppose might happen.
For example, it’s theoretically possible that CO2 might be warming the oceans but I don’t think there’s any good evidence for this, and if we look around objectively and set our defense of the CO2 paradigm aside (!!!!) we can find sounder and more direct reasons for ocean warming. However, those captured by the alarmist narrative have lost their objectivity, and instead of saying for example that New England fisheries have been decimated by a number of clear causes that we can point to right now, such as overfishing (the primary cause,) seal overpopulation, and a shifting AMO, we now say, as an MIT-educated engineer said to me recently, that NE fisheries are dying because of global warming. So to me this overall CO2 narrative is very scary because here’s an intelligent, educated person telling me hogwash. Even PhD scientists swallow that what might happen is a primary causation for what’s happening now and this blinds them, and besides that is just plain silly.
But let me back-up to the meta-narrative, and for this I blame people like Naomi Oreskes who insist that WE ARE BEING DECEIVED by the oil companies, deliberately, to create doubt in the narrative that CO2 will destroy us. Well you can’t really count the ways this is dumb, but one of them is that the uncertainty was always there and no one had to create it, not even Exxon. This false narrative, however, is very efficient: it justifies disregarding the other side of the argument (the skeptic side) because doubt (so the narrative goes) was deliberately created by those wanting to deceive us.
The meta-narrative is what makes people lose their sense. You can’t talk evidence to them because the NYTimes agrees with Oreskes and that’s the end of the story; there’s no other narrative, no other side of the story, nothing to think about, noting to weigh, nothing to question. That’s the essence of the Orwellian meta-narrative.
So narratives can be quite scary and can have a lot of power. We are, after all, a story-telling people.
/end rant
Don132
The “global warming” narrative has become the “climate change narrative” and both are connected implicitly through : “man can change climate by changing behavior”.
Of course climate is changing through the years, the point is “if we jump up and down and hold our breath, will the climate change?” (this is irony) And that needs mathematical answers, not narratives.
As far as I read through the programs, the feedback mechanism which has no experimental validation for the size assumed , is what generates the narrative , and the grants and feed at the trough keep it going. It is true that I have given up checking , I am waiting for nature to take its course as seen in the ice ages records.
anna v, good points.
I don’t think it’s so much the feedback mechanisms that generate the narrative as it is the assumption that there is no other side to the story. The narrative depends on the skeptic side– the side that points out the many uncertainties and assumptions and counter-examples– being essentially erased in the mainstream world.
Note the recent opinion piece by Paul Krugman, in which he states that “there are almost no good-faith climate-change deniers. And denying science for profit, political advantage or ego satisfaction is not O.K.; when failure to act on the science may have terrible consequences, denial is, as I said, depraved.”
So there you have it, straight out of the Merchants of Doubt playbook: all deniers are either paid-off or anti-science, DO NOT LISTEN TO THEM. That’s the master-narrative, courtesy of Oreskes and company, that’s essential for this whole thing to survive, because if anyone started to look at both sides with an open mind then the inescapable conclusion would have to be that consensus climate science engages in turning assumptions and speculation into irrefutable science; or, to put it more kindly and with a nod to Mosher, consensus climate science refuses to correct the public misconceptions regarding uncertainty and causality (even though in many cases consensus climate science deliberately distorts causality, as in the case of GBR bleaching.) That’s why it’s essential that people don’t look at both sides; that’s why Santer and Orestes don’t want any audit of climate science; that’s why they tout a “transparency” in climate science that’s fictitious, since the whole point is that no one is to look beyond the opacity. It’s a win-win: scientists get the funding, bankers get to make billions off of carbon trading. What’s not to like?
Should we call it Oreskianism, since it’s so similar to Lysenkoism.
Don132
Steve, we’re not (unfortunately) talking about what the IPCC says. We’re talking about what the Summary for Policymakers says or what the BBC says or what David Attenborough says or the reports from the current COP, all x,000 activists of them.
And of course the politicians for whom this whole business is a godsend.
You and I and Anthony may be interested in the science but we are not the ones making the decisions and we are in a minority.
I have to agree with commieBob. Science leads, you follow (if you are a scientist). Narratives are for storytellers, PR men and climate activists with an agenda.
Actually, there are many documented examples of positive effects of increased CO2, but almost no documentable examples of detrimental effects. Example: the increased greening of the planet (sat data) and increased harvest of grains.
More people die from severe cold than warm episodes
Newminster:
Science is a narrative, too. It’s a narrative about observations and causes/effects, etc.
What’s happening is that this legitimate narrative is being overpowered by a narrative that says that science is consensus.
Consensus climate scientists are keen to control the narrative.
The legitimate *scientific* narrative about uncertainty and natural variation is being replaced by a narrative of irrefutability and a CO2 control knob, and this works because we’re told that those who disagree are just paid off or are anti-science.
Don132
Commie B and Steven
They are not predictions, they are projections, as in a climate model’s projection.
A prediction can only be made when the model has been validated. One thing we have lots of in this realm is un-validated climate models.
The IPCC does not permit the use of the term “prediction” any longer in its documentation, because there are none.
Yes Steve it is told over decades, something we keep telling the alarmist, but to no avail. But then you know that don’t you.
Ha ha ha … Steve Mosher reduced to quoting the fine print! Ya gotta love it!
Well done Willis.
Psst ( it’s not actually fine print) and I wasnt responding to Willis, but rather Dennis Wingo.
people make this mistake on Social media all the time.
1. DMI reports SMB first.
2. SMB is not the sum total of ice.
3. It takes a while to get the entire mass loss for Greenland.
4. in 2018 we probably wont have it because GRACE is lost and the next version is not on line.
5. There is no expectation for the SMB to decrease every year.. WHY?
because as it warms in some places we may see more snow… example Greenland
and snow contributes to SMB.
6. Over decades –as the pages turn at that rate in this story– you will see Total ice go down.
Steven Mosher.
Your statements 1 to 3 and 5 are facts. Your statement 6 is not even a prediction but a mere assertion since it does not follow from the facts that you have [stated] .
And, to add to the “fact” presented by Mr. Green, is another “fact” that the people who focused on the “narrative” for more than a decade assured us that by now the glaciers would be gone and the seas would rise to harmful levels displacing millions. The “fact” is that number 6 is your conjecture and nothing more. However, given that total Arctic Sea Ice has been receding for more than 10,000 years, I’m afraid your conjecture is a wee bit simplistic. How about you make a conjecture right here based on science as to how much the ice will be reduced in excess of what would have occurred if humans weren’t burning petroleum products. That is the real question isn’t it, and you are silent on that, why?
Using sciencey words doesn’t make it science. So how many decades do you want to use? Three? Eight? Twenty? How many and based on what?
For Ice?
Jeez, for temperatures my experience says 20 to 30 years. Technically Signal to noise .
Hmm Reference Santer who thought around 17 years, but I always thought he was a bit aggressive. Ice? subject to non climatic forces. I’d have to do a formal look at it, but I know enough to say ignore shit under 10 years, easily ignore it. Would not surprise me at all to see ice losses go flat for 20 years. In the same way I would ignore a massive ice loss in a single year I would ignore a small gain in a single year. But hey, if you think differently go do that analysis that shows 1 or 2 years is enough to draw a conclusion. Me? not gunna waste my time. Maybe you’ll get a Nobel!
20 to 30 years for T when complete ocean cycles take far longer is arbitrary and anti-science.
Not really David, if the cycles are as knowable as you claim.
Steve you are usually quite inventive. Can you come up with a credible mechanism whereby decreasing mass of an icecap causes the major outlet glaciers to advance?
Well we better get out there and grow that glacier, because…um…you know, it’s important that mankind spend trillions to control such things. (face palm)
Here is a nice narrative for you
https://www.youtube.com/watch?time_continue=399&v=6iM_f_j7H08
watch the whole thing, especially around 5:40
My innate sense has been that it’s actually been slightly cooler on average here in N. CA. for the past few years. Nice to see that I might have sensed correctly!
so this is air temperature and the data is nudged slightly upward by the 2016 El Nino.
the oceans exhibit a warmer surface during an El Nino so they impact the air above and over the oceans. We again have an El Nino but a weaker one and next year this will subside.
Will the air over the oceans cool then. The results are clearly disappointing to the CAGW’s but what a great story for the shagged over poor that have had their wealth transfer’s redirected to the ruling class or the social welfare class.
‘We again have an El Nino but a weaker one and next year this will subside.’
Bill there is a better than even chance that a strong El Nino will begin to ramp up in July next year. I’m relying on Ian Wilson’s moon hypothesis.
Darn good thing all this is all settled science, otherwise it might be hard to explain.
Scientists had just gotten around to accepting a cooling Antarctic and spun the blame CO2 in the stratosphere a few years ago. Then earlier this year, some scientists concluded that Antarctic cooling was predominately due to tropospheric water vapor (which inspired Mosh to say, “duh”).
But according to CERES, the Antarctic has not only warmed over the past 18 yrs instead of cooled, but it has warmed faster than land, water, and the Arctic.
You need to be careful when you say either the Arctic or Antarctic has warmed. Perhaps warmer, but still frightfully cold. The activists recently claimed the Arctic was super hot, but examination showed that it was actually over 30 C below freezing.
Ar satellites the best way to look at the Poles?
They tend to looking askance down there.
It’s worth asking “When?” when we say the Arctic or Antarctica is “warming”. Certainly the annual average may go up, but if that is because the Winter temp is up it is really meaningless. Consider if Autumn, Spring and summer stayed the same but Winter temps were up 4 degrees (Going from -50 to -46 degrees C) So the annual average is up 1 degree C.
Is there going to be an increased ice melt? Of course not.
This is why access to actual data is so important, it tells you when things happen.
18 years of nothing as far as climate change? Don’t worry, it will still be spun as an imminent disaster.
So Australia, Argentina, the far Arctic, and Antarctica are somewhat warmer? Even so. it’s not much.
Yes 18 years is nothing, but back in the 1990’s there were predictions of northern winters without snow that should be occurring now, that were totally incorrect predictions. If anything, the opposite is true snow levels in many major cities show an upward trend. Same with those totally wrong Arctic sea ice predictions. I don’t see how any prediction for 50 and 100 years out can even be remotely within 2 standard deviations when weather forecasts beyond 12 days out showing very little accuracy with what actually happens. Sure most of the people making these predictions will be dead in 30 years. LOL.
If you subtract the “warmer” winter polar areas (caused by elevated water vapor not CO2) from any estimate of the earths surface temperature the planet has cooled since the 1990’s and will likely cool at least another 1 degrees C further from today in the next 20-30 years. Most of the temperature increase reported from the early 1900’s to the late 1990’s was the result of data manipulation of historical climate data by those very people who are making these outlandish doomsday predictions.” The trends show the ACE index is down, tornadoes are down and hurricanes are down. Even day time high temperatures above 90 degrees is down in urban areas. The only area which shows an upward trend is the nighttime lows and that is caused by the increase in land use development and infrastructure in urban and suburban areas (UHI effect) and has nothing to do with CO2. By the end of Solar Cycle 25 the cooler climate trends will not be disputable anymore. We think the Sun’s energy is nearly constant, but its not and its decreasing slightly from cycle to cycle. The solar scientists are another group who have made predictions of high trend solar cycles that have not panned out. Plus the earth is overdue to have several major volcano eruption in the upcoming decades and the Atlantic Multi-Decadal Oscillation will soon be entering its cool phase. The combination of all these factors will cool the planet significantly in the coming decades. These warming predictions will be shown to be totally bad science. This will likely result in more climate data manipulation and more propaganda by the climate and energy control Nazi. Its going to be one great ride to see how they come up with excuses. I hope I live long enough to see it unfold.
which specific surface temperature dataset are you using.
not seeing one in their catalog
Steve, I convert their surface upwelling radiation dataset to temperature using the S-B equation. I’ve checked the conversion against a variety of datasets (TAO buoy data, HadCRUT data, Reynolds SST data) and found excellent agreement.
Regards,
w.
Steve, I’ve converted their surface upwelling longwave dataset to temperature using the S-B equation. I’ve checked it against a variety of other datasets (Reynolds OI SST, TAO Buoys, HadCRUT) and found excellent agreement.
w.
Ah so it’s a skin/surface related temperature
That is the only measurable surface temperature.
Willis Eschenbach
December 5, 2018 at 6:32 pm :
Many thanks for this most interesting interpretation.
I must say I can’t get too upset over 0.7C increase per century!
well be thankful you don’t live in Australia — most of it appears to have
a trend of between 10 and 20 degrees increase per century. Such an increase
would render most of Western Australia uninhabitable.
Most of Western Australia has been uninhabitable for a very long time. Well, by normal standards it’s uninhabitable, though various aboriginal groups seem to do OK there. Western Australia is divided into various regions, such as The Great Victoria Desert, The Great Sandy Desert, The Tanami Desert, The Gibson Desert and The Little Sandy Desert. There are no gaps between the named deserts – it’s really one great big desert.
Those of us who live in the Eastern states think that most of Western Australia always was uninhabitable.
Roha, precisely !
“and found excellent agreement”
Isn’t this post saying that agreement is poor?
yes,
I would have to check what emissivity Willis used to calculate the T from SB
Perhaps he used a constant emissivity. I think he had a post on his approach
weird things to note.
the trend divergence when you move from ocean to land. See the USA versus Australia.
Not sure if sharp trend divergence make physical sense over an 18 year period
See also the missing cool patch off greenland
I’m not a big fan of the color map approach to looking at trends.
Also not sure how this differs from standard LST estimates which do take differing emissivity into account.
Steven Mosher
December 5, 2018 at 10:09 pm :
Yes, I agree about coloured maps…especially when trying to see colours on a small computer screen or a phone.
I like contour maps…no need for colour and the figures on the contour lines are there for all to see.
I am trying not to be super picky about the colors, since I use the same thing in xploratory work
Willis does exploratory analysis…. EDA , so for that the color approach is quick and dirty
and you can usually spot stuff ( especially odd ball stuff)
I trust he wont take it as a criticsm, just my preference.. old eyes on a small screen
Heat maps are a detestable invention.
When you say “missing cool patch off Greenland” do you mean there isn’t one when there should be? Because there is a very largish patch to the south-east of Greenland that’s at -0.4°C if the color scale is to be believed.
“Steve, I’ve converted their surface upwelling longwave dataset to temperature using the S-B equation. I’ve checked it against a variety of other datasets (Reynolds OI SST, TAO Buoys, HadCRUT) and found excellent agreement.”
But HadCRUT shows more than twice the warming you claim since 2000. Even UAH shows almost twice as much warming.
In any event it’s confusing to show a temperature graph and claim it’s CERES data, when it’s your model based on CERES data.
Looks like equatorial zone had no warming and the Arctic and Antarctica had some of the highest warming.
I wonder if in general any future warming will affect the warmest zones (equator) least and the coolest zones (polar) the most.
According to the official story the coldest areas will warm the fastest, but it could also be argued that the cold air is moving to the midlatitudes.
On the question of why the SH is warmer, may I suggest a mini bipolar seesaw.
They seem to be saying that the NH is warmer than the SH.
https://www.researchgate.net/publication/258778329_Why_is_the_Northern_Hemisphere_warmer_than_the_Southern_Hemisphere
If warming occurs more in colder areas then this could explain why there is a larger warming trend in the SH.
That abstract is unsound, because climate changed in the Austral winter 2017, a meandering jet stream and a loss of intensity in the subtropical ridge is producing blocking highs. Low pressure troughs from the tropics are joining up with cold air outbreaks from Antartica.
On the ground there will be days of scorching heat followed by a few days of below average cooling with snow on the high peaks. Its a sign of global cooling.
Willis,
I’m sorry that I haven’t been following the CERES series as closely as I should. I’m not sure how CERES actually gets surface temperature data. So I looked, here for example, but could only find fluxes. Does CERES use a GCM or similar to deduce temperatures?
I see Mosh asked the same question. CERES is of course not measuring upwelling IR directly at the surface. EBAF means an energy balance model is used. The IR that appears to CERES to come from the surface has the GHG component removed and replaced by emission from a higher level, so that would take out some of the trend.
Agreed. With CERES we don’t really know what the surface is emitting but how much the GHGs allow to leave Earth. If the ammount is going down, it doesn’t necessarily mean that the surface is cooling (nor warming). Surface could actually be emitting more (by warming) but a greater percent of that radiation being blocked by increasing GHGs.
OTOH, by comparing total emission and total incoming energy, we should be able to detect if the planet as a whole is warming or cooling. If Incoming > Outgoing, the planet has to be warming, and if the Outgoing has increased but the Incoming has decreased (even if both very slightly), then the planet as a whole must be cooling more than before, or warming less than before.
Don’t you think, Willis?
Incoming > Outgoing does not automatically mean the planet is warming. How much energy is being stored in carbohydrates? If the planet is greening then an increasing amount of incoming energy is being captured and stored by flora.
As I recall, the issue here is trying to subtract two relatively large numbers to get a fairly small number that winds up being in the error band of the two methodologies. I had the same issue trying to use a calorimeter to get the heat of formation of a new compound. Our lab equipment just didn’t have the accuracy. We couldn’t even get a consistent sign for the ΔHf
This would suggest a somewhat unintuitive explanation of the apparent warming in inland Antarctica, since the more or less permanent temperature inversion there means that more GHG will result in an increase in upwelling radiation, but a decrease in surface temperature.
https://www.ethz.ch/content/dam/ethz/special-interest/usys/iac/iac-dam/documents/edu/courses/radiation_and_climate_change/Schmithuesen_GRL2016.pdf
And the climate will continue to respond according to the sun, orbit, spin angle, etc. and the joules of energy that the sun throws at it will continue to be thrown back to space at the exactly balanced rate it always is. That energy may slosh about a bit before leaving but the universe (and its current 2 degree kelvin ground) demands balance and has nothing left over for any global heating.
Once the tall foreheads realize that 100% of the atmosphere and all its various energy paths must be involved in the greenhouse warming theory and not just their pet little radiators, their models might get somewhere. After all the “natural” atmosphere still makes up 99.988 % of our current atmosphere and must have some effect. Of course them and their herders don’t like straight lines on the graphs though.
Of course the atmosphere has an effect. It is heated, 24 hours per day on one side, while it radiates at all times on both sides. Heating from the sun is faster than cooling from radiation, so it takes longer to cool than to heat. And atmosphere can only cool by radiation from radiative molecules, and by conduction with other particles, including the surface Got fog?
It is ludicrous for anyone to assume they can subtract the sun and clouds and their daily effect, from the effect of CO2 molecules in our atmosphere, and predict what will happen in another century. Even more important – 95% of all CO2 is naturally emitted and absorbed each year. That means, if you will, that the 5% that is human caused is supposedly responsible for ‘global warming’. Really? 5% of 400 ppm is 20ppm. Ok, that 20 ppm is responsible for ALL OF THOSE THINGS BLAMED ON CO2@?????@@ Really? No WONDER I’m an AGW skeptic!!
For the past decade I’ve maintained a monthly update of the rolling 12 month average min and max at the 32 oldest weather stations in Western Australia.
Their mean temperature from Jan 2012 to Dec 2015 was 20.2C. From Jan 2016 to Dec 2017, their mean temp was 19.7C, a 0.5C cooling.
The Agriculture Department maintains a network of stations, concentred more in the south of Western Australia, and a comparison of unbroken readings in all months of 2015 compared to Dec 2017 to Nov 2018 at 117 stations shows a mean temp cooling of 0.36C.
The BoM has 25 WA stations in its official ACORN network and they show that from 2012-2015 to 2016-2017, absolute mean temps cooled by 0.1C.
So if southern hemisphere temps have been warming since 2000, the trend has reversed over the past couple of years in the 2.65 million square kilometres of Western Australia.
Just for reference, Skeptical Science’s Global Temp Calculator shows the following trends from March 2000~February 2018:
UAH6.0: 0.13C/decade
RSS4.0: .19C/decade
GISTEMP: 0.21C/decade
HADCRUT4: 0.16C/decade
From Jan 1979~Nov 2018 (or latest available data):
UAH6.0: 0.13C/decade (same as Dr. Spencer’s UAH6.0 stated trend)
RSS4.0: .20C/decade
GISTEMP: 0.17C/decade
HADCRUT4: 0.17C/decade
UAH6.0 is currently the only remaining accurate global temp dataset given the huge and highly questionable “adjustments” (always to increase warming trends) made to the raw temp data of the other global temp datasets.
The CERES trend (0.07C/decade) is almost half that of UAH6.0 (0.13C/decade). What do you think is the reason for the different trends between UAH6.0 and CERES?
BTW, the warming spike from the 2015/16 Super El Nino has not yet been negated because the following La Nina (2016/18) was a weak one. We’re currently in another moderate El Nino cycle which should run through the middle of 2019, so we’ll get another small El Nino spike over the next 8~9 months or so.
The next La Nina (2020/21) will likely be strong as the last strong one was 2010/11, and strong ones usually occur every 10 years or so (2010/11, 2007/08, 98/00, 88/89, 75/76). Accordingly, the 2015/16 Super El Nino will likely not be negated until after the 2020/21 strong La Nina cycle.
The CERES satellites measure the outgoing long wavelength radiation in three broadband
channels. As such they can’t measure the temperature at the surface rather they are measuring
the temperature from the minimum altitude where the infra-red is emitted without being signficantly
absorbed. Which is definitely not the surface due to the greenhouse effect. My guess and it is
definitely a guess is that increasing CO2 concentrations raise the altitude at which the radiation
is being emitted and so the radiation is continually being emitted from a relatively colder altitude
which is reducing the trend compared to the surface.
Percy-san:
Willis uses an algorithm to convert CERES surface upwelling longwave radiation to derive global surface temperatures.
BTW, UAH6.0 measures global temp anomalies of the Lower Troposphere, not global surface temps. According to the CAGW hypothesis, the lower troposphere should be warming at a faster pace than surface temps because that is where most of the supposed CO2 downwelling forcing is occurring… not so much… All other datasets show warming trends 25% higher than UAH6.0, which doesn’t fit the bogus CAGW hypothesis….
Hi Samurai,
Willis can talk for himself but the way I read what he did is he calculated an
emission temperature from the total measured power. There is no way to determine
where that light was emitted from using the CERES satellites. There is no way this
is the surface temperature.
From Alaska to Baja, the eastern Pacific is a nice lemon color (0.4), that is, a warming trend.
What does that mean in terms of (you @ 6:32) ” their surface upwelling longwave dataset” ?
Can this be interpreted as the ocean is radiating more energy near the end of the period (2000-2018) than at the beginning?
Another way of saying: Ocean contains much energy and now radiating faster than before (a sluggish response), while the land – less of a storage system and a faster response – has less heat remaing and thus shows cooling.
Response to what?
It appears that if you removed the polar areas the result would be darn close to zero. It appears there might have some effect in the very cold/dry areas. Otherwise, looks pretty unimpressive.
I’ve added the following update to the head post regarding the time period in question:
w.
The closer one gets to the equator, the closer the classic “Sea ice reflects heat from the sun and so cools the earth” comes towards actual measured radiation.
There are five sea ice regions below the north coast of Canada, Alsaka, Russia, and Siberia (all roughly 70 degrees north, defining the coasts of the “classic” Arctic Ocean): Antarctic sea ice, Sea of Okhotsk, Bering Sea, Hudson Bay, and the very small Gulf of St Lawrence.
And for the first time in the sea ice record, summer sea ice at the three furthest north (Okhotsk, Hudson Bay, and Bering Sea) did NOT melt out over the summer months in 2016, 2017, and 2018.
Now, granted Hudson Bay seldom melts out completely, but its sea ice extent a few days ago was some 100,000 km^2 greater than any day previous in the record. Total sea ice at latitude 60 is greater this month (Oct-Nov) than in any in the past 20 years.
The Bering Sea and Sea of Okhotsk retained sea ice through August and Sept minimums in 2015 and 2016 also. but these records were erased by the NSIDC in July this year. So 2018 “officially” remains the first year these two did not melt out.
Are you saying increased ice corresponds to cooling, just as increased snow cover?
“And for the first time in the sea ice record, summer sea ice at the three furthest north (Okhotsk, Hudson Bay, and Bering Sea) did NOT melt out over the summer months in 2016, 2017, and 2018.”
Oh yes, it did. If you don’t believe me, go to
https://worldview.earthdata.nasa.gov/
and check for yourself.
David A
Yes. and No.
Specifically, at the very high latitudes of Arctic Sea ice (72 degrees north to the pole), less sea ice year-round increases heat loss from the comparatively warm Arctic Ocean surface to the infinite black coldness of space, and thus yields a greater heat loss, and thus a cooler planet.
At the latitude BELOW 60-65 north, greater sea ice year round (greater land ice and snow cover) increases fall, winter, and spring reflection of solar energy and thus cools the planet.
At latitudes below 55-60 north, less sea ice does increase spring, summer, and fall absorption of solar energy, does NOT substantially increase cooling of the open water surfaces, and thus DOES tend to increase global average temperatures.
Except there is NO sea ice between latitude 56 north and latitude 56 south, so this argument by the NSIDC-NASA-GISS-NWS-NOAA-etc is meaningless in the real world. (Save the St Lawrence Channel, which we are tracking with the latitude 60 sea ice total.)
tty:
Oh. You like looking at images? I prefer data.
Bering Sea Ice Area. from NSIDC. Not a graphic.
Your snow cover confirm my results.
Namely. It is cooling at the higher altitudes. Especially in winter.
Are you implying that cooling land and increased snow cover is logical?
David
What,
exactly is it that melts snow?
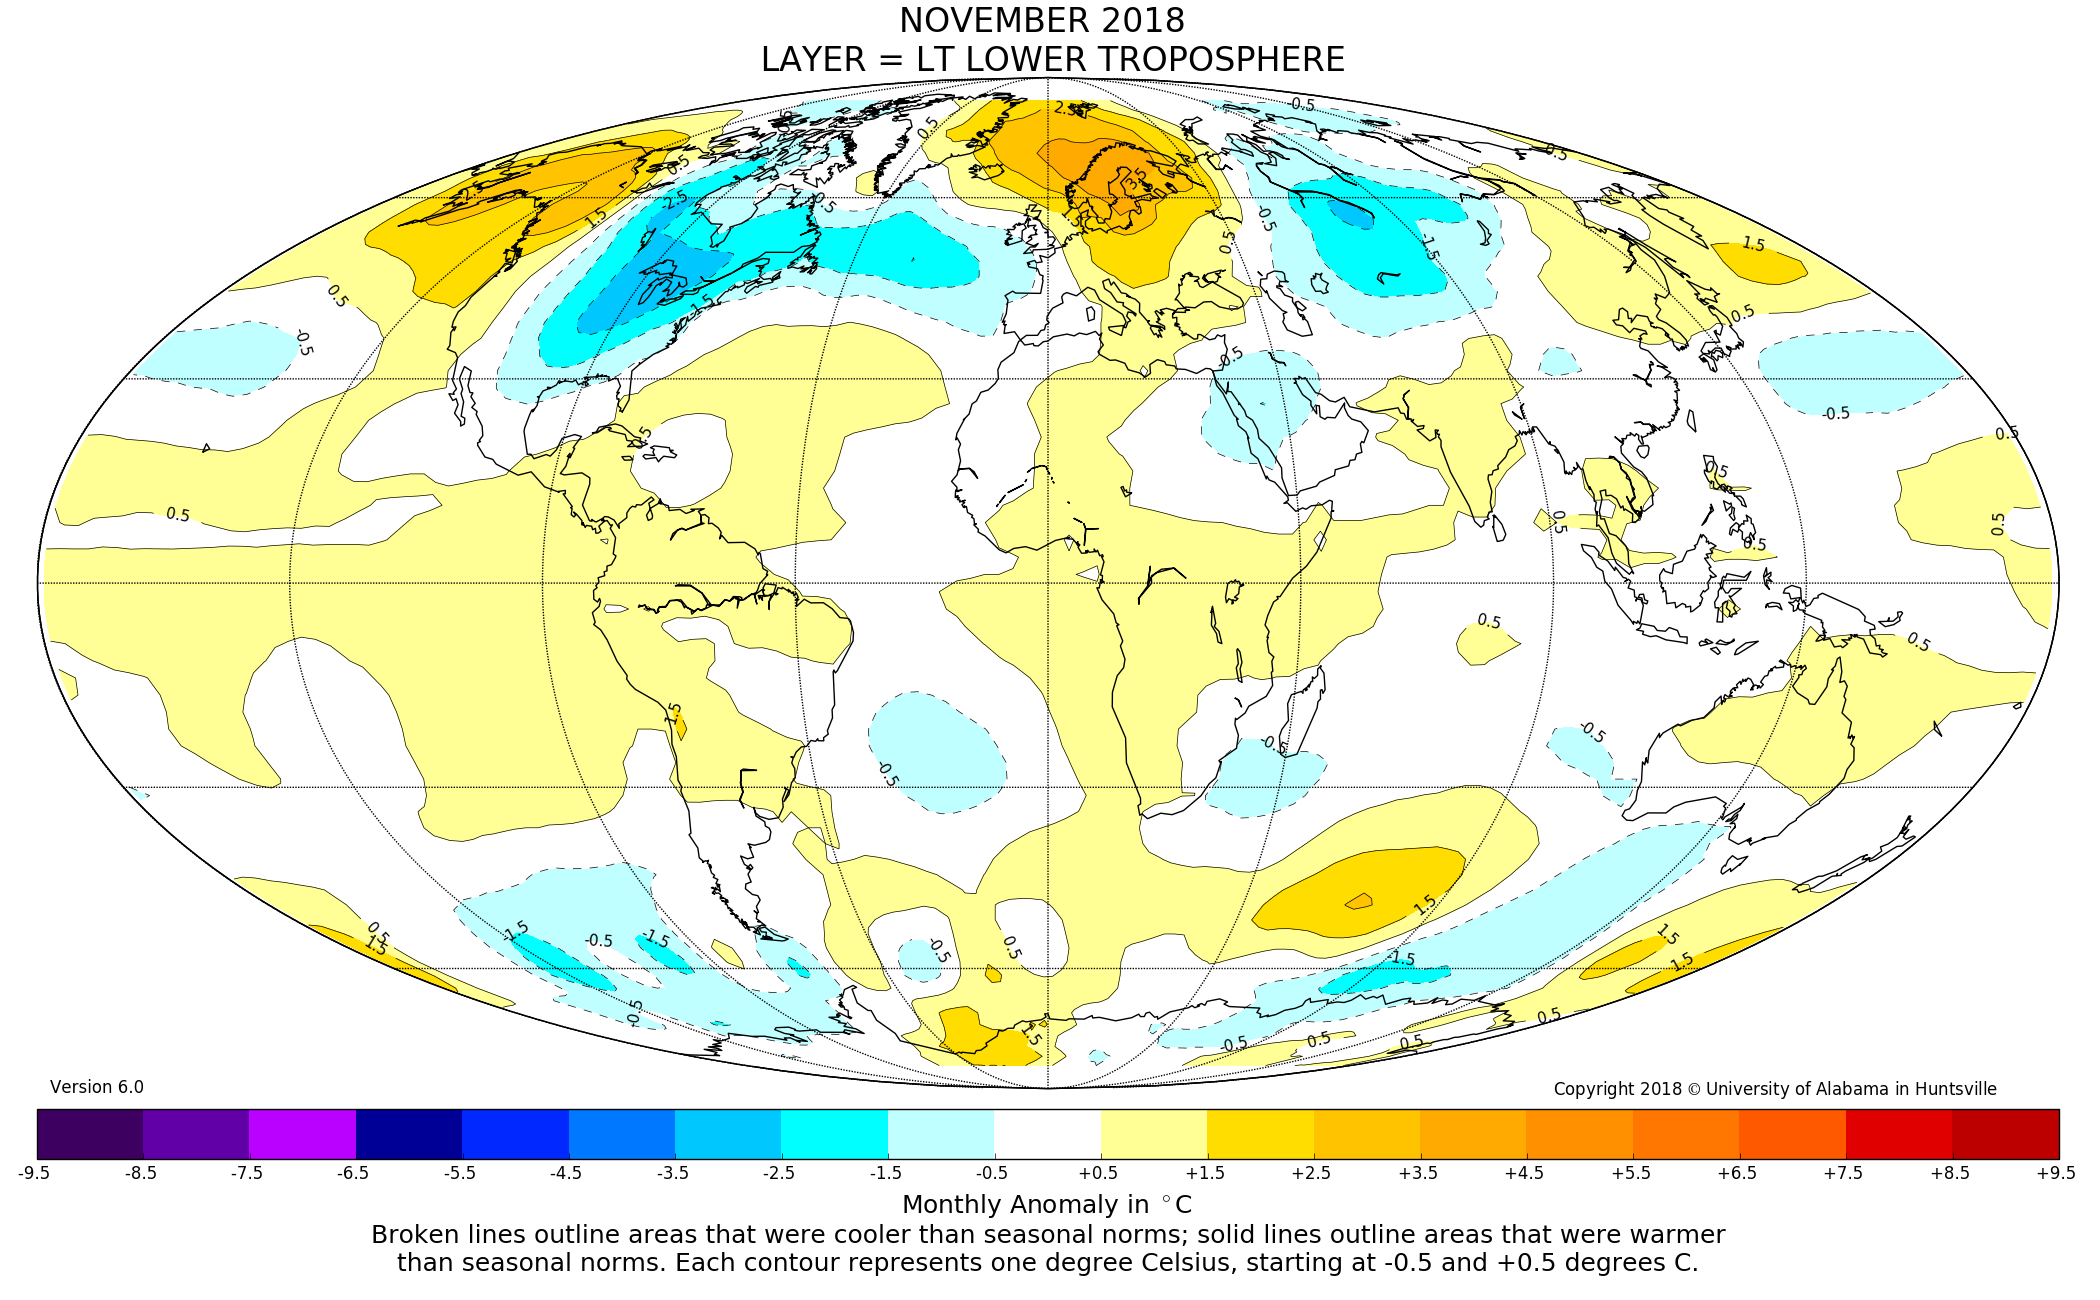
“And the second surprise is that the southern hemisphere is warming … but the northern hemisphere, with a trend of 0.00°C/decade, is neither warming nor cooling …”.
=============================
The HADCRUT4 series has the hemispheres showing the opposite and that the divergence is mostly post-2000:
http://woodfortrees.org/plot/hadcrut4nh/from:1910/mean:12/plot/hadcrut4nh/from:2000/trend/plot/hadcrut4sh/from:1910/mean:12/offset:0.1/plot/hadcrut4sh/from:2000/trend/offset:0.2
This apparent oddity has been mentioned before here, I don’t know if there has been any plausible explanation.
The explanation is sea ice loss in the NH. That leads to a million+ km^2 of water at 0 C vs. something like -20 C in the winter if it was still ice. It probably also happened in the early 20th century but we didn’t have any way to measure it.
The heat that is released from the ocean also spreads out over a wide area. You can really see it if you just look at the SSTs. You can see it is seasonal which is the real indicator.
http://www.woodfortrees.org/plot/hadsst3nh/from:1980/to/plot/hadsst3sh/from:1980/to/plot/hadsst3sh/from:1997.5/to:2015/trend
Least squares trends do not have p-values. Time series do no t have p-values. P-values are assigned to sample populations involving bell curve distributions, looking at the tails of the curves. Showing a time series and p-value is confusing two different groups of statistics. You create a least square line and get its correlation coefficient.
If CERES measures surface temperature which would be the top 1mm of the ocean, and the ocean is up to 2km deep, how do you conclude this means the ocean is warming? You have to use ARGO to conclude that.
If these “scientists” can tell us what the temperature is going to be in 20 years how come they can’t tell us what it will be next week?
Will, Thanks for the graphics from the CERES satellite data..Interesting that it show Australia is warming..As a farmer since n 1985, that tallies with my own experience. In South Australia grape harvests have come forward significantly….
Re. weather predictions, what about all of the climate scientists who are saying what will happen in 100 years time, instead tell us what will happen in say 2 weeks time . It should be a very easy exercise for these climate scientists and it would restore our confidence in their predictions about the future e.
MJ E
Not surprising. Why, the clever alarmist mob saw it coming and invented ‘climate change ‘ didn’t they?
SW at the surface peaked in about 2003, so perhaps the thermal lag of the oceans is keeping them up while the land cools.
Totally expected with the ‘sun drives climate’ model.
Very interesting work Willis. I had noted some time ago (2012) that many of the Australian inland weather stations with longer temperature records actually have a cooling trend, which was opposite to (warming trend) stations on the coast. https://eyesonbrowne.wordpress.com/2012/10/27/is-it-getting-warmer-in-australia-well-that-depends-on-where-you-live/
As far as I know, CERES doesn’t measure/retrieve surface temperature. I suspect you grabbed one of the datasets that includes the GMAO GEOS model reanalysis data as an auxiliary dataset included for users’ convenience.
In North America it will be even colder due to the weakening geomagnetic field.
http://www.esa.int/var/esa/storage/images/esa_multimedia/images/2014/06/magnetic_field_changes/14582173-1-eng-GB/Magnetic_field_changes_node_full_image_2.jpg
Where is it colder and where is it warmer?
Your snow cover confirm my results.
Namely. It is cooling at the higher altitudes. Especially in winter.
Willis,
https://www.nsstc.uah.edu/data/msu/v6.0/tlt/uahncdc_lt_6.0.txt
According to the link below, which is to UAH TLT v6, by my calculations the lower 48 states (USA48) warmed at a rate of +0.23 C per decade between March 2000 and February 2018; even faster if you include Alaska (USA49, +0.25 C per decade). That’s a total warming of +0.45C over that period.
Your fig. 3 suggests there was -0.4 C per decade or more ‘cooling’ in the US inc. Alaska over this period. That’s a total cooling of at least -0.72C. UAH says +0.45C warming; your interpretation of the CERES data says -0.72C cooling. A disagreement of ~1.2C, with the respective trends moving in opposite directions. What do you make of this large divergence?
Link: https://www.nsstc.uah.edu/data/msu/v6.0/tlt/uahncdc_lt_6.0.txt
DWR 54 (what does the 54 stand for?)
I made a special study of the Elmendorf weather station in Anchorage.
Since 2000, it currently shows average cooling of
-0.02K / annum (maxima)
-0.01K / annum (mean) = -0.2K
-0.04K / annum (minima)
No reason to doubt you Henry. I’m just highlighting the difference between UAH TLT and Willis’s interpretation of the CERES data.
DWR54 was just my code-word for an online course I did once. DWR are my initials (David W Rice). I must have been the 54th person to enroll that year!
Thx. I figured the DWR were your initials. I was just curious to figure out the 54…
Not your age, then,,,,
Interesting discussion here now.
“Interesting … the trend is quite small, and is not statistically different from zero”
It would help if you drew a trend line on the graph. I’m guessing that temperatures are still well above the trend.
Willis, the maps in this post surprised me and I took a look at the maps from a previous post: https://wattsupwiththat.com/2018/03/24/where-the-warmth-is/
Comparing the maps from this post (figure 2 and 3) with the maps from figure 2 in Where The Warmth Is, the numbers I see for both of the Hemispheres, for Land / Ocean and for both of the Poles are very different.
There is a difference in the period you used for the data (one year more for this post) but that can’t explain all of the difference.
David
What,
exactly is it that melts snow?
Click on my name to read my final report.
Willis,
I don’t know how Ceres handles seasonality, but on its face Feb is cooler than March every year in the northern hemisphere, and the opposite in the southern.
Any chance of reposting with both starting and ending months being the same? Also responding to Dr Roy Spencer’s comment would be great.
I didn’t realize Willis was computing temperature from the estimated upwelling LW flux at the surface. I don’t know how good of a proxy for temperature that would be (depends upon how good the LW flux estimate is, corrections for clouds are always a major issue in LW estimates of surface temperature.
Well, that although in the Arctic is warmer.

http://polarportal.dk/fileadmin/polarportal/sea/CICE_curve_thick_LA_EN_20181205.png
Willis and others,
I’m trying to understand the warming and cooling of the land-ocean-atmosphere system. The land and surface of the water warm by solar radiation and cool by both infrared radiation plus conduction and convection. The surface of the land warms and cools quickly over diurnal and annual periods. Because of the much greater heat capacity of water, and because of some mixing near the surface, the surface water warms and heats more slowly than the land. Because of the differing densities of warmer and cooler water, there is much less mixing below the wind blown ocean surface and much slower warming and cooling there. This brings me to my question. I know the exchange of heat between the ocean and land areas is very complex, but with more solar radiation warming the earth’s surface for any reason (GHG, cloud cover, change in irradiation), wouldn’t the land warm more quickly than the seas and, then, with nature’s attempt at equilibrium, the seas continue to warm even if that increase in solar radiation reaching the earth’s surface stopped or reversed. Is that what is happening? Is that a partial explanation for the results Willis graphed?
Douglas
Taking the results at face value
https://wattsupwiththat.com/2018/12/05/cooling-down-the-land/#comment-2546508
In this case, some questions do arise from the results.
It is complicated, but I do have an answer for you:
The drop in maxima has to do with the amount of ozone/peroxides/N-oxides being produced by the most energetic particles coming from the sun. The atmosphere is protecting us to from this harmful radiation – hence do not go to Mars until you have formed an earthlike atmosphere- but in turn these chemicals are stunting certain types of UV radiation coming to earth.
That [in this case] the drop in minima is greater than the drop in maxima can IMHO only be explained by some type of contraction of the atmosphere, especially at the higher latitudes.
Excellent article and global map, Willis!
Offhand, most of the places warming are exactly the places where slight increases in water vapor make a difference in temperature. i.e. validating Joe Bastardi’s hypothesis, that El Nino’s pulse large amounts of water vapor into the atmosphere.
Atacama desert, Australia, South Africa, both polar regions; all arid regions.
That land areas are cooling affects precipitation and if cooling continues, permanent snow cover.
Keep digging into the data!
Interesting!
“on average, the oceans are warming”
I think you mean they warmed–the satellite does not do predictions.
And how much of the warming is caused by latent heat from a PDO cycle? and compared to past PDO cycles?
Earth has been cooling since Feb 2016 peak of El Nino.
How low can it go? Back to 2012 or 2008?
Thank you for the essay. I especially appreciated the presentation of the global distribution.
I think it is too soon to rule out a step increase as followed the 1998-1999 El Nino, but evaluating that will require waiting at least 5 more years.
Again
looking at the comments
I must say that there is no AGW
[click on my name to read my final report on that]
but I must warn that natural climate change is just as scary….
The dust bowl drought {1932-1939] was one of the worst disasters in US history. Just google it…
And it is here again. It comes every 87 years. The drought starting 1845 is now regarded as being the disaster that wiped out most of the bison population.
[contrary to popular thought it was not man that caused the decimation of the bison population]
Henry,
Why weren’t the bison wiped out in AD 1760, 1673, 1586 or at any other of 100 points in the preceding 8700 years?
John Tillman
I stumbled on clear evidence of the 87 year Gleissberg cycle when I carefully analysed all daily data [maxima] from the Elmendorf weather station in Anchorage. I subsequently also found similar results when observing minima. There are many current and historic papers confirming this 87 year cycle. If you want to see some of those papers, just ask/
NOTE:
https://www.researchgate.net/publication/286971648_Drought_in_the_western_Great_Plains_1845-56_Impacts_and_implications
Just doing some basic counting:
1932-87=1845 hence when I googled ‘1845’ and ‘drought’ I got something similar to the paper quoted above…the connection with the decimation of the bison population does not seem to be an isolated investigation?
Looking at the speed of cooling, we already were in the dip [of the sine wave] but are slowly climbing up now.
1932+ 87= 2019. Droughts coming up for the great plains of America- just about now. It is happening already?
As to your specific question
1) what historic observations existed in 1760? Did USA even exist? Could people even write in the USA at that time?
2) what was the bison population at that time?
So, nobody can answer that question – but in fact the question is also wrong. We don’t know anything about the bison population before the drought of 1845?
I think here [in South Africa] we already had the major drought time caused by the GB cycle but I must say: 40 years ago when there was a drought, people around you and on radio and TV asked you to pray for rain. I remember that I was surprised about that. Coming from Europe, praying for rain was something that was never done…. Nowadays, when there is drought all people here on radio are saying: : there is drought due to climate change and now it is YOUR fault!!!@
Click on my name to figure out exactly whose fault the drought will be??
BW
H.
Thanks, Henry. What was your source for the Elmendorf daily temperature data? Also, Elmendorf was only established in 1942, which is only 77 years ago. Diagnosing an 87-year cycle in 77 years of data? I doubt that greatly.
Also, you say:
What I’d like to see are two links: one link to whatever you consider to be the best and strongest of those “many current and historic papers”, and the other link to the data used in that paper. If you’ll post those I’ll be glad to analyze the paper. However, in order to analyze the paper, I have to have access to the data, which is why I need two links.
Please don’t bother sending all of your links. I just want two links, to the best paper and to the data underlying that paper.
I append a couple of my papers on the putative Gleissberg cycle.
Many thanks,
w.
The Tip of the Gleissberg 2014-05-17
A look at Gleissberg’s famous solar cycle reveals that it is constructed from some dubious signal analysis methods. This purported 80-year “Gleissberg cycle” in the sunspot numbers has excited much interest since Gleissberg’s original work. However, the claimed length of the cycle has varied widely.
The Effect of Gleissberg’s “Secular Smoothing” 2014-05-19
ABSTRACT: Slow Fourier Transform (SFT) periodograms reveal the strength of the cycles in the full sunspot dataset (n=314), in the sunspot cycle maxima data alone (n=28), and the sunspot cycle maxima after they have been “secularly smoothed” using the method of Gleissberg (n = 24). In all three datasets, there…
http://oi60.tinypic.com/2d7ja79.jpg
my data source is always http://www.tutiempo.net (historica)
but if you already know that I looked at the data from 1942 then you might be aware of the original source.
Remember my method: daily data is computed to give me yearly data which is summarized over periods (usually decades) by doing various backward regressions, giving me the derivatives of the least square equations, giving me the speed of warming/cooling in K/annum.
Click on my name to read my final report as I do explain there the way I work.
True enough, in the case of Elmendorf I did not have the whole cycle. At the time when I did this investigation, 2013, I found this report:
http://iie.fing.edu.uy/simsee/biblioteca/CICLO_SOLAR_PeristykhDamon03-Gleissbergin14C.pdf
Consequently
I estimated the wavelength as being 88 years. Subsequent investigations, e.g. here:
http://www.nonlin-processes-geophys.net/17/585/2010/npg-17-585-2010.html
and also the measurements (going back to 1971) of the north south magnetic field strengths on the sun, lead me to believe that currently the cycle is 86.5 years. From 1971-2014 you can see exactly one half the GB cycle, namely, instead of drawing straight lines,
http://oi63.tinypic.com/2ef6xvo.jpg
you can imagine drawing bi-nomials from the top to the bottom to the top that represent the average field strengths with the dead end stops both in 1971 and 2014
Assuming that maxima is a good proxy for incoming energy, that means that the sine wave of incoming energy was at its lowest point in 2014 and not in 2016 as I originally thought it was in 2013.
Interesting is that Leif Svalgaard now also seems to support an 87 year cycle.
More investigations/papers can be found in tables II and III, here,
http://virtualacademia.com/pdf/cli267_293.pdf
Figures 2 and 3 depend heavily on red-green color distinction. 8% of males are red-green color blind. Why doesn’t NASA adjust for this? My brother has been jokingly advocating for the rights of color-disabled people. I figure they have at least as much justification to feel mistreated as trans people have.
Willis – Thank you for the data analysis.
In the most basic way to say this, the energy of the transporting waves has increased, so the land under the storm tracks has cooled slightly over a ten year average. Cold air gets pushed more often than warm air.
What’s remarkable is that global plots of nominally insignificant trends in TOA LW emissions are used here as basis for physical inference about surface temperatures never really measured by CERES. The S-B equation cannot be used legitimately to relate radiative intensities to temperatures of a body that evaporates. The shown results over the oceans thus are highly suspect.
Willis, your posts on the CERES data inspired me to look at it myself. Not that I’m going to be able to generate the interesting posts you’ve made on the subject but I ran across something that has me puzzled. I started by just looking at the Solar monthly TOA since that’s fairly straight forward. I plotted it as a surface where x and y are time and latitude. That was is interesting of itself but I was puzzled by what I saw at the solstices. I expected the TOA to be increasing til you reached the poles but there is a “notch” that starts about at about +/- 46 deg to about +/-66 deg before the TOA starts increasing again. I was wondering if you had any idea as to what would cause that? I posted the graphs here if you’d be so kind as to look at it.
Thanks, Bear. I was able to duplicate your results. I’d never noticed that. What you see is the interplay of two things: the angle of the sun, and the amount of each latitude that receives sunlight during the day. These change at different rates, because the earth is a sphere. This leads to the curious result you’ve noticed.
Congratulations, you’re one of the few people who has actually taken up the torch and done your own analysis of the CERES data. Well done.
w.
Thank you. Your comment is appreciated. That’s high praise indeed IMO. My looking at that was due to your comment about looking at the data graphically. You never know what might jump out when you look at things from different perspectives. I had the thought that it might be something like what you describe and I’m guessing that the increase above the arctic/antarctic circle is probably due to the 24 hours of daylight above that latitude. The dip just didn’t fit with my preconceptions.
You’re right, the increase about the Arctic/Antarctic circles are the cause of the curious outcome.
w.
Bear:
The earth’s polar angle (now 23.45 degrees) from its orbit (the ecliptic plane, as some term it) is not related to the eearth’s distasnce from the sun (the eccentricty of its eliptical orbit). Yes, they are “close” together right in the whole M. cycle, but that’s only coincidence. Or Inteligent Design – Take your pick.)
The 23.45 degree tilt puts maximum solar exposure each day, with the sun highest in the sky each hour of the day, in the northern hemisphere June 22 each year, DOY = 173.
The same tilt puts the maximum solar exposure of the southern hemisphere on 22 December each year, DOY = 356. These “hours per day of solar exposure” and “solar elevation angles at each hour” would be the same regardless of how far the earth is away from the sun.
However …
TOA (Radiation received at the top of atmosphere, at the earth’s distance from the sun on each day of year (DOY)) reaches its maximum of 1408 watts/m^2 on 5 January each year. DOY = 5.
TOA reaches its minimum of 1316 on 5 July, DOY = 186.
Notice the December solstice averages 22 Dec, 14 days earlier than solar maximum. The June solstice is comparably earlier than the July minimum: 13 days difference.
Both TOA radiation and solar angle are “slow” changes, with each day’s TOA radiation only slightly different than the previous day’s value. Each day’s solar exposure (highest for the southern hemisphere, lowest for the northern hemisphere is also changing, but also changing slowly each day.
At the two equinoxes, the TOA radiation is changing rapidly, the length of day is changing most rapidly. You will marked changes even day-to-day of absorbed solar energy!
The effect you both see is I so strongly reject using “averages” for solar energy absorbed in either the Arctic or Antarctic: Each day the earth is struck by a varying amount of solar energy, each day the edge of the sea ice is at a different latitude, each day the sun’s exposure at each hour is at a different solar elevation angle. Every hour of every day of the year the solar energy that does reach the earth’s top of atmosphere passes through a different air mass, is striking the sea ice or water surface with a different albedo and radiating LW at a different surface temperature to a different air temperature through a different relative humidity zone.
I’m (partially) incorrect above: The change Bear highlighted was not day-by-changes by changes over latitude on certain days. Which also occurs as air mass, albedo, and absorption changes with time and solar elevation angles.
Dangalang, I’ve discovered an error that invalidates this post. See the discussion in my new post here …
w.
Willis, greeting from chilly Maine! 10% of the worlds fresh water mass can’t me wrong…. check out Mean Lake Superior Whole Volume Temp . It is pretty satisfying short term weather buffered TEMPERATURE PROXY data. Does not compute with the warming analysis so I prefer the huge heat sink to something else that doesn’t track with the heat sink. https://www.glerl.noaa.gov/res/glcfs/compare_years/
What’s your source for the two maps?
“After the recent fires we’ve been cleaning up the forest floor, so yesterday we burned a couple of the big piles of limbs and brush that we’ve gathered over the last couple of months.”
Stress. Wish you well.
___________________________________________________
Interesting question, interesting graphs.
One thing is certain, that the average temperature in the US in December will be below average, as in November.
https://www.longpaddock.qld.gov.au/soi/
Yes,
at the higher lats it will become drier, leading to cooler winters and warmer summers.