Guest DIY by David Middleton
It looks like at least some of this money was well-spent.
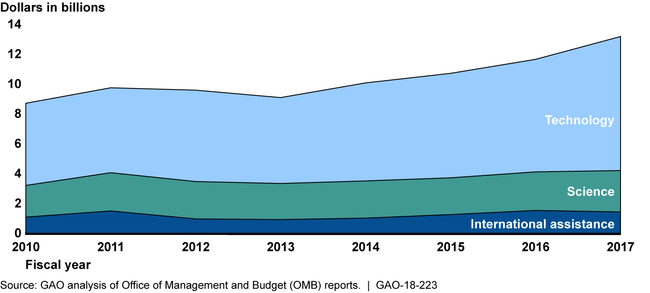
I stumbled across something very useful yesterday on Climate-Dot-Gov’s U.S. Climate Resilience Tool Kit page.

The widget generates CMIP5 or PMIP3 model outputs for specific countries and a temperature change map of the world. You can also spit out plots of each model. And these outputs display the actual temperature ranges rather than anomalies.
Since Greenland is such a great climatic playground, I started playing around with it.
Greenland Stays Frozen in an RCP8.5 Bad Science Fiction Nightmare
The first thing I did was to hit Greenland with RCP8.5.

While the histogram indicates a 5.1 °C rise in the average annual surface temperature. It’s thought that the Sangamonian (Eeemian) interglacial was at least 5 °C warmer than today. However, most of that 5.1 °C rise appears to be in winter and the average July temperature is projected to still be below freezing, only 2-3 °C warmer than the 1980-2004 mean.
Since we know that RCP8.5 is just bad science fiction and that global temperatures are behaving more like RCP2.6 to RCP4.5…

Let’s look at RCP4.5 and RCP2.6…


Again, note that most of the warming is in winter. Greenland’s average July temperature barely changes. The Greenland ice sheet will barely notice this.
“And Now For Something Completely Different”
Andy May’s brilliant analysis of NCA4 featured this image:

Andy noted the following:
INM-CN4 is labeled and it, alone, is tracking the observations with enough accuracy, yet it does not predict dangerous temperatures in the future or any significant human influence on climate.
This drew some standard ad hominem and/or unsupported dismissals of Dr. Christy’s work and derision of INM-CM4. So I downloaded UAH 6.0 and HadCRUT4 and plotted 5-yr running means at the same scale as Dr. Christy’s 2016 plot.

UAH 6.0 generally plots within 0.1 °C of the average of 3 satellite datasets, closest to INM-CM4. HadCRUT4 plots well-below the model-mean closest to the only model that runs hotter than INM-CM4. Note that there’s not a lot of difference between HadCRUT4 and UAH 6.0. (0.1-0.2 °C is not a lot of difference).
Here are the RCP8.5 and RCP 4.5 outputs for INM-CM4 in Greenland:


Both models indicate that Greenland won’t be significantly warmer in 2100 than it was in 1850. Almost all of the warming comes from an increase in the minimum temperatures.
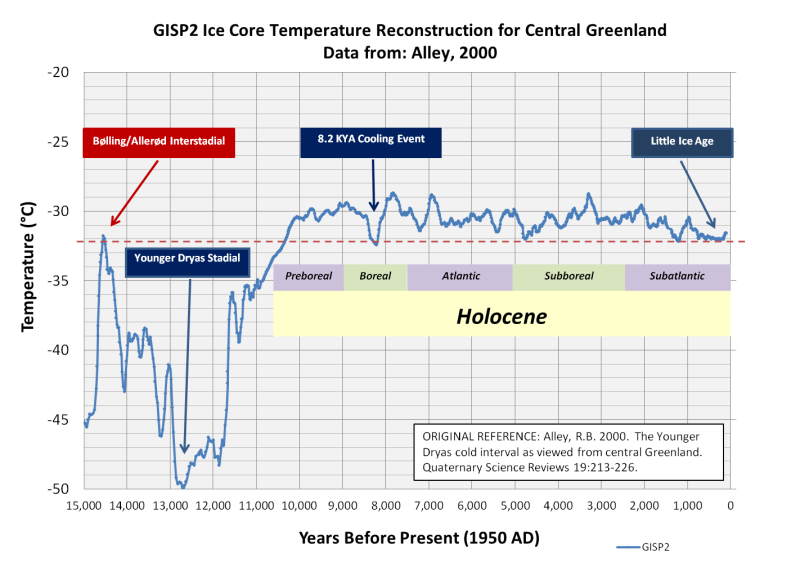
1850 was very cold by Holocene standards.
References
Alder, J.R., Hostetler, S.W., Williams, D., 2013. An Interactive Web Application for Visualizing Climate Data. Eos Trans. AGU 94, 197–198. DOI: 10.1002/2013EO220001.
Alder, J.R. and Hostetler, S.W., 2013. CMIP5 Global Climate Change Viewer. US Geological Survey http://regclim.coas.oregonstate.edu/gccv/index.html doi:10.5066/F72J68W0
Alley, Richard, B. (2000). The Younger Dryas cold interval as viewed from central Greenland. Quaternary Science Reviews. 19. 213-226. 10.1016/S0277-3791(99)00062-1.
How very disappointing for the green blob. We are apparently not all gonna die?
Don’t worry, I’m sure it’s worse than we thought…..
David, I’m curious about the Russian model….and I’m almost certain from what little I’ve been able to find….that it worked because they put in a lot less parameters…and lower CO2 forcing
….have you looked to into it? know anything about it?
thanks
I haven’t… yet.
“I haven’t… nyet.” ?
There ya go…More proof that David is “colluding” with the Russians..!
What ? …That’s not what David said ?
So who cares, it’s good enough for the MSM…and all liberal/socialist/democrat…etc….
( Do I really need a “sarc” tag ?)
It’s safe to assume that when you aren’t checking my spelling, you’re being sarcastic… 🍻
I don’t know but I thought my Russian “nyet” joke was kinda funny now that the RCMP has released me on good behavior…..
I’ve tried to find it. It is apparently in the Harvard library, but haven’t pursued trying to get a copy.
I found this…..seems to be it
Climate Model Upgraded: INMCM5 Under the Hood
Posted on October 2, 2017
A previous analysis Temperatures According to Climate Models showed that only one of 42 CMIP5 models was close to hindcasting past temperature fluctuations. That model was INMCM4, which also projected an unalarming 1.4C warming to the end of the century, in contrast to the other models programmed for future warming five times the past.
https://rclutz.wordpress.com/2017/10/02/climate-model-upgraded-inmcm5-under-the-hood/
https://www.researchgate.net/publication/312472371_Simulation_of_the_present-day_climate_with_the_climate_model_INMCM5
http://www.glisaclimate.org/node/2220
https://rclutz.wordpress.com/2017/10/02/climate-model-upgraded-inmcm5-under-the-hood/
https://andymaypetrophysicist.com/facts-and-theories/
I’ve got some reading to do……
Still makes me wonder….INMCM4 was spot on…..why did they change it?
The INM-CM5 paper can be downloaded from ResearchGate.
thanks….I think they beat it into submission
The published PDF of the new and improved INMCM5 was dated February 2017.
John Christy’s graphic is 2 years prior, now 3 years.
Just for information — I’m fine with this.
Thanks for the post.
Latitude, not David but I researched this when writing Blowing Smoke. In a laymans nutshell, the ‘accurate’ Russian model has more ocean thermal inertia and lower water vapor feedback. The former is consistent with ARGO observations and what is known about deep thermohaline circulation, the latter is consistent with humidity sensor bias corrected radiosonde readings in the mid to upper troposphere (not a lot of humidity up where its real cold so there is a correctable by sensor model dry bias). Wrote up the latter with footnotes to relevant papers in essay ‘Humidity is still all Wet’ in ebook Blowing Smoke. Wrote up the humidity sensor bias and correction methods and did a deeper dive into erroneous AR4 model humidity assumptions in the long climate chapter of The Arts of Truth.
The fact that the best performing model (INM-CM4) vis-a-vis observations is ignored and homogenized with all of the other wild-ass models tells you all you need to know about climate science.
Looks like 97% of the models have got it wrong.
To me the kink in Andy May’s graph at around 1993/4 seems to indicate that there must have been some general change in the algorithms/methodology used in all the models with the exception of IMO- CM4 ; for suddenly they all seem to start running hot. Perhaps they were worried by the preceding 5 year temperature drop and needed to boost the agenda a bit. A touch of Groupthink ? After all they all look over their shoulders at the competition comparisons.
There is a 97% consensus among the models that thermometers run cold… 😎
+100
This is an, as yet, unexplained direct effect of magical CO2 on mercury, thermocouples, thermistors and other temperature transducers. It could be worth a grant application!
I just completed an online, real time Face-book survey of millenniums (under 30) who think “climate change” is a severe problem that must be solved NOW ! When asked why they held that belief (religion), 97% replied that their teacher told them, so it must be true !.. The other 3% believed that Unicorn farts will empower their generation ! As of 10 minutes ago, I was bocked by Face-book?
I still think it’s the best example of adjusting past temperatures down…was f r a u d
The Real Estate Boom in Greenland is postponed again.
Ross McKitrick created the following website of temps in cities throughout Canada with actual temps. The upward slopes in the graphs on this page appear to reflect many of Canada’s largest cities….when you get to other smaller cities? Not so much.
https://www.yourenvironment.ca/
It annoys me no end that people discus Greenland and Antarctica melting. They may be gaining or losing ice, but temperature has nothing to do with it.
Temperature has *something* to do with it, particularly in Greenland.
While it may be impossible to melt the interiors of the ice sheets, the margins of the Greenland ice sheet do experience melting and the top few mm of most of the ice sheet can experience melting during periods of abnormally warm temperatures.
During the Sangamonian (Eemian), the Greenland ice sheet experienced significant melting.
That said, most of the ice mas loss from Greenland and almost all of the ice mass loss in Antarctica is due to calving and sublimation.
Greenland mostly melts from underneath because of a volcanic ridge as was explained in a post last year on WUWT. In the early 1900’s Greenland’s ice sheets were less than today.
https://www.researchgate.net/publication/234243626_Was_there_a_1930's_Meltdown_of_Greenland_Glaciers
“Although retreat was scarce post-ETCW (1955-1970), retreat was more common
than not prior to 1920 in spite of relatively low temperatures.”
Over the years since WW2 allied bombers were found under 91 meters of ice.
https://www.livescience.com/63423-lost-squadron-unearthed-greenland-glacier.html
So if global warming was causing Greenland to melt from the top, how could 91 meters of ice form on top of those planes? That means every year Greenland is adding snow/ice from the top not losing it. So whatever the temperatures are at top, and they are always cold, except in a very few days in the summer., then ice is not being lost from the top. Calving of ice goes on from the glaciers descending to the seas but that process has been going on for millions of years. 8000 years ago when temperatures were 5C warmer in Greenland it took 3000 years to melt 20% of Greenland’s ice. Greenland ice melting is another BIG LIE of climate science.
There are places where the Greenland ice sheet melts from the bottom due to geothermal heat flow and places where it doesn’t. A few mm of periodic surface melt isn’t going to prevent Greenland from accumulating ice. The volume of Holocene ice appears to be as large or larger than the volume of Pleistocene ice. In much of Central Greenland about 12,000 years worth of Holocene ice is thicker than over 100,000 years of Pleistocene ice. This is due to the fact that glacial stages (AKA ice ages) are very cold and very dry. The snow accumulation rate during the Holocene has been much higher than that of the last Pleistocene glacial stage.
Vinther et al., 2009 reconstructed the elevations of four ice core sites over the Holocene. There has been very little change in elevation of the two interior ice core sites (NGRIP and GRIP), while the two outboard sites (Camp Century and DYE3) have lost 546 and 342 m of ice respectively.
https://www.airspacemag.com/history-of-flight/glacier-girl-the-back-story-19218360/?fb_locale=pl_PL&page=1
The Glacier Girl crash site is in an area where there’s a little bit of summer melting on occasion. Tasiilaq, which is not too far away, gets about 1 meter of precipitation per year, with most of it coming in winter as snow. A little bit of melting and a lot of snowfall can bury a P-38 under a lot of ice fairly quickly.
While ice accumulates and moves around in the interior, some of it melts around the margins. 2012 was the most intense melt season on record (since 1979)…
http://nsidc.org/greenland-today/2013/02/greenland-melting-2012-in-review/
Just a curious question, ….. doesn’t a glacier have to be gaining ice mass in order to be losing ice mass due to calving?
Kind of like the ice maker in your refrigerator overflowing.
There can be a net loss, but iceberg calving is definitely indicative of upstream ice mass gain.
😊 😊 😊
“In much of Central Greenland about 12,000 years worth of Holocene ice is thicker than over 100,000 years of Pleistocene ice. This is due to the fact that glacial stages (AKA ice ages) are very cold and very dry.”
Wrong. This is mostly due to the way ice flows in an icesheet, which compacts and “squeezes out” the deeper layers. It is not unusual to have half the total age of an ice core in the lowest few percent of the core. If you check the antarctic cores, which span several glacial cycles you will find that while accumulation is larger during interglacials the older ones are proportionally as compressed as the neighboring glacials
No, not in the short run. Glaciers are driven by gravity, not temperature, and will keep on calving for a long time even if losing mass. Of course the calving front will in such cases retreat until it reaches the shore and much slower peripheral melting takes over. This will slow down glacier movement and make the glacier considerably steeper.
This is why the ice in north-central Greenland was actually slightly thicker during the Eeemian when the ice-front had mostly retreated onto dry land.
David Middleton November 30, 2018 at 8:55 am…
That said, most of the ice mas loss from Greenland and almost all of the ice mass loss in Antarctica is due to calving and sublimation.
News media would have us believe something else. Here’s the first page results from a Google News Search on “Greenland melting”:
The bittersweet beauty of Greenland’s melting glaciers
Mother Nature Network (blog)-Nov 16, 2018
Exploring the Tragic Beauty of Greenland’s Melting Ice Sheets
Atlas Obscura-Nov 5, 2018
Greenland’s Melting Ice Sheets: The Beautiful but Harrowing Changes …
The Weather Channel-Nov 6, 2018
Interview: Melting Greenland Ice Sheet Captured in Ominous Aerial …
My Modern Met-Nov 2, 2018
Where the ocean is ‘upside down’ is essential for showing us how fast …
The San Luis Obispo Tribune-Nov 17, 2018
During the summer months, copious amounts of freshwater melt from the glaciers of Greenland
Climate change is more extensive and worse than once thought
Phys.Org-Nov 29, 2018
They missed how much ice sheets in West Antarctica and Greenland would melt
Story image for greenland melting from Phys.Org
Phys.Org
Melting Antarctic ice could slow global temperature rise, study says
Carbon Brief-Nov 20, 2018
While prior studies have added ice-sheet melt from Greenland
Rutgers researcher: Greenland’s glaciers are melting faster than …
News 12 New Jersey-Nov 9, 2018
A little bit of melting goes a long way in headlines… particularly when all ablation is referred to as melting.
Well in a way they are right. All that ice ultimatele does melt somewhere, though not on Greenland or Antarctica.
“We measure changes in temperature and CO2 over time.
(Then) we put that data in dozens of different climate models and ignore the ones that look wrong to us.”
Dilbert (Scott Adams).
Well, that’s OK.
I think.
Isn’t it????
Ignoring the ones that ‘look wrong’.
That is – of course – blatant look-ism.
Utterly unacceptable.
Equivalent to – well, I guess – all the other isms we are so troubled by and all seriously seek to overturn.
Don’t we? Every minute of our waking hours?
Don’t we all??
Auto
David: what happens if you do the same thing for Antarctica?
The widget doesn’t have an Antarctica option.
generates CMIP5 or PMIP3 model outputs
For some reason whenever I see that, I see CHIMP or PIMP model outputs……
what you see is rather fitting, all things considered.
PIMP is way cool. It’s the paleo version… 😎
Not to nitpick, but you are plotting mid-tropospheric and surface temperature together, and they are not the same thing, as you would notice if you were in the mid-troposphere now.
The thing is that mid-troposphere and surface temperature are supposed to behave slightly differently in response to increased GHGs.
That Greenland doesn’t significantly melt even if global warming continues for many centuries is a well established fact. It would take several thousands of years of global warming to make a significant dent in that ice block. East Antarctica isn’t even warming. Sorry, the Ice Age is here to stay. We ain’t running out of ice rocks for our whiskeys. The Anthropocene is a joke, at least from a climate perspective.
Being rhat it’s Friday, that’s a YUGE relief… 🥃
David Middleton
Who needs Friday for a nice malt? 🙂
Not according to SETH BORENSTEIN and the AP
AP FACT CHECK: 11 Trump climate goofs and 1 correct claim
https://www.foxnews.com/us/ap-fact-check-11-trump-climate-goofs-and-1-correct-claim
Inland Greenland/Antarctica is in the middle troposphere.
David
Could you explain how you derived your chart for the GISP2 Ice Core Temperature Reconstruction?
I have the Alley (2000) paper but the relevant data doesn’t seem to be in the paper.
The data are available from NOAA’s paleoclimatology library.
ftp://ftp.ncdc.noaa.gov/pub/data/paleo/icecore/greenland/summit/gisp2/isotopes/gisp2_temp_accum_alley2000.txt
Thanks David. Data downloaded.