Or at least some evidence…
Guest rebuttal by David Middleton
From the Hartford Courant:
Climate change was behind this summer’s extreme weather
By Michael E. Mann
November 3, 2018
Summer 2018 saw an unprecedented spate of extreme floods, droughts, heat waves and wildfires break out across North America, Europe and Asia. The scenes played out on our television screens and in our social media feeds. This is, as I stated at the time, the face of climate change. It’s not rocket science.
[…]
Climate scientists have become increasingly comfortable talking about these connections.
[…]
Our study shows that climate change is making that behavior more common, giving us the disastrous European heat wave of 2003 (during which more than 30,000 people perished)…
[…]
Manntastic Claim: 2003 European Heat Wave Killed 30,000 People Because: Climate Change!
The worst impacts of the 2003 heat waver were in France… Where we should find some Manntastic evidence.
If you’re going to exaggerate, go ahead and exaggerate! Wikipedia puts the death toll at 70,000, with nearly 15,000 in France!
The 2003 European heat wave led to the hottest summer on record in Europe since at least 1540.[1] France was hit especially hard. The heat wave led to health crises in several countries and combined with drought to create a crop shortfall in parts of Southern Europe. Peer-reviewed analysis places the European death toll at more than 70,000.[2]
[…]
In France, 14,802 heat-related deaths (mostly among the elderly) occurred during the heat wave, according to the French National Institute of Health.[4][5]
[…]
At the time, NASA put the death toll in France at about 3,000…
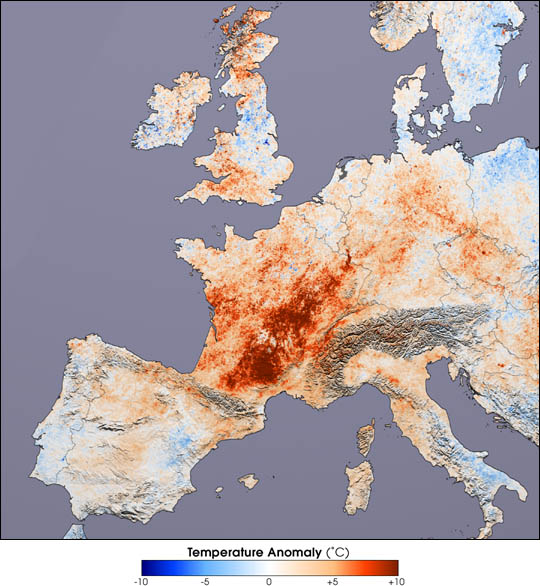
July 1 – 31, 2003
Europe was experiencing a historic heat wave that had been responsible for at least 3,000 deaths in France alone in the summer of 2003. Compared to July 2001, temperatures in July 2003 were sizzling. This image shows the differences in day time land surface temperatures collected in the two years by the Moderate Resolution Imaging Spectroradiometer (MODIS) on NASA’s Terra satellite. A blanket of deep red across southern and eastern France (left of image center) shows where temperatures were 10 degrees Celsius (18 degrees Fahrenheit) hotter in 2003 than in 2001. White areas show where temperatures were similar, and blue shows where temperatures were cooler in 2003 than 2001.
Even the Alps, which arc across southeastern France, Switzerland, Austria, and northern Italy (just below image center), were very warm. Glaciers were melting rapidly and swelling rivers and lakes to dangerously high levels. Climbers had to be evacuated from Switzerland’s famous Matterhorn after melting triggered the collapse of a rock face. The popular climbing destination was closed while geologists assessed the possibility of further collapses.
The heat wave stretched northward all the way to the United Kingdom, particularly southern England (bottom of island) and Scotland (top of island). In London, trains were shut down over fears that tracks would buckle in the heat, while in Scotland the high temperatures combined with falling water levels in rivers and streams threatened the spawning and survival of salmon. Throughout France, Spain, Portugal, and Italy, the intense heat and dry conditions sparked devastating forest fires that killed at least 15 people.
[…]
About 15,000 of the “more than 30,000” alleged heat-related deaths occurred in France. Apparently, climate change killed at least 12,000 more people than the heat wave.
You would think that might “leave a mark.”
I went to the WHO Mortality Database to look for that mark. I didn’t find it.

I did find a very interesting correlation:

Manntastic Claim: 2011 Texas Drought Devastating Because: Climate Change!
[T]he devastating 2011 Texas drought (during which ranchers ranchers in Oklahoma and Texas lost 24 percent and 17 percent of their cattle, respectively)…
I have lived in Texas since 1981. The 2011-2012 drought was really bad… Almost as bad as The Last Picture Show drought. I downloaded the historical Palmer Drought Severity Index (PDSI) for Texas from NOAA/NCDC. I also plotted the expected frequency of expected record events in a random time series…

While 2011-2012 was bad, it wasn’t as bad as 1957. Nor was it part of a decade-long mega-drought.
The record only goes back to 1895. Does anyone know how often record highs and record lows should be broken in such a short time series?
The probability, pn(1), that the nth observation of a series xm= x1, x2, … xn has a higher value than the previous observations [pn(1) = Pr(xn > xi |i < n)] can be expressed as:
pn(1)= 1/n (1)
provided the values in series are iid random variables.
The cumulative probability says that 5 records should have been set between 1895 and 2011. In reality, PDSI drought records were established or broken in:
- 1895, on schedule
- 1897, on schedule
- 1902, three years earlier than expected
- 1911, thirteen years earlier than expected
- 1918, fifty-four years earlier than expected
- 1957, seventy-four years earlier than expected
In a random time series, the 6th record-breaking drought could be expected in the 137th year of the time series, 2031. Since each year’s odds are independent, there’s no genuine expectation that nature will deliver on schedule. However Texas’ PDSI history is very consistent with a random time series.
Hubris Unchained
Just as climate models almost certainly underestimate the impact climate change has already had on such weather extremes, projections from these models also likely underestimate future increases in these types of events. Our study indicates that we can expect many more summers like 2018 — or worse.
Climate-change deniers love to point to scientific uncertainty as justification for inaction on climate. But uncertainty is a reason for even more concerted action. We already know that projections historically have been too optimistic about the rates of ice sheet collapse and sea-level rise. Now it appears they are also underestimating the odds of extreme weather as well. The consequences of doing nothing grow by the day. The time to act is now.
Michael E. Mann is distinguished professor of atmospheric science at Pennsylvania State University and director of the Penn State Earth System Science Center. He wrote this for The Washington Post, where it first appeared.
- An entirely baseless claim: “climate models almost certainly underestimate the impact climate change has already had on such weather extremes.”
- Is cited as the evidence for a baseless prediction: “projections from these models also likely underestimate future increases in these types of events.”
It just doesn’t get any more Manntastic than this! Oh wait… It does get more Manntastic…
Climate-change deniers love to point to scientific uncertainty as justification for inaction on climate. But uncertainty is a reason for even more concerted action.
Who denies climate change? At least he didn’t use the phrase “climate deniers.”
Mann is essentially invoking tht Precautionary Principle: “uncertainty is a reason for even more concerted action.”
When an activity raises threats of harm to human health or the environment, precautionary measures should be taken even if some cause and effect relationships are not fully established scientifically.
Wikipedia
Here in Texas, rather than destroying our economy just in case droughts get worse in the future, we build dams and expand water infrastructure.

Texas responded to the Manntastic Drought in much the same manner, by building more water infrastructure, including 26 new major surface reservoirs…
In the 2012 State Water Plan, 26 new major reservoirs are recommended to meet water needs in several regions (Figure 7.1). A major reservoir is defined as one having 5,000 or more acre-feet of conservation storage. These new reservoirs would produce 1.5 million acre-feet per year in 2060 if all are built, representing 16.7 percent of the total volume of all recommended strategies for 2060 combined (Figure 7.2). Not surprisingly, the majority of these projects would be located east of the Interstate Highway-35 corridor where rainfall and resulting runoff are more plentiful than in the western portion of the state.
Reference
Benestad, R. E. (2003). How often can we expect a record event? Climate Research , 25: 3-13
Mann-made warming peaked 15 years ago, it seems.
More than anything, Mann seems more like a fear monger.
Someone should ask Mann how the extreme rain and corresponding cloudiness here at Penn State, his home base of State College PA, the past 6 months fit his alarmist views. Haven’t seen much of the sun for a while now.
Hey, I agree with Dr. Mann when he says, “This is… climate change. It’s not rocket science.”
In rocket science:
(a) results can be replicated;
(b) failed predictions are widely reported;
(c) it does matter whether rockets are used upside-down.
+1
Climate change is not exactly brain surgery either.
In brain surgery, you need to know whether you are causing more deaths or saving lives. Now put that antibiotic away, it could cause some extreme weather!
And, you need to have at least one brain!
/grin
Old Joke:
Brain transplants have developed to the point that prices are being set for acquiring a brain. For example, an heart surgeon’s brain costs $200 a gram; a rocket scientist’s brain $400 a gram, while a climate scientist brain is rated at $2000 a gram. When asked about the last number, the researcher said, “You have no idea how many climate scientists it takes to get a gram.”
😎
There must be a way to work “Abby Normal” into that but I can’t think of it.
Another version of the joke – Climate scientists brains are brand new – never been used
Also the climate scientists brain is more expensive because it is as new, barely used.
With easy belief and modeling to prove a single cause dominates climate change using the “data and definition of success” approach for their grant funding, the workload of hard understanding is simply not required.
according to Wikipaedia:-
“The 2003 European heat wave led to the hottest summer on record in Europe since at least 1540″…..
errrr… doesn’t that imply some sort of very warm perid back then…. a natural, warm period. So why would a contemporary hot spell necessarily be man made?
Its not rocket science.
The date is very specific. Did they have thermometers in 1540?
KK… your comment leads into pointing out the dishonesty and/or ignorance of climate scientists and journalists whenever some extreme weather happens somewhere and they start chirping about climate change being responsible.
Pick a location and an extreme weather event that is “the worst in X years” or “the worst since YYYY”. Like Europe and the heat waves in 2003/1540; NYC and “Superstorm” Sandy (2012)/Hurricane Hazel (1954).
Now start with the recent event and run the clock backwards to the previous even more extreme event. It follows that an opposite change to climate–presumably cooling–between the two dates is even more disastrous than warming.
Mann says, “disastrous European heat wave of 2003 (during which more than 30,000 people perished)”
If you recognize the weaselly way Mann phrases it you’ll notice that he does not say that the heat wave caused the death of those 30,000 people. What he says is that 30,000 died during that time period, even though some of them may have died from other causes.
What a slime ball!
Wow. Mann seems to be putting on weight. This means he’s been consuming more than his ‘fair share’ of resources, and invariably contributing to AGW. Shame on on him; he’s causing Mann-Made global warming.
“But uncertainty is a reason for even more concerted action.”
That doesn’t apply to scientific pursuits, right? Unless they’re directing that increased ‘concerted action’ towards learning why there is so much uncertainty.
However, increasing ‘concerted action’ may be the correct path for other pursuits such as border protection, for instance, if there is uncertainty as to how well the border is being protected.
Aliens might attack Earth. Therefore we need to get off this rock immediately!!!
They don’t even think about what they say.
A chunk of frozen airline p!ss could be evacuated and fall on your house tonight at unimaginable velocity.
It might not, and I can’t prove it will—but do you really want to make that bet?
Therefore basic logic, going all the way back to Pascal, is enough to show that if you care about your family’s lives, you have to spend the night in your next-door neighbour’s house.
Of course, you might NOT care if your family lives or dies—that’s up to you, and science cannot answer a values question like that.
But IF you care, you have to swap houses for the night. If I’m wrong and you believe me, you’ve just been slightly inconvenienced for the night. But if I’m right and you ignore my advice, your spouse and children won’t survive the night.
Again, not telling you what to do—you don’t HAVE to give a tinker’s cuss about your family’s lives if you don’t want to.
No judgements here. This is a safe space.
No doubt the people next door are fearing the same outcome and are seeking a safe space in your house.
Indeed. All the better. No need to pay them for their hospitality—simply reciprocate it.
You’ve just eliminated the denihilists’/delayers’/debaters’ last objection to action. At zero cost, what excuse do YOU have (speaking generally to anyone listening)?
Presuming, of course, that your family’s survival is one of your values. As I mentioned, science isn’t value-prescriptive. So stay at home if you don’t care about the risk. Saul good, man.
What allowed the summer of 2003 to become so hot in europe. Was the fact that there was also a very warm and sunny spring in southern europe. Which allowed the Med sea to become very warm during the summer and the heat to build up over europe.
From the chart of Death rates per 100,000 in France… it looks to me like the heat wave that induced “excess deaths” in 2003 can also be blamed for a “shortage” of deaths during 2004.
And of course no mention is made of the fact that the inquiry in France afterwards blamed the lack of doctors and care workers in the summer months because they insist on all going on holiday at the same time. Most deaths were basically brought forward a few weeks.
If memory serves, a WSJ article at the time described the increased mortality rate in France during the hot summer of 2003 among the elderly population as due in part to their choice of clothing, the wearing of rather heavy garments inappropriate for a heat wave, and the lack of AC in older unrenovated homes. The media always forgets to mention that the average mortality rates due to seasonal effects are routinely 10x higher in winter than summer.
David: I’m having difficulty understanding the Texas PDSI graph. Is the severity index related to a negative amount or a short fall in the amount of rain? If so explain the absence in the PDSI graph of the severe multiyear droughts that occurred in TX, OK and the Great Plains States during the Dust Bowl in the early 1930’s.
The 1950’s were worse in Texas than the Dust Bowl. Here’s the PDSI for the Lower 48…
Here are the four westernmost NOAA climate regions…
The Dust Bowl was worst in the Northern Plains.
If I get a chance, I’ll plot Texas by subregion. The Dust Bowl will probably pop out in the Panhandle.
US PDSI, summer 1934…
https://www.giss.nasa.gov/research/news/20141014/
Nick,
“excess deaths” in 2003 can also be blamed for a “shortage” of deaths during 2004.
Which is may be true: the difference between excess mortality by cold waves and heat waves is:
– Cold waves are 10x more deadly than heat waves
– Heat waves mostly affect people which already suffer from illnesses which would have caused their decease a few days/weeks/months later, thus excess mortality is followed with a dip in mortality in the following days/months or even may be year.
– Not so for cold waves, which affect all ages with outbreaks of influenza an other (lung) illnesses which are typical for winter periods.
See Keatinge e.a. for Europa:
https://www.bmj.com/content/321/7262/670.full
and for 11 cities in the US:
https://academic.oup.com/aje/article/155/1/80/134292
If i remember correctly the French press at the time expounded the theory that the worst of the heatwave occu6in August when the elderly were home alone. For those famialiar with France it is famous for 2 hour lunches and being on holiday in August. In 2003 while families were on holiday at the coast or outre-mer their elderly family members were unsupported in city apartments with predictable results. Normally in France windows and shutters are closed in the afternoon or when temperatures rise and opened early to keep houses cool. The fall in the 2004 death rate and the lack of similar stories this year suggest that the French have taken on board the lessons of 2003.
” If we had acted on the problem when we knew about it for the first time decades ago … it would have been so much easier to keep the warming below truly dangerous, arguably catastrophic, levels. And what two decades of inaction — in part due to a public relations campaign by fossil fuel interests to pollute the public discourse over climate change, to fool the public and policymakers — what that has bought us is now …”

piglet telling porkies
Those control freaks really do hate it that people who disagree with them are allowed to speak.
All the world’s a stage, and humans merely hockey pucks being pushed about by players.
That’s a rink.
The worst drought decade for West Texas was the 1950’s. Midland’s driest year was 1951 (records have been kept since 1931).
If you look really hard at that deep red portion of France, I believe you will see a hockey stick.
“Michael E. Mann is distinguished professor of atmospheric science at Pennsylvania State University…,” whose professorial career is distinguished by the fact that he has published absolutely no science.
Paleo air-temperature reconstructions: pseudo-science.
Climate modeling: a liberal arts narrative decorated with mathematics.
What else has he done? Anything?
The wages of sin against climate science: distinguished professorships, awards, and valorization. So far has integrity fallen.
I’m sure I heard him introduce himself as that in testimony to the Senate. Clearly delusional.
We also know that cold weather, especially colder than normal weather, causes excess deaths. But what caused the marked reduction in deaths from 1987 to 1997? Was it warmer than normal or colder than normal? Or is this one of the standard non-sequitous correlations like the .997 correlation between the salaries of Methodist Ministers in New York State and the price of Scotch Whisky?
Why when I tick “Notify me of follow-up comments by email” do I never get follow-up emails? Occasionally people do read what I write and make follow up comments.
I love the smell of statistics in the morning along with my first cup of coffee. Another aspect of an analysis like this is to look at the time distribution between the events. Mean interevent period, antecedent dry period, minimum interevent time, and interarrival time are terms for this. Interevent time is particularly fitted to the exponential distribution. Interevents are a (not the)
Poisson process, assuming independence with respect to time. Note that variance is equal to the mean. A good fit means that coefficient of variation approaches 1. EPA’s Stormwater Management Model (SWMM, public domain) can analyze the rainfall record and calculate the CV for a selected interevent period. All one needs to do is iteratively select a period, push the CV button, and note
how close one’s guess is to unity. Now, how would one detect the Fingerprint of Mann on the hydrologic record? Split the record and do the analysis pre- and post-1950, for example.
Regarding the Precautionary Principle, this is a case of probability of end of world approaching zero times consequences approaching infinity. A zero times infinity quandary is solved by L’Hopital’s rule which works on quotients, not products, and is derived for example in
https://www.ditutor.com/lhopital/lhpital_rule.html
Scroll down to “The indeterminate form of zero times infinity is transformed as follows:. . .”
Zero times Infinity –> Zero.
Quod erat demonstrandum.
Unless–if I recall correctly–we are talking about the Dirac delta function –> 1
🙂
Just had my second cup. Peet’s Alma De La Tierra; I recommend it.
I hope Mann lives long enough to be exposed, instead of being called a distinguished professor just just deluded like Lysenko.
Indeed , first his ‘colleagues’ throw him under the bus to save themselves , and his made more than enough enemies on his own side to bring that about , then his ‘work ‘ is held up a joke and how not to do science along with others who long give up doing science for a much easier life of producing BS.
Its Mann ans is hockey team that denies the medieval warm period and the little ice age.
Ironic is’t it?
“It’s not rocket science.” No indeed. Nor is it any kind of science at all. Mann is a disgrace to himself, and to his profession.
His whole profession is a disgrace. How can you take a profession seriously when one of the top professors says “How can we hide the decline?” and then refuses to hand over his data so that it can be replicated. Climate science has extended so far down the rabbit hole that the only logical thing to do is to fill in the hole so that the digging comes to an abrupt halt. Climate science is finished as a valid profession. The problem is that it has started corrupting other sciences. For these sciences to be saved , climate science must go.
“If you’re going to exaggerate, go ahead and exaggerate! Wikipedia puts the death toll at 70,000, with nearly 15,000 in France!”
Here’s some support from a most unlikely source — George Monbiot in the Guardian!
https://www.theguardian.com/commentisfree/2011/apr/05/anti-nuclear-lobby-misled-world
“We have a duty to base our judgments on the best available information. This is not only because we owe it to other people to represent the issues fairly, but also because we owe it to ourselves not to squander our lives on fairytales. A great wrong has been done by this movement. We must put it right.”
If you only read one article in the Guardian, it should be this one.
+42… I threw this together a few years ago…
As I remember it (I’m from 1962 and Danish), the two most outstanding hot summers were in 1975 and 1976. In 1975 I had a 3 week camping holiday with my parents and siblings in france and it was 35C in the shade for just about the whole holiday. And when we came back to Denmark, it was also 35C in the shade there! Then in 1976 it was 36C in the shade, and that summer is easy to remember, because there was a serious drought and when you walked to the water, a lot of ladybugs would land on your arms and “bite” to get some fluid. 2003 was NOTHING compared to that.
https://www.youtube.com/watch?v=r0l3tymEagc
Tony Heller’s latest video proves beyond the shadow of a doubt that 97% of climate science is fake. NOAA and NASA GISS should be charged with fraud and their top administrators jailed for treason.
Alan Tomalty,
Someone on a Yahoo comments section directed me to the following NASA webpage:
https://climate.nasa.gov/evidence/
It reads more like propaganda than science. Among other things, it has the classic claim that the “acidity” of the oceans has increased 30%. No objective person would quote that out of context.
Once a fraud always a fraud!
https://climate.nasa.gov/scientific-consensus/
The NASA website has a graph that puts 5 different temperature datasets on a single graph from 1880 to 2017 or so (hard to tell what latest year is) . Of course all these datasets are fake because they have suppressed the warming of the 1930s. 3 other things stand out. 1) The data sets are almost exact matches of each other 2) One of the datasets is GISTEMP which includes water temperature data along with land air temperatures. 3) Another one of the datasets is called Cowtan and Way.
So I go to their website to find out what the heck is that dataset? Lo and behold I find this caveat on their website. I quote: “Maintaining a scientific data set to professional levels of quality assurance is beyond our resources. These results are therefore presented as a best effort. ”
So it seems that NASA will accept data submissions from private individuals even if you admit that you can’t keep the data up to professional standards. I guess this isnt too surprising in the climate science field when you realize that there isn’t any data standards in climate science. It is a wild west free for all of “HIDING THE DECLINE, JUXTAPOSING TEMPERATURE DATA FROM LAND STATIONS TO WILDERNESS AREAS 1000’S OF KM AWAY, USING PROXY DATA AND REAL DATA ON SAME TIMELINE IN A GRAPH, ADJUSTING TEMPERATURES DOWNWARDS 80 YEARS AGO SO THAT YOU CAN CLAIM AN INCREASE, USING 2 DIFFERENT TECHNIQUES TO MEASURE SEA RISE AND PUTTING THEM ON SAME TIME LINE, USING A BOGUS CONCEPT OF glacial isostatic adjustment TO ADJUST LAND LEVELS FOR SEA LEVEL MEASUREMENTS, MIXING SEA WATER TEMPERATURE DATASETS WITH LAND AIR TEMPERATURE DATASETS, FAILING TO COMPLETELY ACCOUNT FOR UHI EFFECTS, AND WHOLESALE READJUSTMENT OF TEMPERATURES 20 YEARS LATER FROM GRAPHS THAT WERE ORIGINALLY PUBLISHED TO PRESENT NEW FRAUDULENT GRAPHS. Did I leave any other climate science data fraud procedures out?
To think that billions of dollars are being spent on this fraud and because of this fraud boggles the mind.
This little graph from Portugal tells a very different story…
Clear shows that around 1860 and 1945 were warmer periods.
1979 the coldest since 1860 (no surprise there)
and current temps somewhere between.
There is data still out there that hasn’t been “adjusted” yet.
Don’t let NASA get its hands on that data – it will be tortured
Considering that around 2 million 3 hundred thousand people die in Europe every 3 months on average, 70 thousand additional people represent an increase of 3%.
Now I would like to compare that with the reduction of the death toll due to a warm spell in winter. For the sake of fairness.
In reply to myself, Europe saw an extremely mild winter in the winter of 2006-2007. Looking at the change in the death rate of France between 2002-2003 and 2005-2006 in the charts above, the reduction is MUCH greater between 2005 and 2006 than is the increase between 2002 and 2003.
And, if I may continue to reply to myself, according to this study below excess winter deaths on a NORMAL year in Europe between 2003 and 2011 was 250 thousand people (or 2 million excess deaths in those 8 years).
https://academic.oup.com/eurpub/article/25/2/339/486080
Seems like any normal winter is far worse for mortality rates than the worst hot wave ever seen in a hot summer in Europe.
doom not even right around the corner apparently its already here, we are just to dumb to see it.
Mann misquotes and misrepresents the Precautionary Principle. You don’t spend more on avoiding the cost, than the cost will be.
And if there is uncertainty about the future cost, you DISCOUNT it – in technical terms use a higher discount rate to allow for the uncertainty. You can be pretty certain about the costs today of taking action but future costs are very uncertain, thus they need to be much higher to to anything about them.
I know the heat wave actually happened… but it’s strange, I was in Paris for a week in July 2003, and remember the weather was warm but generally quite nice. Nights were beautiful.
Clay dunes (cohesive granules of clay), unusual in requiring very dry conditions were reported as the base soils of Port Isabel and surrounding areas in the Rio Grande delta. “The annual precipitation at Brownsville has varied from 8.8 inches in 1870 to 60.6 inches in 1886.”
From
Coffey, G. N. 1909. Clay dunes. Journal of Geology. 17:754-755. Open access on JSTOR
https://www.jstor.org/stable/30058593?seq=2#metadata_info_tab_contents
They were rejuvenated during the 50s drought, even one on the central coast. Don’t know if anybody has tried to date them. Armstrong Price and Gordon Gunter (1943. Certain recent geological and biological changes in south Texas, with consideration of probable causes. Transactions Texas Academy Science. 26:138-156) suggested droughts in the 1880s-90s were a signal of change in climate after 1870, but confounded by overgrazing.
There are lots of old stories in Texas history about drought. I was told a more recent one from a rancher in the Hill Country losing cattle in the 1950s. Settling in a wet period there was tempting. Right now its very wet.
If anything is different than last year, CO2 whut dun it.
And even if there’s nothing different.
When it comes to hot dry summers in the UK its 1976 which sets the marker to judge them by not 2003.
Although l expect the summer of 2018 will become the new marker to judge future summer by. As there are a greater number of people alive to remember it.
yet in 76 there where stand-pipes and water shortages but not n 2018 despite the higher demand for water .
What l think made the difference between the summer of 1976 and that of 2018.
Was the fact that in the summer of 1976 the month of August was very hot and dry. Where in the summer of 2018 it was not.
Heads you lose , tails I win , any ‘extreme’ event can be used as proof and nothing can disprove , meanwhile there some classic tricks for example the ‘on record ‘ never says how long or how good .
these are . And of the course the ability to now measure events which would have be harder or impossible in the past , does not mean these events did not happen merely that the ‘proxies ‘ used to measure them because of the lack of direct measurement are missing or of poor quality so cannot be trusted , ironic considering how Mann git his ‘fame’ in the first place.
In all you can say ‘this is not science’ in action, but then it never was
1st Man -‘Say, what business are you in ?’
2nd Mann – ‘Im in the fear business’
1st Man – ‘and how is business doing?’
2nd Mann – ‘Business is doing great’
From Mann’s photo, he may be doomed anyway. Looks like he has been on the banquet circuit a little too long and at his age, is setting himself up for the big one.
The rhetoric has ramped up considerably from the left side. But if the upcoming predicted very cold winter comes to the populated areas of the US east of the Rockies (along with snows in the Southeast), even if they continue on blaming cold on hot, they will get more and more tuned out. You can only cry wolf so long before you just don’t listen anymore.
Someone needs to tell Mann that weather is not climate. I mean, it’s not rocket science.
How wrong can it get…
It is NOT the job of The Scientist to put HIS or HER personal twist on what they have found.
It is not their job to sensationalise their work with words like unprecedented and extreme
The Scientist is an educator, a teacher.
As such, The Scientist should communicate in a measured & level-headed fashion what they have found.
ACTUALLY found and not what they THINK they have found especially what they think lurks inside computers.
Thence, The Students (that’s = us, our politicians & leaders and everybody else) decide what to do about it.
It is NOT their job to determine policy, behaviour incentives, legislation and tax.
Not in the very least because their income (are there actually ANY ‘Private Sector climate scientists?) comes out of tax revenue, or via Government mandated fees such as Student Loans and Tuition Fees.
They are Cronies and are *wildly* overstepping their marks.
Has anyone got the guts to reign them in or, are they all busily celebrating ever rising yields of wheat, barley, cannabis and indirectly, opium.
Mind-bending substances all
Was it exactly the creation of huge numbers of ‘Patriarchs’, tax collectors & spenders plus legions of lawyers to back them up plus endless rent-seekers and other cronified hangers-on that brought down Rome – and how many more ‘civilisations’?
Eventually what was left of the Plebians either died-out or walked away
(And Rome was powered by what at the end, 3 ship loads per day of imported (because they’d destroyed *their* dirt) wheat and how much alcohol?
That was handy as grapevines (and olives) don’t seem to mind living in deserts. Barley also it seems.
Mediterranean Diet anyone?
Not good for modern Mediterranean kids, 25% of under 5s are now obese.
Just *who* is doing the denying?
No.
The Climate Scientists will tell us it was Climate Change wot did it
Peta of Newark
“The Scientist is an educator, a teacher.
My opinion is that a scientist is an advocate for all those who don’t understand science.
Their job is to convey science in understandable terms to those who’s shoulders they stand upon, the common people who don’t have the benefit of a higher education.
They are leaders, and as such should lead by advocating for those people, including me.
I see more advocacy on sceptic blogs than I see elsewhere in climate science.
Some accept education as their gift to society. Humility is their reward.
“Not good for modern Mediterranean kids, 25% of under 5s are now obese.”
You always go there, don’t you, no matter what the subject. You need to get a life.
You can often spot the pretend wannabe-scientist by their excessive or unjustified use of language.
And so it is with climate scientists. Every location, everywhere on the planet, has “extreme” temperatures every year. The lowest annual temperature and the highest annual temperature represent the two “extremes”. The charlatans who call themselves climate scientists will then bandy these words about, often in a quite correct technical sense, but knowing full well that the man, woman, or child, on the street will interpret the word extreme as something more alarming than it really is.
Their aim is to deceive and frighten the uninformed, not educate or inform them. Frankly, I find it disgusting.
What I find objectionable is the use of words like “extreme” being used to describe October temperatures in a place like Canberra. Yes, October was a bit warmer than normal this year. But, at 35 Centigrade, it was far from extreme. I have lived through Decembers that reached 43 Centigrade (jogged around Lake Burley Griffin at the time), but I wouldn’t even call them extreme. Very hot, yes. But not extreme, in fact common in the historical record.
David, using probability statistics to estimate records broken (floods, snowfall, droughts, etc), requires that you treat your first randomized position data point as a record. The probable number of new records we should expect in 100 yrs is Ln100= ~5 (calculated is 4.6) if droughts are random, which your finding supports. I’ve done this for snowfall in New Hampshire and floods on the Red River of the North and similarly found support for a random process. The fact that specific humidity globally for some reason hasnt increased with the little warming we’ve had over a century suggests that minor warming, at least, hasnt yet overwhelmed a random process.
Gary
I really could use any analysis you have available on periodicity of floods on the Red. Richard in Brandon.
Like the Mann donkey the Flannery donkey here in Australia doesn’t worry about how much BS and nonsense he throws about. His clueless nonsense included dire warnings about drought, SLRise, temps etc.
And he was ably assisted by the dopey MSM and a number of gutless/ stupid so called scientists. The MDB is our largest irrigation area and since 1895 to 2017 the data shows that OZ is a much wetter place than it was for the first 75 years of the data or 1895 to 1970. Here’s the data from the BOM for OZ , up to 2017.
http://www.bom.gov.au/cgi-bin/climate/change/timeseries.cgi?graph=rranom&area=aus&season=0112&ave_yr=8
And here’s the rainfall for NSW 1895 to 2017. Note that Mill drought was a problem because the Indian ocean dip[ole (IOD) was in the positive or neutral phase from 1992 to 2009.
http://www.bom.gov.au/cgi-bin/climate/change/timeseries.cgi?graph=rranom&area=nsw&season=0112&ave_yr=8
Note that the big Fed drought started in 1895 to about end 1902 and that’s why I’ve started at 1895 although not shown in the BOM graph. But terrible rainfall in NSW from 1895 to about 1949. Just look at the BOM data.
When will these donkeys stop preaching their BS and when will the media grow some balls and tell the public the truth?
MDB = Murray-Darling Basin, for those not living in Australia.
So if 15,000 people died in France due to the heat wave, did anyone examine what the other 67 million people did to survive?
These days, Michael Mann looks like an inflatable plastic replica of himself. Mann is putting on weight. This leads me to conclude that he has been consuming more than his fair share of our resources. What this has done to his CO2 emissions is best left to the reader’s vivid imagination.
I’m sick of it , SICK OF IT, I tell you, SICK OF IT !
to think that a PhD can be sooooo stoopid. The King’s new clothes….. I think he ( ie Mr M Mann) should be de-vested of his degree.
When an activity raises threats of harm to human health or the environment, precautionary measures should be taken even if some cause and effect relationships are not fully established scientifically.”
What happens if the climate cools?
Wind and solar are unreliable. Cold weather is much more dangerous that hot weather. Perhaps the precautionary principle need to be applied to this possible outcome as well.
We know that mitigation of their so called CAGW is just BS and fra-d. See Dr Hansen’s comment about Paris COP 21.
Since then non OECD emissions have soared and OECD have leveled off,so why doesn’t Mann etc protest in China, India etc and praise the USA for having the greatest reduction in emissions? Can’t he understand simple first grade sums?
Oh and today the world generates just 0.8% of TOTAL emissions from the S&Wind idiocy. Oh and China generates 66.7% of their TOTAL energy from KING COAL and the USA just 17.1%. See Lomborg’s articles using the EU based IEA data.
Sorry above should read the “world generates just 0.8% of TOTAL energy from S&Wind”.
Mann, et al don’t protest against China’s behaviour inside China because you can get in real trouble for doing that. Only in the West, can you treat being arrested for pointless protests as a positive. In China, a prison term is a real punishment.
More Mann-splaining.
1540?
I’m confused. “Yamal 06”, the magic tree that did away with The Medieval Warm Period and The Little Ice Age, didn’t grow in France.
Are they now accepting the historical evidence that Mann dismissed?
“Here in Texas, rather than destroying our economy just in case droughts get worse in the future, we build dams and expand water infrastructure.”
Wow. I wish they did that in Kalifornia. When I lived there, we passed a bond to finance new dams. But few read the actual proposition. Very little went to new dams. Some went to pay for tearing down dams that Buffet didn’t want to pay for after he bought them. Some went to disadvantaged communities. Most of the rest went to studies.
So I left.
Used to have much stuff to add, technical or otherwise. Seldom any longer, as here, since already said at least once before here over the years.
The only way we can get under the skin of these people, (Mann etc) is to take the word ”denier” out of their usable vocab and the only way to do that is start calling them deniers at every opportunity. They are denying just as much if not more than anyone else. They should NOT own the word. If instead they start using the word ”skeptic” to distance themselves, then we should call them skeptics as well. We are skeptical that co2 drives climate warming and they are sceptical of evidence to the contrary. What gives them the exclusive right to those words?
I say throw the cat amongst the pigeons. Force a change in the narrative. Give them back what they give!
No way are people like Mann skeptics. It comes from the Greek word for thinker. Mann & co are gnostics, which means believer. They truly believe that what they say is true. If not actually true, it should be true.
No amount of evidence will ever sway them.
MikeMike,
You get it. They don’t like it up ’em.
A few years back, before I was blocked at SkS, I criticized Lewandowsky’s dodgy survey there. I thoroughly span their little Regan-like heads around by remarking that he’d contacted “the pro-science blogs” first, then “the anti-science blogs”—but naturally, I was using those labels in the honest sense, contrary to Lewandowsky’s misuse of them. Boy did that confuse them. Nobody (on the dumb side) could tell if I was agreeing with Lew’s narrative or objecting to it. Fun times.
Anyway,
+ 137
Everyone else: MikeMike is right.
What Mann needs is a court room battle, to settle the issue once and for all. Then he could eloquently demonstrate his climate knowledge, and put his academic papers to a jury where they would surely find his work irrefutable. But where do you find a convenient court case when you need one?
From the article: “The 2003 European heat wave led to the hottest summer on record in Europe since at least 1540.[1] France was hit especially hard.”
Let me guess: The center of the high-pressure system that caused this heatwave was sitting on top of France.
The severity of a heatwave is determined by how long the high-pressure system spends over a specific geographic area. The longer it sits in one place, the hotter it gets underneath.
I guess Mann is claiming CO2 is the control knob for how high-pressure systems move or don’t move.
It was not too long ago that all these dire predictions of doom and weather changes because of CO2 were supposed to happen in the future. But then we started getting more and more alarmists claiming CO2 is already affecting the way the climate behaves and changing it, and now we have Mann making the same claim. With no evidence whatsoever, I might add. The fact is all the statistics show that extreme weather events are getting less extreme and fewer in number as compared to the past. Mann should address that.
From the article:
“Manntastic Claim: 2011 Texas Drought Devastating Because: Climate Change!
[T]he devastating 2011 Texas drought (during which ranchers ranchers in Oklahoma and Texas lost 24 percent and 17 percent of their cattle, respectively)…
I have lived in Texas since 1981. The 2011-2012 drought was really bad… Almost as bad as The Last Picture Show drought.”
I lived in Oklahoma during this time and I must say the summer before this drought finally broke was one of the worst heatwaves I have ever personally experienced. That’s what the Dust Bowl was like, only instead of stopping after one summer, the extreme heat went on for a decade.
The 2011 drought was very bad. I was out every day trying to water as many trees as I could manage. I don’t know that that made any difference but I made the effort anyway. My water bill was through the roof. I was so hot that even the ticks were nowhere to be seen as I walked through the underbrush.
The super deluge of rain that finally broke that drought and heatwave was very much appreciated. The amount of rain we got almost wiped out the rainfall deficit at one fell swoop!
Since that very hot summer and drought, the weather around here has been some of the most benign that I can remember. I hope it continues.