Alternate Title: The Annual Cycle in Global Land+Ocean Surface Temperature IS Far Greater Than 1.5 Deg C, AND Much-Much-MUCH Greater Than 1.5 Deg C Annually for Global Land Air Surface Temperatures
We all were taught early in school that the Earth orbits the Sun…that its path is elliptical…that because of the tilt in Earth’s axis of rotation, we have seasons as the Earth orbits our star annually. Because of the elliptical orbit, and because the ratios of land to ocean are different between the Northern and Southern Hemispheres, we might expect that global average surface temperatures would vary over the course of a year.
Later in life we’ve been brow beaten with alarmism about human-induced global warming and climate change…that the Earth will become a literal—not figurative—hell if global surface temperatures rise—formerly 2-deg C—now 1.5 deg C above pre-industrial levels. But does the average person know much global surface temperatures vary annually as it orbits the Sun? It’s unlikely, because I’ve never before seen graphs that are similar to what’s presented in this post or seen it discussed in any of the global warming literature. Am I expecting most persons to find this information to be of any interest? Nope. I simply find it noteworthy that, as I mentioned before, I’ve never seen it presented anywhere. In fact, I just Googled, in quotes, “How Much Do Global Surface Temperatures Cycle Annually?” and Google replied (their boldface), “No results found for “How Much Do Global Surface Temperatures Cycle Annually?”.
Remarkable, is it not, in these times of global warming interest?
Enough with the preamble and on to the meat of the post:
The mainstream media and blogosphere went berserk with the release of the most recent propaganda-overloaded Special Report (SR15) by the UN’s global-politics-driven Intergovernmental Panel on Climate Change (IPCC). Their stories about the report were filled with all sorts of nonsensical gloom and doom prognostications about life on Earth should the rise in global surface temperatures exceed 1.5 deg C above “pre-industrial times”, which has also been redefined with SR15.
It wasn’t long ago, the gloom-and-doomsters focused on a 2-deg C change in global surface temperatures from pre-industrial times, but the point in time at which we were predicted to reach that 2-deg C threshold of all-nasty-things-to-come must have been too far in the future for them, so they revised their focus to a 1.5 deg C change in global surface temperatures to bring it nearer in time. In other words, as is characteristic of gloom-and-doomsters, the future gloom and doom is always a moving target.
BUT
As the title of the post asks, do doomsters know how much global surface temperatures cycle annually?
DATA SOURCES: The sources of much of the monthly global surface temperature data in absolute form are the following webpages at the Berkeley Earth website:
There, each listing is preceded by “Estimated Jan 1951-Dec 1980 monthly absolute temperature (C):”
For the 1951-1980 averages in absolute global (90S-90N) sea surface temperatures, I used NOAA’s much-adjusted ERSST.v5 sea surface temperature data, which is available through the KNMI Climate Explorer. Berkeley Earth uses the period of 1951-1980 for their anomalies. The KNMI Climate Explorer is also the source of the climate model outputs. As usual, I’m presenting the average (the consensus) of the outputs of the climate models stored the CMIP5 archive, which were used by the IPCC for the 5th Assessment Report. The models for this post are those driven by the historical forcings that precede the RCP8.5 forcings used for climate projections.
ANNUAL GLOBAL CYCLES IN TEMPERATURE
Now, we all have an idea of how much surface temperatures vary in our home towns. And we’ve all seen or heard the argument that goes like:
1.5 deg C? Where I live, temperatures can easily drop below -10 deg C (14 deg F) in winter and rise to about 35 deg C (95 deg F) for a few days in summer. We’re used to 45 deg C (81 deg F) swings in temperature each and every year. So who cares about 1.5 deg C (2.7 deg F)?
BTW, those truly are the conditions for where I live…and have been as far back as I can remember.
But few people realize that global surface temperatures vary noticeably as the Earth orbits the Sun and that the annual change in global Land+Ocean Surface Temperature is more than twice the gloom-and-doomsters’ 1.5 Deg C, and much-much-MUCH greater that 1.5 deg C for the annual cycle in Global Land Air Surface Temperatures.
As shown in Figure 1, depending on which of the Berkeley Earth Global Surface Temperature (BEST) datasets are referenced—with air over sea ice or with water under sea ice—the average annual cycle in global surface temperatures for their base period of 1951-1980 is estimated to be somewhere between 3.4 deg C or 3.7 deg C.

Figure 1
Even persons (climate scientists) who live in the politics-driven fantasy worlds of climate models have witnessed in their virtual worlds, on average for the period of 1951-1980, an annual change in global surface temperatures of 3.8 deg C.
Referring to Figure 2 below, according to Berkeley Earth, the average annual cycle (for the Berkeley Earth base period of 1951-1980) in global land-air surface temperatures is 11.8 deg C (almost 12 deg C) and that, of course, is much greater than the annual cycle in global sea surface temperatures (0.4 deg C) based on NOAA’s ERSST.v5 sea surface temperature data. In other words, the annual change in global land surface air temperatures is almost 8 times higher than the 1.5 deg C long-term change that agenda-hungry, unelected UN politicians from around the globe are telling us we need to avoid.
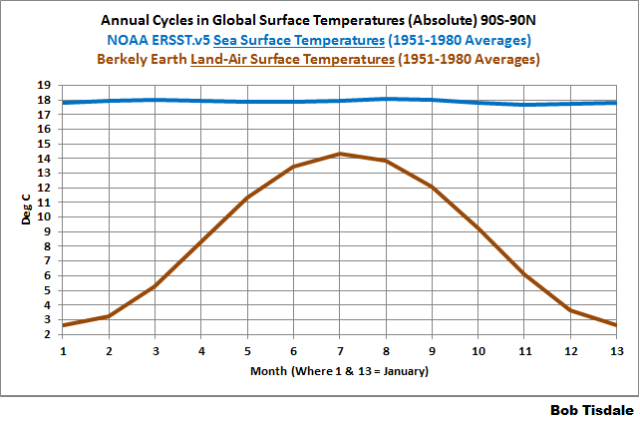
Figure 2
Thank you, oceans, for tempering Earth’s climate.
GLOBAL LAND+OCEAN SURFACE TEMPERATURE DATA & LAND SURFACE AIR TEMPERATURE DATA AND LINEAR TREND LINES FROM 1850 TO 2018 IN ABSOLUTE FORM MAY ANSWER THE TITLE QUESTION
If you have spreadsheets prepared that convert data from column form to table form and back from table to column again—as I do—it’s easy to take the monthly Berkeley Earth surface temperature data and add to it the monthly average absolute temperatures for their base years of 1951 to 1980, so that the global surface temperature data can be presented in absolute form. See Figure 3 for the Berkeley Earth (BEST) monthly global land+ocean surface temperatures and linear trend, from September 1850 to September 2018, presented in absolute, not anomaly, form.
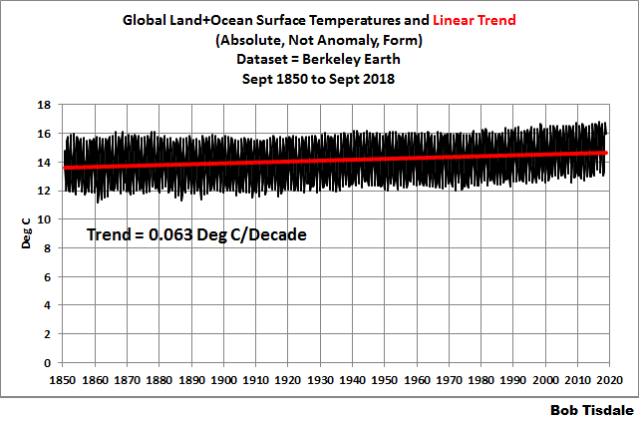
Figure 3
Figure 4 presents the monthly global Berkeley Earth land surface air temperature data and trend in absolute form, again from September 1850 to September 2018. In other words, there’s no ocean-based data to soften the annual cycles.
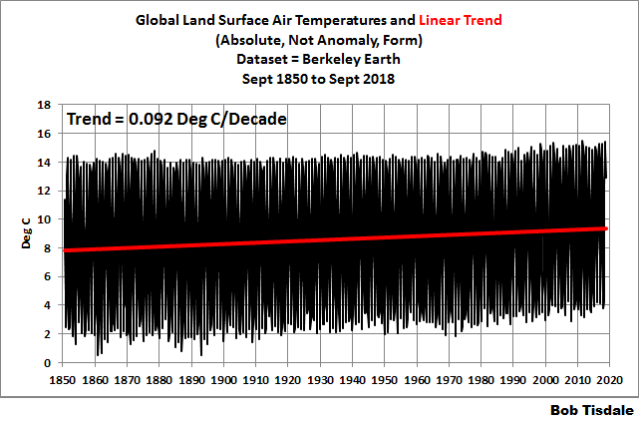
Figure 4
[Sarc on.] Hmmmm, maybe the doomsters do know, and the examples above in Figures 3 and 4 are the real reasons why NASA GISS, NOAA NCEI, and the Met Office’s Hadley Centre will only furnish their global land-plus-ocean surface temperature data and global land-air surface temperature data in anomaly form. Oops, it appears that NASA GISS, NOAA NCEI, and the Met Office’s Hadley Centre forgot to tell Berkeley Earth, and Berkeley Earth spoiled it for them all. Oh well, back to the old drawing board! [Sarc off.]
Again, thank you, oceans, for tempering Earth’s climate.
That’s it for this post.
Have fun, and enjoy your Monday!
STANDARD CLOSING REQUEST
Please purchase my recently published ebooks. As many of you know, this year I published 2 ebooks that are available through Amazon in Kindle format:
- Dad, Why Are You A Global Warming Denier? (For an overview, the blog post that introduced it is here.)
- Dad, Is Climate Getting Worse in the United States? (See the blog post here for an overview.)
Just like you may have learned something new today with this post, you might learn much more from the books.
To those of you who have purchased them, thank you. To those of you who will purchase them, thank you, too.
Regards,
Bob
But, but, DOOM!!!!!
Thanks Bob. Here is another way showing the annual fluctuations.
A followup comment. The different behavior of the two hemispheres came to my attention via a comment by EM Smith:
“I’d actually assert that there are only two measurements needed to show the existence or absence of global warming. Highs in the hottest month must get hotter and lows in the coldest month must get warmer. BOTH must happen, and no other months matter as they are just transitional.”
The data on summers and winters in the two hemispheres is readily available from the BEST dataset.
Bottom line: The results show winter minimums have warmed, while summer maximums have not. That pattern is consistent with Urban Heat Island Effect. But even if less cold winters are due to CO2, how is that a bad thing? How much should we spend to prevent slightly less cold winters?
Details at https://rclutz.wordpress.com/2015/06/22/when-is-it-warming-the-real-reason-for-the-pause/
+1 I miss E.M. Smith.
I agree Roger; but, did E.M. get tired of us?
“The data on summers and winters in the two hemispheres is readily available from the BEST dataset.
Bottom line: The results show winter minimums have warmed, while summer maximums have not. That pattern is consistent with Urban Heat Island Effect.”
I don’t think it is an Urban Heat Island effect. The milder winters and milder summers are just what I have been experiencing for the last few years and I live in a rural area. The last few years have been some of the best weather in my lifetime. I hope this kind of weather continues. May “the Pause” go on forever! 🙂
My daughter’s old boss, now a rail manager is certain the fact he was trying to research this more fully got him black listed from any government funding in the UK and led to his now very significantly more lucrative employment in his current job. His view was that it while distressing at the time ended up highly beneficial for him but makes him despair about the future of research with such total lack of integrity in the controllers.
And here’s another, courtesy of the National Weather Service:
https://www.weather.gov/slc/CliPlot
A specific place has a climate, characterized by its annual temperature range (the difference between the highest highs and the lowest lows) and the amount of precipitation. For SLC Utah the range is between -20 F and + 100 F, with average precip of ~ 16 inches per year.
120 degree F annual range. Typically a 40 degree, and up to 60 degree daily range.
Now that’s Climate!
I am also a Wilson. Are you related to Deliverance Wilson?
Less cool winter in Arctic and less cool nights.
That is the result of more water in the air and more asphalt on the ground.
It is like the sea. It gives heat distribution.
MCWA!
Make Canada Warmer Again
And our federal government wants to make it colder! Not sure who’s side they’re on.
Some people think they should have the right to be cold. link
commieBob
Yet more of the tail wagging the dog. Minority groups determining the future of mankind whilst masquerading as democratic participants.
Try some of the colder places like Canada. Summer temperatures over 30C, winter temperatures of -30C.
Same here in Finland. Difficult to care about another 0.5C, really. Although, when said publicly, everyone starts telling me how climate change is not about climate getting warmer, but how storms will increase and how the Golf stream will stop and we will freeze (and how the titans will rise from the earth and trample us to dust and the gods will weep), and… I roll my eyes. Every other year the same people are yelling “see, record heat during summer/winter, climate change!”, “see, record cold during summer/winter, climate change!”
Biggest swings are in Siberia
In Calgary this year we had a low of -31°C (twice) and a high of 37°C. That’s 68°C variation (122°F). It’s possible that we get colder yet this year. We will see.
The temperatures in northern Vermont range 60-73C every year. Last year temperatures at our local county airport (Island Pond, Vermont – grass strip no asphalt) were -36C in January and reached a high of +33C in July. In 2003 the temperatures dropped to -40C and the high was +33C. In a mild year like 2006 temperatures ranged from -27C to a high of 32C. A +/-1.5C change is unremarkable.
https://w2.weather.gov/climate/xmacis.php?wfo=btv
There are places in Yakutia with an annual range approaching 100 C.
https://en.wikipedia.org/wiki/Oymyakon
Hah! That’s apiddling variaiton. We had +40C one day this summer and bracing for our usual -30C winter.
Ottawa +30C to -30C in 6 months
Ditto for Calgary. And you can make a similar argument for sea level rise. Daily, Monthly and yearly tide fluctuations are greater than the past 2000 years of sea level rise.
H***, the wave-wave fluctuations are greater than the last 2,000 of alleged SLR!
Another informative post, Bob – thank you! However, we need this kind of information to be shouted from the mountain tops. We risk losing this fight if we don’t do something to counter the propaganda of the BBC, CNN & the vast majority of MSM broadcasters & newspapers, both print & online. Our schools are busy raising a generation of youngsters spoon-fed on catastrophist propaganda.
I realise that isn’t a revelation to most denizens of WUWT but we ignore it at our peril. We need to find better ways to put real information in the hands of those who will make decisions in the future…..and we need to find ways to stop governmental complicity in this scam across much of the free world.
Is not the fact that GMST fluctuates cyclically with such magnitude in our data records proof that our temperature sensors are biased toward one hemisphere (presumably the Northern)? If we had a truly uniform distribution of thermometers, the only variation would be due to orbital eccentricity, which should be much smaller. Eh?
Not necessarily. Note that the widest variations are in the land temperatures, and the sea temperature varies very little, as shown in one of the charts above. The Northern Hemisphere has a lot more land than the Southern Hemisphere, so the annual variation in the SH will be less than that in the NH.
I’m not suggesting that there isn’t an inherent bias in that the NH has a lot more temperature sensors than the SH, but that isn’t the sole issue.
When you consider that sea temperatures range from about -2C to 34C (i.e. about 36C in total) and land temperatures range from about -40C up to 55C (95C in total) it’s not surprising that the larger land area in the Northern Hemisphere gives it a wider temperature range than in the SH.
Do Doomsters Know How Much Global Surface Temperatures Cycle Annually?
No, they do not know and they do not want to know. They want their personal thermostats set at 74F, no higher, no lower and no interference with the availability of whipped soy latte half-caff arabica bean coffee.*
You are/will/have been inconveniencing them when you tell the truth and put it in front of them. They live on a flat planet which the Sun circles and they don’t want to hear or know about anything else.
Can I have my peanut butter and grape jam sandwich now?
*No coffee beans were injured or embarrassed by my statement.
Yes, and the anomaly data is constantly changed. So once again here’s GISSTEMP’s Land Ocean Temperature Index (LOTI) as it was in 1997 compared to the 2018 version
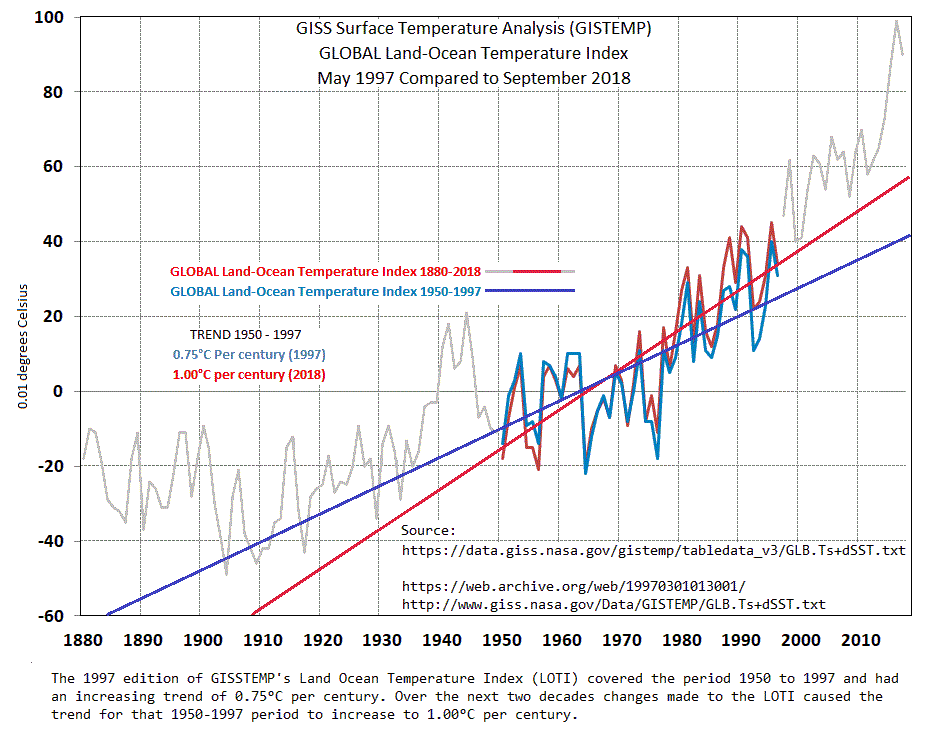
and the links to the data:
1997
2018
Since 1997 there should have been 252 editions of the LOTI and over 330,000 individual monthly entries. Each month about 25% of the monthly entries are changed. So that’s over 80,000 changes made over the two decades of LOTI reports. Those changes add up and the temperature trend for the period 1950-1997 has increase from 3/4°C per century to 1° per century.
Yes data needs to be reviewed and if necessary changes need to be made along with documented reasons why. What’s at issue is the volume of changes and how it affects the final product.
different datasets
different methods
science, its a self correcting thing
Hmmmn, all the information on annual variation in surface temperature got purged from the internet some years ago. Can’t have real facts out there, the people may stray from the reservation.
The UK is presently enjoying unseasonably warm october weather.
According to the Met Office, the UK weather map for today shows that temperatures are around 8 degC in Scotland and 15 deg C on the South coast. I suspect that if one included all the outer Islands off the coast of Scotland, the range would be about 9 degrees from around 6 degc to 15 degC.
It is not at all uncommon to see a range of temperature of around 9 or even 10 degrees between North and South of even a small country like the UK.
This begs the question: what is the ideal temperature for the UK, is it 8 deg C (as in Scotland) or 9 degC or 10 deg C or 11 degC or 12 degC or 13 degC or 13 degc or 15degC (as on the South coast)?
It begs the follow on question; which county in the UK is presently facing climate Armageddon because it is 2 degC warmer than some other part of the UK?
It begs the further follow on question: why would Scotland face Armageddon if instead of being 8 degC it was now 10 degC, and the South coast instead of presently being 15 degC it was 17 degC
What a lot of people do not appreciate is that the Channel ISles are usually about 2 deg warmer than the South coast, France some 2 to 8 degs warmer than the UK, and Spain about 10degC warmer than the UK South coast. Life goes on happily in those countries, we go on holiday to them and people chose to retire to them so that they can enjoy the better climate.
There is also a failure to appreciate that it is very much more difficult to warm the equatorial/tropical regions of the planets. So we are not seeing the Middle East and Africa increasing in temperature by 2 degC. Wouldn’t it be entirely beneficial if the mid to high Northern latitudes were to warm a bit say 2 to 4 degressC. this would make them mush more hospitable and of course would reduce extreme weather since the temperature gradient between the equatorial/tropical regions and the poles would be less.
One of the biggest cons is that a warmer world would be a bad thing. Everything we know about this planet, life on this planet now and in the past, the advances of civilisations and basic skills leads to the conclusion that warmer conditions are better.
There you go. Bringing logic in to it again! You should be ashamed, haven’t you heard that we are trying to save the planet? (/sarc., as if needed).
“…does the average person know how much…” The “how” is left out in the introduction.
The answer is no. Somewhere on the internet is a video of various graduates of a prestigious university, Harvard I think, trying to explain the origin of the seasons. I saw the video maybe 12 years ago, and have no idea if it is still around. Their explanations fail widely. They mainly think the cause is our elliptical orbit. A person can be highly educated and still a dangerous fool.
Look here. This is not the documentary I was thinking of, but it presents a few examples.
How funny, I referred to that when commenting on Dr Ball’s recent article “Most People Live in a Flat Earth and Struggle to Visualize Climate and a Three-Dimensional Atmosphere.”
These university students were unaware of the axial tilt of the planet and how that axial tilt controls the seasons. They thought that the reason why it is cold in winter is because the Earth is further away from the sun, and yet in the Northern Hemisphere winter, the planet is nearer to the sun.
Basic education is lacking.
It’s thinking that’s lacking. If the reason for summer and winter were the distance to the sun then both hemispheres would have summer and winter at the same time. But…
The daily variation in surface and air temperatures (as a result of radiation to space) is even more dramatic.
No,Bob. You just don’t understand the problem. Hotter summers will be bad for good brown people in warm countries; less cold winters will be good for bad pale people in cold countries. Double plus ungood!
Perhaps better to thank the oceans for maintaining our average surface temperature some 90K above that of the moon, unless of course one believes that the atmosphere has heated the deep oceans to their current ~275K.
Ben,
The fundamental premise of man-caused climate change is that the radiative greenhouse effect makes the surface of the earth 33 C warmer with an atmosphere than without an atmosphere, i.e. 288 K with minus 255 K without. What follows explains how that is simply not possible.
First off, the 15 C, 288 K, global average is a wild ass guesstimate pulled out of WMO’s butt.
The 255 K is the S-B BB calculated temperature of the net 0.3 albedo in/out top of atmosphere average 240 W/m^2 needed to maintain a habitable balance. (1,368/4=342*.7=240 & 255 K) The 255 K has absolutely no meaningful connection (Apophenia -WUWT) with the surface 288 K.
Without an atmosphere the earth would be much like the moon, albedo 0.12, ToA average of 301 W/m^2 not 240 W/m^2 and 25% more net incoming heat. The equivalent S-B BB calculated temperature would be 270 K not 255 K. No atmosphere means no vegetation, water, snow, ice, oceans, clouds, etc. and no longer a 0.3 albedo.
But this ToA averaged model is simplistic and unrealistic.
Say the atmospheric earth is 308 K lit side, 268 K dark side, average 288 K, range 40 C.
Say the non-atmospheric earth is 388 K lit side, 188 K dark side, average remains 288 K, range 200 C.
Identical averages, but the first model is habitable, the second is not, a meaningless comparison.
Let’s look at reality.
ISR (incoming solar radiation)
1,368 W/m^2, 0.0 albedo, net 1,368 W/m^2, S-B BB temperature is 394 K, 121 C, 250 F. This is why the ISS has a pair of redundant ammonia refrigerant coolers, chillers, AC systems. Space is hot, not cold.
Without atmosphere, i.e. lunarific
1,368 W/m^2, 0.12 albedo, net 1,204 W/m^2, S-B BB temperature is 382 K, 109 C, 228.2 F, above boiling point of water.
With atmosphere, i.e. earthy
1,368 W/m^2, 0.3 albedo, net 957.6 W/m^2, S-B BB temperature is 360.5 K. 87.5 C, 189.5 F, below boiling point of water.
The without atmosphere is quite clearly 21.5 C hotter (382.0 – 360.5), NOT 33 C colder, than the with it atmosphere.
Without an atmosphere the earth will be much like the moon, blistering hot on the lit side, bitter cold on the dark and most certainly NOT the average 255 K frozen ice ball that RGHE claims.
Nick Schroeder November 5, 2018 at 8:32 am
Actually it is total nonsense. Just as one does not heat a swimming pool with cold air, the oceans are not heated by our cold atmosphere/
The actual role of the atmosphere is to reduce the energy loss of the surface to space. With an average temperature of ~290K Earth would lose ~400 W/m^2 to space (no atmosphere). Due to the atmosphere Earth only loses ~240 W/m^2 what the sun nicely matches.
Question to answer is: how did the surface get to ~290K (average) in the first place.
Answer is: by cooling down from much higher temperatures. Young oceans were perhaps ~350K or hotter simply because they were sitting on (almost) bare magma.
Present sun only increases the temperature of the mixed surface layer of the oceans some 15K above the deep ocean temperature.
We need to realize that the temperature of the deep oceans is completely caused by geothermal energy, just as the continental crust is hot due to geothermal energy, in spite of the very low flux (~65 mW/m^2).
Mechanism is a bit more complicated since water can move around better than rock 😉
Ben,
“…290K Earth would lose ~400 W/m^2…” Absolute nonsense!!!!!
This is a theoretical “what if” S-B BB CALCULATION – K-T’s 289 K & 396 W/m^2 upwelling LWIR.
It!
Does!
Not!
Actually!
Exist!
It – is – not – even – measured!!!
https://www.linkedin.com/feed/update/urn:li:activity:6384689028054212608
Because of the contiguous participating media, i.e. molecules moving energy by non-radiative means, this 396 W/m^2 S-B BB upwelling LWIR is – not – possible. By K-T balance 63 W/m^2 leave the surface by LWIR for an emissivity of 0.16, 63/396. And, yes, that satisfies the text book definition of emissivity: actual/ideal.
Q = 1/R A dT determines the temperature difference between surface and ToA same as the insulated walls of a house.
Science expects experiments and data to back up a theory. Here are mine.
Experiments in the classical style:
https://principia-scientific.org/debunking-the-greenhouse-gas-theory-with-a-boiling-water-pot/
Nick Schroeder November 5, 2018 at 12:52 pm
Seems you missed the (no atmosphere) behind the part you quoted.
Actually the lunar surface on the day side pretty much radiates according SB in radiative balance with incoming solar (with a little lag) .
So Earth with a temperature of ~290K and NO atmosphere will lose ~400 W/m^2 directly to space. And obviously cool down very rapidly since the sun provides only ~240 W/m^2 .
Actual average temperatures on a rocky Earth without atmsophere should be slightly higher than the moons due to the higher rotation rate, but nowhere near the 255K.
Obviously with a very hot day side and a very cold night side.
Ben,
290 K & no atmosphere is not a possible combination. 290 K is with an atmosphere.
240W/m^2 is with a .3 albedo. 1,368/4 * .7
With no atmosphere the earth’s albedo would be lunarific at 0.12. 1,368/4 * .88 = 301 W/m^2 in/out balance and S-B BB equilib temp of 270 K.
400 W/m^2 is more than arrives from the sun, a rather egregious violation of conservation for energy. Not surprising since it’s a theoretical “what if” calculation and still not real.
Nick Schroeder November 6, 2018 at 7:39 am
Exactly the reason why I mentioned rapid cooling.
Thought experiment:
planet in outer space, covered with floor heating, perfectly insulated from the interior.
(let’s not worry where the energy comes from)
Apply 240 W/m^2 to the floor, temperature stabilizes around 255K when the surface loses 240 W/m^2 to space.
Apply 400 W/m^2, stabilizes at ~290K.
Now we pull an insulation layer around our planet that loses 240 W/m^2 at the outside to space. Power supply can be reduced to 240 W/m^2 to maintain the ~290K surface temperature indefinitely.
Same as our atmosphere does on Earth.
Ben,
“Now we pull an insulation layer around our planet that loses 240 W/m^2…”
Insulation doesn’t “lose” energy, it adjusts the temperature difference based on the energy flow rate.
Q = 1/R A dT
House insulation creates a temperature differential between inside and outside. Say the insulation is R-6 and the dT is 50 F, 70 F – 20 F at X Btu/h. If the insulation is doubled to R-12 and nothing done to reduce the heater output temperature goes to 140 F – 40 F. Of course the thermostat reduces heater output to 0.5 X Btu/h and cuts the gas bill.
If the insulation is removed dT goes straight to zero no matter the heat input.
The 400 W/m^2 still does not exist.
240 W/m^2 is with the 0.3 albedo.
Nick Schroeder November 6, 2018 at 5:58 pm
This insulation layer DOES lose energy directly to space. Obviously radiation is the only way.
To “lose” 240W/m^2 the temperature of the outside skin has to be 255K (em. 1.0)
The atmosphere does the same basically, only more complicated.
Earths surface radiates partly direct to space (atmospheric window).
By condensation, conduction and radiation it warms the atmosphere.
The atmosphere transports this energy around, and eventually radiates to space as well.
Total energy loss at TOA is (very) close to total input.
A Global annual change of temperature of 4 degrees for a TSI annual change of 90 W/m2 corresponds to 4/90 = 0.05 degree per Watt/m2, which for a solar cycle change of 1.5 W/m2 would give a solar cycle change of 0.07 degrees, consistent with the well-known dT/T = 0.25 dS/S (T=temp, S=TSI) which with dS/S = 0.1% gives dT = 0.00025*288 = 0.07 degrees.
Thank you, Leif.
Regards,
Bob
The Earth perihelion is in January – corresponding with a minimum Global Surface Temperature. Very counterintuitive. The GST peaks in the northern summer. Maybe the whole methodology is skewed to the northern hemisphere.
The correct way to represent absolute tempratures is Kelvin, not Centigrade.
The slope of your graphs will be even less.
The earth sees a 92 W/m^2 swing every year from perihelion to aphelion. Any given point on ToA sees a 700 W/m^2 seasonal swing summer to winter from the tilted axis.
W are 3.4 Btu/eng h or 3.6 kJ/SI h. Turn those swings into temperatures. 1.5 C is lost in the noise.
https://www.linkedin.com/feed/update/urn:li:activity:6369927560008212481
Bob,
Great essay . For many, many years I have shut down “doomsters” (seems calling them “believers” gets their panties in a twist) by simply calling attention that where I/we live the annual temperature varies from single digits (and occasional zero F) to usually mid 90’s F (with occasional 100F). That is a 90 – 100 F spread in only 6 months time! A little snide remark about crying ‘doomsday’ over a tenth of a degree per decade average increase and there is always an angry and confused expression on their face! Temper tantrums often follow for pointing that out. The “doomsters” (I like that term) are ‘cute’ when they’re mad! Putting things in perspective is always a winning punch.
@eyesonu — There are no winning punches. (Peterson threw a winning punch at Cathy Newman in her interview with him when he said “Sitting here talking with you is not all that comfortable. You are not all that agreeable. You got where you are by not being agreeable. You ask uncomfortable questions. How can you ask uncomfortable questions if you are forced to comply with ‘comfortable speech’ laws?”
Which he didn’t actually say. I am just too lazy to get the transcription. It is my attempt at repeating what I think I heard him say.
Ms. Newman actually stumbled at that point in the interview. For a brief second, it looked like she might have suddenly glimpsed what Peterson has been driving at. In subsequent interviews following that one, she reverted back.
Bob Tisdale does a great job of pointing out the things I have been trying to point out to friends and family. Some of those friends have demonstrated that they understand. They point to similar situations in different fields. Averages are your friend. AVERAGES WILL BITE YOU HARD and leave you realing on the floor wondering what happened.
Calculating based on the average will get you decent results. Attempting to calculate what the average will be in a coupled non-linear non 1st principles system. That is a set up for blowing up the calculation. It isn’t that 1st principles don’t apply. Heat transfer equations interact with fluid dynamics in dastardly ways and we still haven’t quite made them behave.
Can’t get away from averages. People who can’t express timidity around averages make me nervous.
Bob says:
“No results found for “How Much Do Global Surface Temperatures Cycle Annually?”
Remarkable, is it not, in these times of global warming interest?
You already know this (and prb’ly is part of your point), but the annual cycling disturbs the political-meme that the earth should be like a living room w/a single, unvarying temperature.
The swing in temperature was high during the beginning of 1900:
https://archive.org/details/glaciervariation00ahlm/page/22
During the winter it was -3 (1910) and +4(1930)
In Spitsbergen(part of Swalbard) with no sun present.
I guess the water content in the air has a part in this!
There must be a warmist answer to this. What is it?
Frog.
It’s the “balance.”
GHG’s disrupt the status quo steady state “balance.”
Nick – I don’t understand. Too vague.
Well, their argument is that the earth and climate are steady state, balanced, with just the “right” amount of GHGs and Goldilocks temperature. Increasing GHGs disturb that balance tipping the earth/climate towards disaster.
The answer is simple.
The GLOBAL change of 1.5 C or 2C wont happen everywhere. Some places will see less ( like the tropics)
and other places will see more, like the arctic. Location, Location, Location.
So lets take the arctic. Does Ice care about a +2C change in temperature? YUP, if that change drives temps from freezing to melting. Does permafrost care? Yup, its slowly disappearing. so the impacts of change in temperature will be regional. there will be regional winners and regional losers.
Take a city — like seoul where I live– that sees more and more hot days during the summer. temps go up 1 or 2C and we see more days with increased power prices. catastrophe ? Nope. but real nonetheless. Will every place see increased heat waves? nope, antartica wont. Will some places barely habitable become more uninhabitable? probably.
a couple degrees change in temps can also drive your snow related business. The added mositure in the air might bring you more snow in the winter and more lake effect snow, but the warmer temps in the spring will decrease the number of days you have with snow on the ground. If you are in a region that depends upon a long spring snow season, the snow definiately cares about a couple C. Does everyone live in a place like this? nope. does Your not caring about them, change their experience of earlier springs being bad for business? nope.
Globally, however, the increase in temperature will raise sea levels. Why? because water expands when it warms. And expands faster as a function of temperature. And the ice on land that also cares about a couple C in temp will melt contributing the sea level rise. Will all areas see the same level of sea level rise? Nope, some will see more, some will see less. In certain areas the sea level rise will mean nothing. In other areas it will not be a good thing. In some areas they wont care about a few inches, in other areas a few inches make a world of difference. Stupid humans building by the water.
so, in general nobody will see the 1.5C increase. some will see less, some will see a lot more.
Nobody will see exactly 1.5C.
Regionally, the impact will also vary. It will vary to the extent that your temperature sensitive processes ( farming, building, living) are close to change points. For example, if you were farming at the temperature extreme for a plant, 1.5C may have an impact. If your farming is limited by low temps, you may do better. Or suppose your buildings are built on permafrost and depend upon it always being frozen. Change of a couple C and your past building decision suddenly becomes stupid.
As it warms there will be winners and losers. It will depend on your region, and the temperature sensitive processess that support your lifestyle. Are your summers OK without air con? going forward that may change. Did you see a couple dangerously hot days this year? maybe that will increase.
Did last years King tides barely touch your property and flood your streets, 20 years, 30 years from now the new homeowner will probably experience the floods that just missed you. nevermind him, sucker born every minute
Bottom line. The damages from warming are not calculated at the global level. They are regional and local. There will be winners and losers, but losers will outnumber winners. Some folks will be safe and happy and wearing short sleeves in winters. Other’s not so lucky.
best of all most here will not live long enough to see the damage.
Steve,
Thanks for your detailed discussion.
And I thought that you lived in the Bay area.
No I live in Seoul, Beijing and Hong Kong, mostly Seoul
When you examine the hemispheres independently, the seasonal variability is far larger, moreover; few circulation currents cross the equator, so the hemispheres behave more or less independently. The net variability when adding the S hemisphere to the N hemisphere is not zero, as it would be for a symmetric Earth, because the p-p seasonal change in the N hemisphere is far larger than the p-p seasonal change in the S hemisphere, owing to the relative difference in land vs. water. Note that the global net temperature variability is opposite in phase to the 80 W/m^2 p-p orbital variability, while seasonal variability in both hemispheres is in lock step with the Sun, albeit delayed by a couple of months.
When I Google the phrase “How Much Do Global Surface Temperatures Cycle Annually?” I get a match – here:
https://wattsupwiththat.com/2018/11/05/do-doomsters-know-how-much-global-surface-temperatures-cycle-annually/
How Much Do air temperatures vary Annually? gets quite a few hits, besides all the NOAA/NACA/GISS anomaly graphs.
VERY interesting Bob, thanks!
About Figure 2:
Average Yearly Land Temperatures: around 8C
Average Yearly Ocean Temperatures: around 18C
Those numbers suggest that the average ocean (surface) is around 10 degrees warmer than the average land surface. We could conclude that Oceans are warming Land. But because more of the (colder) land surface is situated on the higher latitudes than on lower latitudes, the difference in latitudes could/will be one of the reasons.
I am interested in the average temperatures for (1) Land and (2) Oceans for specific latitudes. I am especially interested in 10S-10N (wet tropics), 30S-30N (tropics, subtropics) and 45S-45N (warmest half of all latitudes, most of the Earth’s surface area). But I could nowhere find maps or graphics showing this information. Perhaps you (Bob) could provide some insight?
The interesting question is what the role is that the oceans play in collecting the Sun’s energy. I know tropical oceans are the main absorbers on Earth but it will be interesting to see the numbers(!) for Land and Oceans for the different latitudes.
In the Sahara Desert it might go from 132 deg F to 32 deg F in less than 24 hours. And yet things live there. Actually, in places like the Sonoran or Mojave desert, life is more abundant than most people realize. I have come across desert springs that are alive with hummingbirds, honey bees, and various unidentified insects. Some of the biggest mule deer I have seen were bedded down in the shade in arroyos north of Phoenix.
And the alarmists are worried about a 1.3C increase in a century?
https://www.youtube.com/watch?v=r0l3tymEagc
Tony Heller’s latest video proves beyond the shadow of a doubt that 97% of climate science is fake. NOAA and NASA GISS should be charged with fraud and their top administrators jailed for treason.
https://climate.nasa.gov/scientific-consensus/
The NASA website has a graph that puts 5 different temperature datasets on a single graph from 1880 to 2017 or so (hard to tell what latest year is) . Of course all these datasets are fake because they have suppressed the warming of the 1930s. 3 other things stand out. 1) The data sets are almost exact matches of each other 2) One of the datasets is GISTEMP which includes water temperature data along with land air temperatures. 3) Another one of the datasets is called Cowtan and Way.
So I go to their website to find out what the heck is that dataset? Lo and behold I find this caveat on their website. I quote: “Maintaining a scientific data set to professional levels of quality assurance is beyond our resources. These results are therefore presented as a best effort. ”
So it seems that NASA will accept data submissions from private individuals even if you admit that you can’t keep the data up to professional standards. I guess this isnt too surprising in the climate science field when you realize that there isn’t any data standards in climate science. It is a wild west free for all of “HIDING THE DECLINE, JUXTAPOSING TEMPERATURE DATA FROM LAND STATIONS TO WILDERNESS AREAS 1000’S OF KM AWAY, USING PROXY DATA AND REAL DATA ON SAME TIMELINE IN A GRAPH, ADJUSTING TEMPERATURES DOWNWARDS 80 YEARS AGO SO THAT YOU CAN CLAIM AN INCREASE, USING 2 DIFFERENT TECHNIQUES TO MEASURE SEA RISE AND PUTTING THEM ON SAME TIME LINE, USING A BOGUS CONCEPT OF glacial isostatic adjustment TO ADJUST LAND LEVELS FOR SEA LEVEL MEASUREMENTS, MIXING SEA WATER TEMPERATURE DATASETS WITH LAND AIR TEMPERATURE DATASETS, FAILING TO COMPLETELY ACCOUNT FOR UHI EFFECTS, AND WHOLESALE READJUSTMENT OF TEMPERATURES 20 YEARS LATER FROM GRAPHS THAT WERE ORIGINALLY PUBLISHED TO PRESENT NEW FRAUDULENT GRAPHS. Did I leave any other climate science data fraud procedures out?
To think that billions of dollars are being spent on this fraud and because of this fraud boggles the mind.
They all also diminish the global cooling between the ’40s and the PDO flip of 1976/77.
The NWS site for Washington, DC, at Reagan National Airport, shows the normal annual temperature variation is 50° C. In 2017 the highest high reading was 97° F and the lowest low was 16° F, for a difference of 81° F or 50° C. In 2018 the range will be larger, as the lowest low (so far) was 4° F, while the highest high reading again was 97° F.
So, an increase in the world average T of 2° C would not impact the Washington temperatures very much. In fact the lows are not as low as in the past and the highs are not as high (we used to have lows at 0° F or lower, and highs of 100° F or higher).
Data are in the graphs here: https://www.weather.gov/lwx/cliplot_monthly?site=KDCA They do need to be enlarged to get the exact extreme lows and highs for the green bars
The funny thing about the Dunning-Kruger effect is that the more one is convinced it applies to the other side, the more likely it is to apply to one’s self.
Yep. Dunning Kroeger is right in there with “Logical Fallacies”. Logical fallacies are things we should be highly aware of as we make arguments. We should never use them as arguments. We can use them as the starting point of the argument, but they are not the argument.
Inside the space of a comment on WUWT, we almost are forced to make some sort of logical fallacy, hoping that people reading can fill in the backstory without posting a dictionary entry for every word in our post.
The fallacy here is comparing short term variability with a long term drift.
Consider a function f(t)= A sin(t) + B t. Now if A >>B then over any small
time interval the system is dominated by the sin(t) term but the long term
evolution is dominated by the B t term. The same is true with the climate —
there is a large amount of noise and periodic variability to which we are adding
a small forcing term which is going to win out in the long term.
You, like IPPC are saying that the magnitude of short term variations don’t change over the long-term so it doesn’t matter. That’s a false assumption.
That is not what I am saying. Nor as far as I can tell is it what the IPCC are saying either —
since some models predict a greater increase in extreme weather events as the temperature
increases. What I am saying is that different effects operate on different timescales — the
day to night temperature variation in most places is larger than the average temperature difference between summer and winter but that doesn’t mean that the seasons are unimportant.
I’m saying you should not consider short term variations as having an insignificant effect on the long term rate of change. The short term variations are constantly changing, especially with respect to energy loss to space by radiation.
Thanks for your comment. However, as I noted for Washington, D.C., the value of A is getting smaller. It is not a constant.
Thanks, Bob, for yet another dose of common sense. This will, unfortunately, fly right over the heads of the Warmistas and Alarmists, as its sanity lies quite beyond their comprehension.
Here’s what googling “annual temperature cycle” turns up as a top entry:
http://www.physicalgeography.net/fundamentals/7l.html
For those who mistakenly think that periodic diurnal and annual cycles are somehow involved in climate change, this WUWT post may be enlightening. For those who recognize that those cycles are irrelevant to the “climate signal” and are deliberately removed to display that very-much-weaker signal, there’s nothing much new to see here.
The IPCC demands that we keep the global average temperature less than 1.5 degrees C above the average global pre-industrial temperature circa 1800-1850. But what was that average temperature? The chart above shows it was about 14 degrees C. Reportedly we are now about 1 degree C above that rather poorly defined temperature and seem to be doing just fine, but another 0.5 degree increase will be catastrophic?
Should climate databases be reporting both absolute temperatures as well as temperature anomalies. And what a does 1.5 degree C temperature anomaly convert to as an absolute temperature value?
It depends on the base period.
There are, broadly speaking, three approaches to estimating the ‘average’ temperature of a field ( like the earth)
1. Average all the samples over time and space. This method, used by Tony Heller, is know to create huge biases when the samples vary in time and space. For example, if your sample is at low latitudes in one time period and evolves to include higher latitudes at other time periods. Or if your sample has a few stations during warm periods and more stations during cooling periods. These biases are severe especially for the samples we have for the earth.
2. Designate a period of time ( 30 years) where your station count is maximized ( 1951-1980 or 1961 to 1990). Calculate a Normal for this period known as the baseline. Now, you have a mechanicsm that allows you to correct for the bias due to gaps in time sampling. Your results will be anomaly with reference to the base period.
3. Use regression Temperature = F(x,y,z, etc), where your parameters — x,y, z, p, d, q etc– allow you to estimate the absolute temperature as a function of position (lat lon) time ( season), elevation, and any other parameters that you can assemble.. distance to coast, land cover, etc.
This regression approach is the only one that gets you absolute temperatures. You can also then present this as anomalies from any base period you like.
IN general however the science only cares about the CHANGE in temperature.
Why is that?
Well lets take climate sensitivity and use Lewis and Curry as an example. What we want to know is how much the earth warms for increases in forcing. forcing increases can be due to anything.. the sun
GHGs… etc. We want to know what happens — Delta temperature change– if we increase forcing by say 3 watts. So we need to know the change in forcing (3 watts) and the change in temperature. Delta T. Absolute T doesnt matter for this fundamental property.
The sad fact remains that none of the three methods outlined here provides consistent, unbiased statistical estimates of the average value of the global surface integral of temperature–even in the absence of data corruption by UHI effects. In the quite widespread presence of such effects at met stations around the globe, any claim of unbiased estimation is scientifically scurrilous. You can’t make a silk purse out of a pig’s ear.
Do all three methods produce a minimum global temperature when the Earth is closest to the Sun, as stated in this post?
This notion that one “average” temperature represents the entire globe is an illusion/delusion.
Nick,
You dont understand what the average represents.
1. All global averages are actually spatial fields. First and foremost, spatial fields
2. These fields are integrated to give you a global expectation.
What EXACTLY is the global expecttation?
Its a prediction, a spatial prediction. It says this:
Take the global average X.
pick A random selection of places on the globe and sample them. y1, y2, ect
X is the best predictor ( smallest error) for this sample.
From the article: “It wasn’t long ago, the gloom-and-doomsters focused on a 2-deg C change in global surface temperatures from pre-industrial times, but the point in time at which we were predicted to reach that 2-deg C threshold of all-nasty-things-to-come must have been too far in the future for them, so they revised their focus to a 1.5 deg C change in global surface temperatures to bring it nearer in time.”
It looks to me like they lowered the catastrophic temperature change to 1.5C because the latest ECS estimates are hovering around 1.5C or lower. So they make it look like their estimates are still in the ballpark and still catastrophic, so they continue the narrative even as the ECS gets lower and lower.
Soon they will be telling us how dangerous a 1C increase would be.
There have been comments in other posts that the change in temperature isn’t important, it is the rate of change that matters, and we are “currently” experiencing an unprecedented rapid change in temperature. First, current temperature isn’t changing at an unprecedented rate. Even the “rapid” temperature change during the 1988-2001 (2002?) period was unprecedented if one doesn’t erase the 1930’s from the record.
However, diurnal and annual temperature change rates exceed any of the doomsters CAGW / CCC rates, and everything seems to survive just fine.
I am quite suprised by the non-existent annual cycle in overall sea surface temperatures in particular, in one of the graphics above. I have seen many people say that the anual cycle in atmospheric CO2 levels, which rises during half of the year and goes down the other half, was partially explained by Biosphere activity in the NH and partially by the changes in sea surface temperatures, which affect the solubility of CO2, therefore when the southern oceans are colder they absorb more CO2 than when they are warmer.
That explanation is obvioulsy at fault if the average temperature of the surface of the oceans worldwide does NOT experience a yearly cycle, meaning that the same ammount of CO2 that may be absorbed in some areas of the southern oceans must be being released in some others in the northern hemisphere. Which leads to the obvious conclussion that it is the BIOSPHERE activity alone which causes the anual cycle in atmospheric CO2 concentrations, as I have always believed. Which has VERY good implications.
Using Mauna Loa data one can verify that the ammount by which CO2 decreases in the half of the year when the Biosphere is absorbing it has remained stable since we measure it. Given that we are obviously emitting much more CO2 in those months than we did in the fifties in the same months, this means that the Biosphere absorbs more and more CO2 every year. We can expect that trend to continue.
Not mentioned enough is the effect of humidity . Here in dry humid wise South Australia , once one gets away from the coast , it can reach 40 C during a summers day, but at night go down to 15 C.
And what about a traveller from say Hobart the Capital of Tasmania in the South , to Cairns in the North of Queensland. Even in the winter the swing in temperature from snow in Hobart to the tropics of Cairns is big.
Marble Bar in the cenntre is even more of a variation n temperature
Should we apply to Canberra for permission to travel over such a dangerous level of temperature change, sarc. of course.
MJE
Are all historical temperature records now available online? For a long time, various researchers claimed their research as propritary even if public money was used to do the research. This is a statement regarding the Hadcrut data. Are there any data sets where this is not true still?
Access to weather station temperature records was often under formal or informal confidentiality agreements that restricted use of this raw data to academic purposes. From the 1990s onwards the unit received requests for this weather station temperature data from people who hoped to independently verify the impact of various adjustments, and after the UK Freedom of Information Act (FOIA) came into effect in 2005, there were Freedom of Information requests to the Climatic Research Unit for this raw data. On 12 August 2009 CRU announced that they were seeking permission to waive these restrictions, and on 24 November 2009 the university stated that over 95% of the CRU weather station temperature data set had already been available for several years, with the remainder to be released when permissions were obtained. In a decision announced on 27 July 2011 the Information Commissioner’s Office (ICO) required release of raw data even though permissions had not been obtained or in one instance had been refused, and on 27 July 2011 CRU announced[9] release of the raw temperature data not already in the public domain, with the exception of Poland which was outside the area covered by the FOIA request.
https://en.wikipedia.org/wiki/HadCRUT
Bob,
“If you have spreadsheets prepared that convert data from column form to table form and back from table to column again—as I do”
Can you share, hopefully it’s in excel.