Climatologist Dr. Roy Spencer has pointed out in his book,
“The most obvious way for warming to be caused naturally is for small, natural fluctuations in the circulation patterns of the atmosphere and ocean to result in a 1% or 2% decrease in global cloud cover. Clouds are the Earth’s sunshade, and if cloud cover changes for any reason, you have global warming — or global cooling.”
We continue that conversation with this entry from Paul Homewood.
We’ve been discussing the sudden rise in UK and European temperatures in the 1990s, and I was reminded about a study undertaken by Clive Best and Euan Mearns looking at the role of cloud cover four years ago:
Clouds have a net average cooling effect on the earth’s climate. Climate models assume that changes in cloud cover are a feedback response to CO2 warming. Is this assumption valid? Following a study with Euan Mearns showing a strong correlation in UK temperatures with clouds, we looked at the global effects of clouds by developing a combined cloud and CO2 forcing model to sudy how variations in both cloud cover [8] and CO2 [14] data affect global temperature anomalies between 1983 and 2008. The model as described below gives a good fit to HADCRUT4 data with a Transient Climate Response (TCR )= 1.6±0.3°C. The 17-year hiatus in warming can then be explained as resulting from a stabilization in global cloud cover since 1998. An excel spreadsheet implementing the model as described below can be downloaded from http://clivebest.com/GCC
The full post containing all of the detailed statistical analysis is here.
But this is the key graph:

Figure 1a showing the ISCCP global averaged monthly cloud cover from July 1983 to Dec 2008 over-laid in blue with Hadcrut4 monthly anomaly data. The fall in cloud cover coincides with a rapid rise in temperatures from 1983-1999. Thereafter the temperature and cloud trends have both flattened. The CO2 forcing from 1998 to 2008 increases by a further ~0.3 W/m2 which is evidence that changes in clouds are not a direct feedback to CO2 forcing.
In conclusion, natural cyclic change in global cloud cover has a greater impact on global average temperatures than CO2. There is little evidence of a direct feedback relationship between clouds and CO2. Based on satellite measurements of cloud cover (ISCCP), net cloud forcing (CERES) and CO2 levels (KEELING) we developed a model for predicting global temperatures. This results in a best-fit value for TCR = 1.4 ± 0.3°C. Summer cloud forcing has a larger effect in the northern hemisphere resulting in a lower TCR = 1.0 ± 0.3°C. Natural phenomena must influence clouds although the details remain unclear, although the CLOUD experiment has given hints that increased fluxes of cosmic rays may increase cloud seeding [19]. In conclusion, the gradual reduction in net cloud cover explains over 50% of global warming observed during the 80s and 90s, and the hiatus in warming since 1998 coincides with a stabilization of cloud forcing.
Why there was a decrease in cloud cover is another question of course.
In addition to Paul Homewood’ piece, we have this WUWT story from 2012:
Spencer’s posited 1-2% cloud cover variation found
A paper published last week finds that cloud cover over China significantly decreased during the period 1954-2005. This finding is in direct contradiction to the theory of man-made global warming which presumes that warming allegedly from CO2 ‘should’ cause an increase in water vapor and cloudiness. The authors also find the decrease in cloud cover was not related to man-made aerosols, and thus was likely a natural phenomenon, potentially a result of increased solar activity via the Svensmark theory or other mechanisms.
Someone will bring up that Joni Mitchell song, if I remember the right artist. The climate models don’t know clouds.
Climate models are also like rivers. You can skate away on them, but they will never bring you back to reality.
You can never step twice into the same climate model.
Try skating on the other side of the ice, if there is any.
Why isn’t the graph drawn in furlongs per fortnight?
Yep, it was phoney Joni on that song. Great song, though.
Though Joni Mitchell wrote (and sang) “Both Sides, Now”, I prefer the version by Judy Collins as I think she had a much better singing voice that Joni did.
I ran into Joni Mitchell shopping the produce section of the Pt. Dume, Malibu supermarket, c. 1989. Etiquette required not noticing her celebrity status, but she struck me as a very nice, shy person.
Julie Andrews and Carroll O’Connor were likewise who they were and are.
Please don’t get me started on their neighbors.
I remembered both the Mitchell and Judy Collins versions of the tune, and didn’t remember who the writer was for sure.
Tom,
Easily misunderstood. The more powerful singer Collins actually recorded it first, although written by Mitchell.
Send in the clouds…
Both Sides Now was in our repertoire back in the 70s when my wife & I performed at the Gypsy Market near Rice U in Houston.
As a climate alarmist might sing Both Sides Now: ‘I’ve look at clouds from both sides now, from up and down and still somehow, it’s carbon illusions I recall, I really don’t know clouds at all.’
https://www.google.at/search?q=joni+mitchell+clouds+illusions&oq=joni+Mitchell+clouds&aqs=chrome.
Why there was a decrease in cloud cover is another question of course.</i
While at the same time the cosmic ray intensity has increased…
Lief, if I may, I think this is how you meant your comment to appear. (I hope!)
Why there was a decrease in cloud cover is another question of course.
While at the same time the cosmic ray intensity has increased…
yep
You might consider that no one claimed clouds are formed immediately in large formations, re cosmic rays, unless you think the planet is merely a ball with an atmosphere that is static.
Your quip is rather unscientific, and not for the first time.
Cosmic rays have an input, but do we have enough data for a knockout study? No, we dont even have a reliable temperature record for 80 years.. let alone anything else.
no one claimed clouds are formed immediately in large formations, re cosmic rays,
Svensmark [among others] did…
He did?
I’m pretty sure Svensmark would only have suggested that for cases where clouds would form except there aren’t any aerosols and that would be a rare situation in the extreme.
Any relation to cloud chambers?
Is anyone old enough to remember them?
cheers
Using either the peaks 1965 to 1998, or the lows 1968 to 1991 the Cosmic Rays were on a decreasing trend.
http://neutronm.bartol.udel.edu/modplot.html
What is of interest is the time since 1980 to today. Using either lows or highs or means, the cosmic ray count has been increasing, as it should because solar activity as been decreasing.
Regardless, temps have increased, contrary to the cosmic ray theory for climate, fundamentally falsifying it.
Leif writes
Falsifying it? As what, the one and only driver of climate?
Some clouds trap energy some reflect it back, the net effect is cooling, but a net effect of less cooling than before doesn’t necessarily mean cosmic ray created clouds didn’t increase even if global coverage declined.
Thinking is hard sometimes I know, but try
As near as I can tell, the only difference between being sandblasted by “galactic” bags of quarks, and “solar” bags of quarks; is the net charge balancing presence of stripped electrons accompanying the nuclei in the solar wind.
Why the electrons do not also accompany the nuclei in the galactic blast is, not entirely clear to me, but a plausible explanation might be that the greater distance travelled by the galactics and the large differences in mass between electrons and nuclei.
Leif,
Only slightly since the 1980s, unless the Lebedev GCR data are for some reason suspect, despite a spike in the early ’90s:
https://galprop.stanford.edu/elibrary/icrc/2011/papers/SH3.2/icrc0285.pdf
Also that reference only goes to 2010. So if GCR flux has continued growing in this decade, you’re right.
My take is that clean air laws in the developed world led to less aerosol pollution after the ’70s and following the fall of the USSR in the ’90s, hence fewer man-made cloud condensation nuclei. Now India and China are reversing that trend.
Lower solar cycles of late aren’t IMO yet sufficiently weaker materially to affect cosmic ray flux, although it has, as Leif observes, increased, however slightly. Unless, as I said, the current weak cycle has let in even more GCRs.
Interesting proposition, testable too.
WX,
Hey, it’s all about the scientific method, my brother!
Not a testable prediction, not science.
Just to add to that, there was also a mid-1980s series of papers and claims about Scandinavian and Canadian ‘acid-lakes’ from sulfur output (acid rain), which led laws to reduce sulfur particulate output from hydrocarbon burning. At that time there was a lot of pop-science periodical speculation about possible impacts on cloud and rain-drop nucleation processes.
It’s a delicious potential, as a reduction in hydrocarbon burning indirectly creates warming, which is indirectly … anthropogenic … nice. 😉
Also that reference only goes to 2010. So if GCR flux has continued growing in this decade, you’re right.

It has…
Thanks!
Will bookmark that.
Looks as if GCR flux peaked in 2010 however, while still above the 1980s.
PS: Prior peak appears to have been 1988, but close during the ’90s.
John,
Tony Phillips of NASA is all about the CR flux. Check it out at http://www.spaceweather.com
That isn’t a very new idea
I’ve bookmarked this site around 2007/2008
Likewise cloud cover change driven by the North Atlantic Oscillation has driven Greenland temperatures and ice melt.
Chylek et al observed a cooling trend in Greenland from 1940 to 2000 that he suspected was due to clouds. Read: Chylek_(2004) “Global warming and the Greenland Ice Sheet”_
The warming and reduced cloud cover from the 1990s to 2012 was associated with the North Atlantic Oscillation as puiblished in Hofer_(2017) “Decreasing cloud cover drives the recent mass loss on the Greenland Ice Sheet”_
The past two summers have seen Greenland regain much snowpack. The SSTs west of there are anomalously cold, as well as the inland waters of northeastern Canada at this time. I am optimistic that the arctic sea ice “death spiral” is being halted as of late.
Sorry, regain should be retain>.
That is why I pointed out that more wavy jets at a time of quiet sun would produce more clouds than less wavy jets at a time of more active sun.
Wavier jets create longer lines of air mass mixing and thus more clouds.
Much more likely than the Svensmark cosmic ray hypothesis>
http://joannenova.com.au/2015/01/is-the-sun-driving-ozone-and-changing-the-climate/
Why either-or? Surely it should be “and”: jet waviness and GCRs and ocean oscillations and ……
NB. Each works in its own way and on its own timescale, and they might not combine linearly.
Yes. This is what I can’t stand – the assertion that every inconsistency regarding ONE given theory “debunks” it, when none of the factors in question operates in a vacuum. It is the COMBINED effect of ALL the different factors that produces what we experience as “climate.”
I believe the terms you’re looking for are zonal (less wavy) and meridional (more wavy)
The freezing level intrusion in a N-S axis at around 10,000 ft depicts the same pattern and is perhaps even more relevant to the surface WX and cloud cover.
Same location and time:
10,000 ft freezing level intrusion
https://www.windy.com/-Temperature-temp?700h,temp,2018-11-08-00,38.686,-75.938,3,i:pressurehttps://www.windy.com/-Temperature-temp?700h,temp,2018-11-09-00,38.686,-75.938,3,i:pressure
Clouds
https://www.windy.com/-Clouds-clouds?700h,clouds,38.686,-75.938,3,i:pressure
Jetstream
https://www.windy.com/?250h,38.686,-75.938,3,i:pressure
To me this is just additional evidence that those who claim to understand the world’s climate do not understand near as much about it as they claim. It is further evidence that they should be ignored until they are able to obtain more understanding.
The problem with so many that I talk with is that they absolutely refuse to consider any evidence which might contradict what they already believe. I have had people refuse to look at the NOAA webpage even.
The saying “Don’t confuse me with the facts, my mind is made up” is true.
They are of the Left. They are not analytical. They believe in striving for “good” and against “evil. They believe they always wear the white hat. If they ever entertain any doubts they keep them private because to disagree with the monolith of received Leftist thought would mean excommunication.
Their economic policies have failed in every country in which they’ve been tried and yet we continue down that economic path. Is Trump a conservative? With a trillion dollar deficit? During a strong economic expansion?
Their social policies are almost as bad, resulting in an epidemic of drugs, teen pregnancy and a broken education system. And yet the paradigm of Leftist social approaches persists.
Och John . . . . I’m guessing that errr . . your mind is made up about that? All leftists are not analytical? Or just some? All rightists are analytical? Or just some? Evidence? I’m probably what you’d call a leftist because I believe that the most successful economies/civilised societies combine the best elements of the market with the best elements of collectivism, ie those elements which work – or at least their governments try to, though the war of ideas between the defenders of those two polarised positions ( market v collectivist) never lets up.
And yet, my mind is not made up, except to the extent that I believe we don’t have enough evidence either way to justfiy acceptance or rejection of CAGW, and that therefore scepticism is justified from both sides. I think that only the future can answer the big unanswered questions, though I’m not very optimistic about that either, because we humans tend to over estimate our knowledge and abilities, and underestimate our ignorance – or so it seems to me – and that, if I’m right, behoves us to keep our minds open and to be very strict indeed/sceptical about what we believe about anything. In other words, every time we get the urge to make a statement we believe is true, we should stop and reconsider very carefully. I genuinely believe that!!
As for cloud cover being a significant factor in the debate, I certainly think it merits very close examination, though I believe there’s been work ongoing concerning cloud cover for some time. Integrating that knowledge effectively into the bigger picture of all the drivers of climate change is a very hard problem though, partly because it’s very likely that we’re not aware of all of them and don’t fully understand all of those we are aware of.
And though I’ve read thousands of pages of climate science related material in pursuit of a better understanding, and ploughed my way though a large number of brilliant comments on here (as well as less than brilliant comments by many alt rightists whose minds were/are very firmly made up – not hard to find!), as well as elsewhere, my mind is very far from made up. In the meantime I try to do the right thing, as I’m sure you do too. It seems very likely to me that the great majority of us try to be good humans, wherever we stand on the ideological spectrum, even though the idea of what’s good isn’t nearly as clear as we’d like it to be either.
You can’t fly a plane from out on the wings. You must stay centered in a watercraft to avoid capsizing it. That also applies to public policy (IMHO as an old fart).
Your humbly and clearly expressed position makes perfect sense to me Mr Piasa.
Can someone please explain what’s going on with the clouds today? I can’t find an answer besides “contrails/chemtrails”. Are they blanketing the earth to block the sun, or not?
Is the earth currently trending cooling or heating? Thank you…
Depends upon from when you start.
Good thing that we’re enjoying an interglacial, a relatively warmer interval in the increasingly frigid glacial epochs under which Earth has suffered for more than 30 million years.
Earth has cooled for at least the past 3000 years, and probably 5000.
It has warmed for over 300 years, since the depths of the Little Ice Age during the Maunder Minimum.
Based upon US data, it has cooled since the 1930s, and definitely did dramatically globally from c. 1945 to 1976-77, when the Pacific Decadal Oscillation switched mode. Then a slight warming trend kicked in for about 20 years, which mild trend was then replaced by the “Pause” in global warming.
The troposphere has cooled since February 2016, when the 2015-16 Super El Nino peaked.
It’s just as humanly arrogant to think we can control global cloud cover as it is to believe we control global temperature by adding part of the one extra molecule of CO2 in 10K molecules of atmosphere we have observed since 310 ppm CO2 was the statu quo.
Clouds are merely the visual manifestation of the presence of liquid water. The dry vapour water is not observed.
Incoming radiation meeting liquid water as in clouds gets absorbed and converted to latent heat at constant temperature which drives the now dry vapour upwards for dissipation potentially into space.
A reduction in cloud cover will therefore inevitably result in more radiation being absorbed by the dry vapour with an increase in temperature result, based on the specific heat.
It seems that the data tends to confirm this.
CO2 doesn’t get a lookin here.
Note: At phase change the Plank coefficient “K” is zero. ( ie in the presence of liquid as in clouds) In the dry vapour phase the coefficient is a positive number ; but I do not know what it is. Hence the difference. – I could go on here; but will desist!
Clouds are quite effective at reflecting the Sun’s shortwave back to outer space, by a bigger amount than the dry vapour absorption of IR that you mention.
and that is why the effects of cloud are very complex.
and the cloud type is important.
Back in 2011 l noticed there was a link between annual sunshine hours and annual mean temps in the UK since 1929. l only wish there was also data on trends in wind direction in the UK over that time as well.
Because l suspect that the changes in the trends of sunshine hours and wind direction. Account for much of the warming seen over that time in the UK.
Also “average terrestrial wind speed has decreased by 0.5 kilometres per hour (0.3 miles per hour) every decade, according to data starting in the 1960s.”
https://horizon-magazine.eu/article/what-happens-world-dying-winds.html
There are lots of clues of what is happening besides CO2 going up.
A warmer world is a less windy world.
Or perhaps a less windy world is a warmer world.
I vividly remember watching St Louis TV news in the late 80’s, and Karen Foss bragging that STL had as many sunny days a year as Los Angeles.
Certainly not that way any more.
(Sure miss the edit option, Godspeed Anthony et al in restoring the site.)
It is disturbing to see some folks making the mistake of comparing a forcing directly with earth temperature.
A forcing, i.e. TSI, a proxy such as SSN anomaly or, in this case, cloud cover, is a power thing while temperature change of a body with effective thermal capacitance is an energy thing. It is conceptually invalid to compare power to energy. To get an energy thing from a forcing (for legitimate comparison) it is necessary to account for the amount of time spent at each activity level. That, of course, is accomplished by taking the integral of the anomaly from some reference level. Another example of this type of mistake made by SS is shown here: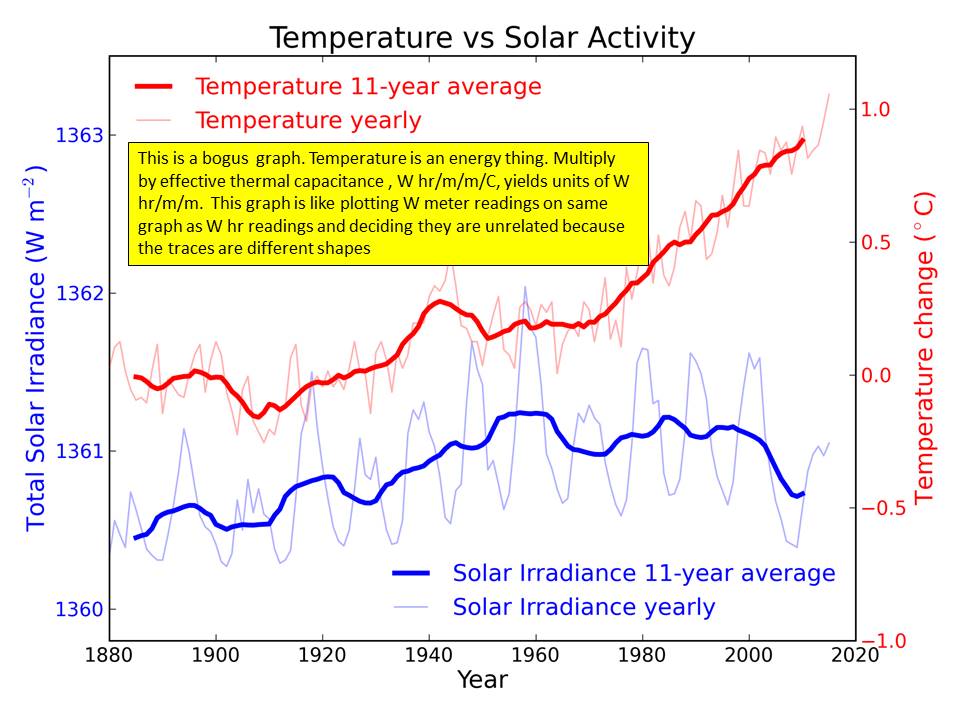
“Clouds have a net average cooling effect on the earth’s climate. ”
It’s hard to say and the heating from incremental absorption and redirection back to the surface is about the same as the cooling from incremental reflection. Sometimes it’s more and sometimes it’s less. For example, incremental clouds over ice and snow can only warm the planet since there’s no compensating cooling from an increase in albedo.
I am fascinated by the increase in both the amounts of Polar Stratospheric Clouds, and the length of their seasons of late. To me that’s an indication of extra water vapor at all atmospheric levels (even with the depressed polar tropopause). Extra high clouds during summer have kept the TSI lower and temperatures normal or below, while clouds during the winter always hold heat because there is essentially no sunlight to reflect. This and its causal humidity (enthalpy) prevents the winter temperatures from getting as much below freezing as they would under the dryer conditions during cold AMOs.
When both the PDO and AMO are negative, there will be a steady increase in ice for a while and they will tell us that carbon caused that too.
It is very important to look at this region (which has obviously had the most historical influence on the “global temperature”) in its proper perspective, and remember that the warming this planet has experienced statistically has almost exclusively occurred at sub-zero temperatures during the depths of the yearly cycle.
” … exclusively occurred at sub-zero temperatures”
This depends on whether you’re measuring it as a fractional increase in emissions or a fractional increase in temperature. Owing to the 1/T^4 dependency between W/m^2 and degrees K, the temperature increase causing 1 W/m^2 more emissions starting from 270K is 0.22K, while the temperature increase from 1 W/m^2 starting from 310K is only 0.15K. The climate system is relatively linear when its various attributes are quantified exclusively in Joules per second.
It happens that the small slice of the planet at the boundary between summer surface melt and permanent ice cover is also the only part of the planet affected by the albedo changes from melting surface ice. The decrease in albedo increases the average incident power, increasing the temperature without actually changing the underlying sensitivity.
Huh.? “Hard to say”….Look at it from outer space, the albedo of cloud is .5 to .6 average and the albedo of soil, forest, and ocean is less than .1, so clouds have a strong effect.
Albedo of 0.47 for clouds and 0.03 for everything else works pretty well as shown at http://lowaltitudeclouds.blogspot.com
DMacKensie,
Clouds also increase atmospheric absorption by a significant amount, about half of which gets re-radiated back to the surface from clouds. Looking from space, the power emitted by the planet above clouds is far less than above clear skies. Not only do clouds attenuate the net incident energy from the Sun, they attenuate the net radiant energy emitted by the surface. This is why cloud tops appear so much colder from space than the surface below.
Also, as I said before, incremental clouds over ice and snow have little to no incremental reflection. New fallen snow is even more reflective than clouds reversing the albedo effect!
When I try to separate the net cooling effect of clouds from their net warming effect based on full coverage weather satellite data, the global averages seem close enough to offsetting each other, that perfectly offsetting each other is well within the uncertainty of the data. This is why I can’t say for sure whether the net effect from incremental clouds is warming or cooling. It can just as likely be a zero net effect. None the less, what I can say for sure is that there’s a causal relationship between the amount of clouds and the optimum energy balance, even though balance can be achieved with any amount of clouds.
My reply to Co2isnotevil who says: (Nov 3 1.14 pm): “ Clouds also increase radiation absorption, half of which is re radiated back to the surface” (or words to that effect).
This is not correct as most of the radiation absorbed by clouds gets converted into Latent heat at constant temperature and the resulting dry vapour is driven upwards by buoyancy for dissipation as ice crystals in the cirrus clouds. This is not strictly true as the incipient dry vapour also in the cloud does increase in temperature and thus does re radiate to earth.
It is a balance.
The overall result is a strong negative response/feedback to any increase in radiation or purported Greenhouse effect.
Because WV below the clouds absorbs a lot, and the WV gradiant biases it back up again, only the IR in the wavelength range of the atmospheric window gets all the way to the ground.
“… only the IR in the wavelength range of the atmospheric window …”
Not exactly and the same is true for IR leaving the planet. If a GHG molecule emits an absorption band photon and is close enough to the surface (or space), that photon will get to the surface (or space) before it’s absorbed by another GHG molecule. Among the things that can cause a GHG molecule to emit a photon are the absorption of another photon, a collision with another molecule or it can spontaneously emit a photon and return to a lower state.
In the GHG bands observed at TOA, the total energy is about half of what it would be without GHG’s and is not zero as it would be if energy only left through the transparent window. It’s a little less in the 13u band (about 40%) and the difference from 50% represents what was ‘thermalized’ as water droplets absorb energized GHG molecules.
Note that the first GHG molecule that absorbed a photon emitted by the surface is close enough that the eventual photon emission as the molecule returns to a lower energy state has a significant probability of returning right back to the surface.
Co – I considered most of that and decided to keep it simple because IMO it’s close enough. According to MODTRAN6, TOA flux is closer to 57% lower at 15µ than it would be with no ghg.
Click my name for a lot more to the story in section 5 of my blog/analysis.
Alasdair,
Latent heat has nothing to do with the absorption and re-radiation of LWIR by clouds. Latent heat enters clouds as water vapor and leaves them as liquid water that’s warmer than it would be otherwise. Within a cloud the cycle of evaporation/condensation certainly exists, but relative to the energy state, it’s a zero sum effect. While liquid can also radiate and theoretically, latent heat can become radiant heat, in LTE, the liquid water in the clouds must be absorbing the same amount of energy that it’s emitting.
co2isnotevil: Thanks for your response. Appreciated. However I must take issue on what you say.
You say that “ Latent Heat has nothing to do with absorption and re-radiation of LWR by clouds” NOT true I’m afraid; being only true if the cloud consisted entirely of dry vapor possessed of the Latent Heat. The problem here being that the cloud would not be visible so it could be construed that it therefore didn’t exist.
Solar and terrestrial radiation provide the energy which is converted into Latent Heat in the liquid water to initiate phase change and this is done at constant temperature; so this energy does not get re-radiated but is used by way of buoyancy to drive the now dry vapor upwards for later dissipation and conversion to potential energy. Where there is insufficient energy input to balance dissipation to the surrounding atmosphere condensation occurs and results in rain/snow/hail etc. This can occur in the lower levels of a thick (say cumulus) cloud where solar radiation is absorbed by the upper levels.
Understanding clouds purely by radiative means is difficult as at phase change of water the coefficient “K” in the Plank Equation is zero since the change occurs at constant temperature; so radiative balances get skewed. However if the changing elements in the enthalpies are considered a better understanding may be found.
As an example your last paragraph is again not true as the radiation of liquid water remains the same although it is absorbing considerable radiation at phase change; since the temperature remains constant.
An interesting discussion here. Would like your views.
My regards
Alasdair
Alasdair,
You’re falling into the trap laid by Trenberth where he arbitrarily conflates the energy transported by photons with the energy transported by matter when considering the radiant balance. Latent heat is not radiant in origin.
Latent heat rising into the atmosphere from the surface, plus the return of offsetting energy to the surface, has a NET zero effect on the energy balance at the surface. That is, whatever effect these have on the surface temperature and its BB emissions is already accounted for by the surface temperature and its BB emissions (this is the same for thermals). The NET energy leaving the surface and entering the atmosphere is strictly limited to the BB emissions of the surface at its average temperature.
The energy driving weather originates from latent heat and what is not returned to the surface as rain is returned to the surface as the kinetic energy of weather. The energy emerges when water condenses in a cloud and suddenly receives the potential energy of liquid water lifted against the force of gravity, which it didn’t have as vapor. The origin of this potential energy is the latent heat which we know is tangible as we can extract this as hydroelectric power, but it’s definitely not in the form of photons.
I’m not trying to understand clouds by radiant means, but am trying to understand the atmosphere by the NET radiant properties at its boundaries.. The boundary with space is trivial receiving and emitting only W/m^2 of photons that must be equal to each other in the steady state. The boundary with the surface is what Trenberth obfuscated. This is the NET radiation from the surface which must be equal to the NET input to the surface from the Sun and atmosphere, above and beyond any replacement of the non radiant energy entering the atmosphere.
Note that non radiant energy entering the atmosphere can only be returned to the surface, as only radiant energy can leave the planet. To the extent that the water in clouds radiate Joules that were non radiant in the past, it just offsets the otherwise required radiant emissions and that radiation otherwise destined for space is, was or will be returned to the surface instead.
Sorry co2isnotevil. My kettle disagrees with you, as do the Steam Tables.
Latent Heat HAS a source or origin in radiant or other energy. It is merely a different manifestation of the enthalpy involved.
My kettle converts this radiant/other energy into Latent Heat and pumps this out of the spout to eventually arrive on the windows where it condenses by radiative dissipation. This all, for the kettle, at constant temperature and thus constant BB radiation.
Similarly, as per the Steam Tables: One kilogram of water evaporated from the surface contains roughly 680 WattHrs of Latent Heat, generated by radiation. Similarly this Latent Heat is pumped up into the clouds and beyond where it is dissipated or converted to other enthalpies such as Potential etc. thereby causing condensation. The liquid water then returns to earth roughly at the same temperature and enthalpy it had prior to evaporation. (OK let’s not get pedantic here!). All in all, in equilibrium, the Latent Heat dissipated equals the original source of the radiant/other received; but in practice hunts wildly about this balance, and is subject to other influences. Thereby, it may be said that every kilogram of rain has dissipated some 680 WattHrs of energy into the atmosphere and beyond, with not much effect on the surface temperature.
In practice there are endless examples of this in the real world. we sweat to keep cool, we cool our engines with this process. I could go on; but suffice to say that it all depends on the simple fact that, for water, the Plank Coefficient (aka. sensitivity) is Zero at phase change. A fact that is a major fly in the ointment of the IPCC radiative logic. (I could expand on that if you so wish; but somewhat off thread.)
Our two perspectives are very interesting. Mine being in terms of enthalpy and yours in radiation. Perhaps the two may resolve their differences someday?
My regards
Alasdair.
Alasdair,
I understand exactly what you’re saying, but you’re missing some crucial points which makes what you’re saying irrelevant to the radiant balance.
First is that clouds store energy as the conversion of latent heat into gravitational potential energy and visa versa. Energy is energy and heat is just one form. The gravitational potential energy must come from somewhere and the only possible source is latent heat unless you can accept violating COE. Don’t be confused by the ‘heat’ in latent heat, as it’s more properly considered latent energy. The only heating that results occurs as water condenses at the top of a cloud and falls through the cloud, heated by air friction until it evaporates once more and the cycle starts again.
The second point is that the conversion between the energy transported by matter and the energy transported by photons is highly constrained by the laws of physics and Trenberth’s trick of arbitrarily conflating them doesn’t represent reality as the energy transported by matter between the surface and atmosphere is balanced independently of the energy transported by photons across the same boundary. This arises because in the steady state, the energy absorbed by matter is equal to the energy emitted by matter, thus there is no NET exchange and relative to long term change, all that matters is the steady state. Any net exchange would imply that the water in clouds is either heating or cooling without bound and this is clearly not the case.
Finally, you don’t seem to see that I’m quantifying the atmosphere based on its BULK radiant behavior which is unique per its state. Sure, there are all sorts of complexities within, but they have no relevance to the analysis if the bulk behavior can be predicted based on the radiant behavior at the boundaries and it most definitely can be predicted.
Far too many people are overwhelmed by the apparent complexity which is the precise reason that the consensus has added so much noise to the analysis. You must take a step back and look at the bulk, macroscopic behavior of the planet as this is wholly predictable without consideration for the pedantic low level details so many are so obsessed about.
co2isnotevil:
We have a problem here as you don’t appear to be very acquainted with the thermodynamics of water and the Rankine Cycle which is not easy to explain just in comments.
However: The Latent Heat in the clouds comes from the radiation input and is only found in the dry vapor. A small amount of this energy goes into potential energy. (only about 35 WattHrs per kilogram at the tropopause). The rest is dissipated, partly into the surroundings and partly into the liquid water. However, during the process the cloud continues to receive radiation. Eventually the Latent heat is consumed and condensation occurs. This taking place at various altitudes. This process takes place at constant temperature where the Planck Coefficient (sensitivity***) is Zero. Meanwhile large enthalpies are transported upwards, some of which gets radiated into space. This being evident since the ice crystals at the tropopause grow which shows that they are losing energy.
Descending water/ice picks up pressure, enthalpy and velocity and arrives at the surface roughly in the same state before it evaporated. As in the Rankine Cycle.
Overall it is a non radiative upward transport of enthalpy which I suggest should not be dismissed as irrelevant.
I agree that ultimately in global terms the equilibrium state is determined by the balance between incoming and outgoing radiation; taken at the top of the atmosphere. The result however being very much dependent on the processes described above, with surface radiation being merely an energy input along with insolation.
***: Ignoring this Zero Planck coefficient in the radiative calculations can lead to suspect conclusions.
Alasdair,
Latent heat entering the atmosphere only originates from the surface and as you point out, the water returns in the same state as it was before it was evaporated. In other words, the latent heat is returned as liquid rain accelerated by gravity and doesn’t contribute to the radiant balance. Non radiant transport through the atmosphere don’t contribute to the balance either and only act to redistribute energy within the atmosphere (or a cloud). While clouds continuously absorb radiation, they are also emitting it in equal parts. Otherwise, they would warm or cool without bound.
What you’re referring to as latent heat in the cloud is part of a continuing cycle which is offset by condensation within the cloud. It’s origin is still from water changing from a liquid to a gas which only got to the cloud in the first place as a gas, so the vapor had to condense first, giving up its latent heat to the water droplet it condensed upon, only to re-acquire it back upon subsequent evaporation, cooling the same water droplet it had earlier heated. In principle, the latent heat stays with the water and is temporarily stored in clouds.
I think it’s also important to separate the process from the requirement. The reason is that the atmosphere has many processes with many degrees of freedom for getting to a steady state where degrees of freedom by definition don’t constrain what that steady state will be.
Hi! co2 etc.
I think here you need to look at the steam tables.
Liquid water does NOT possess Latent Heat (evap); so your second sentence is incorrect. Your first sentence is also incorrect as the Latent Heat is generated at the surface by both surface heat AND insolation.
The resultant cloud, as a vapour, is a mix of liquid and vapor. ( here I use the terms “vapour” as the mix and “vapor” as the gaseous form).
The Latent Heat (LH) only being attached to the vapor but not the liquid.
As the cloud rises, due to the buoyancy of the vapor, energy is both received and dissipated. The balance of which determines the ratio of the mix, leading to either condensation or further increase in the LH or vapor.
Eventually at some point the LH is dissipated leading to ice or liquid forming to the extent that gravity returns the water to earth; but with no LH. just velocity and internal energy.
The overall cycle thus ensures that the LH generated throughout the upward movement is dissipated at various altitudes and finally at the tropopause into space. The return journey back to earth ensures finally that NO Latent Heat arrives at the surface.
The steam tables are quite clear about this for at the start and finish of the cycle the enthalpy of the water is more or less the same; albeit that energy has been put into and removed from the system during the cycle.
In rough terms some 680 WattHrs/Kg of water is removed from the surface and dissipated throughout the atmosphere and space during the cycle.
I submit that pure radiation calculations have difficulty in explaining the above unless it is understood that at the phase change of water the Plank Equation coefficient is Zero. It matters little whether the source of the energy is from insolation or by upwelling surface radiation; for the energy received does not result in a temperature rise at phase change.
Generally I totally agree that the energy movements in a cloud structure are very complex as the energy morphs, as it were, from one state to another at a micro level. For instance at evaporation a buoyancy force is generated which translates into potential energy should movement occur. What one can say, however is that in a cloud there is a tendency for the vapor(gas) to rise with its LH and for the liquid to fall without any LH. A physical process separate from radiative transfers.
Drought years raise the temperature and less cloud cover. At allIndia level 2002 and 2009 were drought years with 0.81 and 0.78% of average rainfall. The temperature raised by 0.7 and 0.9 oC.
In the case of northeast Brazil, I found a clear cut relationship between cube root of rainfall and evaporation and global solar radiation. Also published a paper on relationship between cloud cover and bright hours of Sunshine. All these indicate one thing that with the reducing cloud cover, radiation goes up and thus temperature follow it. These studies were published in 80s.
Dr. S. Jeevananda Reddy
As there is a link between rainfall and cloud cover, when rainfall presents a cyclic variation, so also follow the cloud cover. If below the average cycle period sometimes coincide at global scale. This may cause low clouds and thus high temperature.
sjreddy
Dr. Reddy, your findings have synchronicities with my solar cycle work.
The conditions you described for drought are prevalent during solar minima. For example hot daytime temperatures from high UVI during low solar energy solar minimum clearer skies, as we experienced in the SW US in 2018 (and elsewhere).
Is your work online?
Bob — sorry they are not online but they were published in Journals. Some you can find in Solar Energy Journal of USA.
Dr. S. Jeevananda Reddy
“Why there was a decrease in cloud cover during this time is another question of course.”
The Svensmark Effect postulates that during strong solar cycles, solar winds increase, which block Galactic Cosmic Rays (GCS), which leads to fewer cloud seeds being formed in the lower troposphere (GCS nucleate inorganic compounds in the lower troposphere to form cloud seeds) and decreased cloud cover and warming global temperatures.
Moreover, the strongest 63-year string of solar cycles in 11,400 years occurred from 1933~1996 (Solanki et al), which can easily explain much of 20th century warming.
From 1976~1996, the 2nd and 3rd strongest back-to-back solar cycles in 1,000’s of years occurred, which could explain why cloud cover decreased during this time and why global temperatures rose.
In addition, from 1978~2008, the PDO was in its 30-yr warm cycle, which contributed to global warming, as did the 30-year AMO Warm cycle from 1990.
From 1996 to the present, solar cycles started to fall, which explains why cloud cover increased and led to flat/cooling global temperatures.. The 97/98 and 2015/16 Super El Niños explain the spikes in global temp since 1996.
From the early 2020’s, a 50-yr Grand Solar Minimum event is expected to start, and the PDO, AMO and NAO will all be in there respective 30-yr cool cycles. All these concurrent cooling events should lead to falling global temps, which CAGW advocates will have a very difficult time to expain away, and may finally disconfirm once and for all the stupid CAGW hypothesis.
We’ll see soon enough.
My self-authored aphorism is that global climate depends on the sun, the ways oceans run, and clouds (in complexity) forming. 🌞+💧+☁🌦🌧🌤🌫…
If Henrik Svensmark lives long enough (suggest, another 15 years) he will receive a Nobel Prize.
Svensmark has had 20 years to construct a viable climate model useful for short to long term predictions, and he hasn’t, nor his followers.
In contrast it took me just over a year to accomplish this and make good predictions too, based on the real driver of the climate, TSI. TSI is to fire, as cosmic rays are to smoke.
Like the CO2 theory, his theory is well-known and popular, but does that make it right?
The hysterical claims from the IPCC that we MUST cut CO2 emissions to zero NOW to prevent temperatures rising by 0.5C suggests to me that they are very well aware that we are entering a cooling period.
An additional 0.5C won’t take us up the the warm and very benign temperatures that allowed mankind to make the huge advances in Civilisation that we saw in the Minoan, Roman and Medieval Warm Periods when temperatures were up hot 3 reg Warmer than today.
That fact alone destroys their argument, but sadly too few reporters or general public know about these earlier Warm Periods and are just sucked in by this latest deception.
Why are we assuming that clouds cause temperature? Could we not assume that temperature causes clouds?
Would warmer temperatures result in reduced relative humidity and therefore fewer clouds?
Bob,
It’s complicated, as must be the case in Earth’s WX and climate system.
Warmer water means more evporation, hence more water vapor in the air, which all things being equal, should lead to more clouds and more rain. But evaporation also causes cooling and air temperature affects the formation of droplets and clouds.
But in general, warmer is wetter, on a water world. Glacial phases are cold, dry and windy. Interglacials are relatively warmer, wetter and milder. But not everywhere.
John
And the increase in Antarctic ice sheet depth comes from???
Higher evaporation from tropical latitudes increases the rate, volume of vapour and air movement towards the poles.
There are many factors.
Regards
CB, the oceans have been very warm near the Arctic. The increased evaporation raises the enthalpy of the atmosphere. It’s not warmer were talking about, it’s “less frigid”.
Extra clouds would cool the globe during the day whilst night time clouds would ‘warm’ the globe
Yes, but the part of the globe which recieves no sunlight during winter would always warm, from any clouds at any altitude (as well as from ocean-generated atmospheric enthalpy).
Make that warm ocean generated enthalpy…
The planet is still releasing heat at the pole, just more slowly (due to nature’s built-in damping).
Hopefully it will ease the onset of any cooling.
Pop Piasa – ” but the part of the globe which receives no sunlight during winter would always warm”
‘Warm’ as a verb implies gaining heat, but if there is no sunlight what is the source of this additional heat. Do you mean that it cools at a slower pace?
In the 1970’s and 1980’s massive coastal CA fog would come in all the way to cover the entire Central Valley. There would be car wrecks of 100 cars at a time on I-5 from fog with visibility of just 20 feet. That is gone, and so most likely the Central Valley is a much drier and warmer place. So not just cloud cover, but ground fog affects regional temperatures. CA coastal fog is driven by upwelling water along the coast.
Important to hear Svensmark’s comment on Kirkby’s CLOUD Cern experiment : they physically simulated initial aerosol production and using their hpc cloud simulated the growth for their results.
Contrast is , Svensmark physically followed the process.
So again like the IPCC, computer models were foisted.
Svensmark here from 03.2018 : https://www.youtube.com/watch?v=iFlNS2PX4yI
from 47:50 . Models v. Physics.
I’ll try again to display this. Too good to pass over.
I got a kick out of the secretary getting up and going home in the background. So academia!
So the entirety of the “signal” can literally be because of the increased surface oil coverage on the Oceans.
Great.
Warmists are so stupid.
Are we sure which comes first?
Chicken or egg?
Warming or cloud cover reduction?
chicken/egg is just stages in a process.
Sometimes Causality is less helpful as a notion than it appears.
if feedback implies that today is caused by yesterday, but in fact will also tend to create yesterdays conditions, you have – in the case of simple systems – cyclicity – or in the case of complex systems, chaotic quasi periodic movement around one or more attractors.
Causality is really a way of saying that partial differential equations with respect to time have meaning in the real world. Are accurate models
The problem is that integrating them over time is in most cases beyond the simple, massively complex.
Its the car crash scenario. no one denies that the law of physics governing a car crash do not apply, so it should be simple to work out where every part of the car ends up and in what condition.
But it isn’t, is it?
Climate is like one car crash after another. A complete pile up of wreckage in terms of weather events all of which affect the climate today and create the climate of tomorrow.
Clouds are just some of the debris. For sure I think Svensmark has something, but it not clear cut – any more than the CO2 signature is…
We understand climate, and weather, to be the unfolding of processes that are emergent properties of the earth and sea (surface) and lower atmosphere. We try to model these processes in terns of underlying natural Law, and Causality, which is, restated, the proposition that there are time invariant partial differential equations that can usefully be integrated to predict parts of the future. That we can do conventional science on them and it will be effective in producing predictions that can be verified or refuted.
But I maintain that in fact we cant do those integrations to a level of accuracy that makes them functionally effective. That is, even if the science has got decent partials to start from it isn’t enough, and that in effect climate science as it is now being practiced cannot work as we hope it will.
This is a class of problem though that is outside my pay grade. Its the sort of problem the likes of Godel and Turing worked on. To see where mathematics itself runs out of steam, And with it, its practical application in science.
Wouldn’t it be a bust if some smart mathematician took one look at climate science and thought for a year, and wrote a paper saying ; “actually, that approach will never work, and can never work”.
Extending the life cycle of chickens back to Prime Causes is a dodgy business.
It behooves us to remember Korzybski – “The map is not the territory” – and all the models we use to describe the world – and causality is one of them – are not intrinsic properties of the world, but of our description of it, our map.
Perhaps Chickens, Eggs and climate are like the Tao – “That which exists through itself
I.e. its a self causing entity.
Personally I think that climate science is far too difficult a problem for climate scientists.They should tackle a more simple phenomenon, like which balls are going to come up in next weeks lottery.
by developing a combined cloud and CO2 forcing model to sudy how variations in both cloud cover [8] and C –>
by developing a combined cloud and CO2 forcing model to -study- how variations in both cloud cover [8] and C
We should not be debating 10’ths of a degree. The records just are not that good. Let us not debase ourselves.
Moon
Earth as we know it exists because there are 3 phases of water and a favourable interplay of other factors such as distance from the sun, shielding from cosmic rays, etc.
Earth has been around and full of life for so long because of water. It is a given that there would have been a runaway climate some time in the past if the Earth had not been buffered against major change. The actions of water are part of the control mechanism that keeps Planet Earth in a happy zone. Cloud coverage is part of this.
Some people think in terms of a feedback mechanism, or a governor mechanism that prevents excursions. Some control mechanism require specification of a set point that is there to identify excursions and cause the system to try to get back to the set point. Such set points have often involved temperature as the critical variable in which the set point is defined, but there are others like rotational velocity that can be too fast or slow, as in an auto cruise control; and there are many other examples of styles of control.
Understandably, since the better historic data types are about atmospheric air temperature, this has had a lot of analysis when there is a chance that other parameters are more fruitful. Cloud cover might be one, insolation at ground level might be another, the spectral distribution of radiation might be yet another. We seem to lack long records of variables like these. There is some agreement that cloud effects are the most lacking field of study in climate models.
Maybe there should be more research about why the global climate is what it has been and is now, rather than what it might become. Is there a climate set point?
Geoff
No surprise that more clouds = cooling, less clouds = warming. Just walk outside on a sunny day and you’ll feel it.
As for the reason.. since the 60’s in particular here in Queensland, large areas of trees are cleared to be replaced with pastures/cropping.
A tree is basically just a massive pump that pumps water from deep underground into the air.
You remove the pumps, you remove the moisture in the air. Therefore the clouds.
Evaporation alone can only add so much moisture to the air by evaporating the top surface of the ground.. Which dries out quickly. There’s also ocean evaporation, but how much finds its way back over land would depend on the wind.
Please correct me if I’m wrong.
Goes without saying, but I doubt the decrease in cloudiness has got anything to do with carbon dioxide.
Stephen W
Just walk outside on a cloudless night and you’ll feel the exact opposite: no clouds to block outgoing radiation results in cooler temperatures at night. Where clouds are present nights are warmer. It’s a balance. You’re only counting one side of the scale.
Yes, I suppose you’re right, clouds do maintain some warmth at night.
But when a cloudy day maximum is 25, the minimum might be 21.
On a sunny day at least where I live, the maximum might be 35+, the minimum is not going swing equally the other way and be 10 degrees. More like 20degrees.
(talking Celcius here).
Stephen
One of the key factors regarding ocean heat loss by evaporation is the adsorbent capacity of the atmosphere passing.
It is assumed that this process is 100% efficient at all times at all locations. It is not. If it was temperatures would be lower.
Regards
I’m having difficulty finding the ISCCP global averaged monthly cloud cover data (my computer can’t open any of the data from the links), but the claim that ‘temperature has flattened’ since 1999 is just nonsense, even using the coolest of the surface data sets, HadCRUT4, as this author does.
http://www.woodfortrees.org/graph/hadcrut4gl/from:1983/to:2009/plot/hadcrut4gl/from:2009/plot/hadcrut4gl/from:2009/trend
Above is HadCRUT4 from 1983 (per the chart) with the period since 1999 shown in green. Sorry, but that is not a ‘flattening’, it’s statistically significant warming at a rate of 0.163 ±0.098 °C/decade (2σ); so if cloud cover has ‘flattened’ since 1999, then that more or less puts paid to this theory (and perhaps explains why the data in the chart stops in June 2008, more than 10 years ago!).
Sorry, wrong chart (that one is from 2008, when the chart data stops, which is even faster, at 0.3 C dec). Here is HadCRUT4 from 1983 with the so-called ‘flat’ period since 1999 in green: http://www.woodfortrees.org/graph/hadcrut4gl/from:1983/to:1999/plot/hadcrut4gl/from:1999/plot/hadcrut4gl/from:1999/trend
This was discussed in my 2014 paper “Late twentieth-century warming and Variations in Cloud Cover”, available free of charge at http://www.scirp.org/journal/PaperInformation.aspx?PaperID=50837.
Now IIRC, a month or two later Dr Roy Spencer published a guest piece on his blog saying that I’d got it wrong regards the change in cloud cover.
(Also, pay attention to the first part of the paper that shows ENSO changes can account for the historical global average temperature anomaly pattern from 1950 to 1987. So what if there’s a change in the dominant factor regards climate. To me it’s more absurd that a single factor gets blamed for all warming, regardless of whether it’s a period of a sharp upward trend or a period of a negligible warming trend.)
My mistake. It wasn’t a guest post that criticized my paper, it was a reader’s comment. My apologies to Dr Spencer if he felt that my comment above implied that it was of his doing.
Does anyone know of a study about Earth’s radiation to space in relation to reduced solar wind and reduced particles in space during extreme solar minimums? I tried a couple of quick searches, but didn’t find anything on this subject.
Love this discussion – its like watching some tortured creature writhing in a less-than-sweet torture or agony.
It simply will not venture anywhere near Dirt. Probably like in the time of Galileo and the Earth-centric model and how the religious establishment tried every which way to keep the Sun rotating around Earth.
So we have cosmic rays, oil on the water, this oscillation (no explanation of what causes it), *that* oscillation (again no cause is mentioned)
And of course the “Climate Is Always Changing”, usual used against Warmists as a way of avoiding further discussion – all the while not realising that saying that implies the existence of A God or Gaia. No wonder they’re driven nuts by Skeptix – the only possible retort to such a statement and Avoidance of The Issue is the Ad-Hom
If you want clouds, you need water.
Over the ocean, this is not a problem.
Over the land, it certainly can be.
Water exists (existed) over the land in many places and forms. There may be ponds, lakes, (peat) bogs, moors (Muirs), Carrs (peat bogs with trees)
Also there are plants, especially stands of trees, visible on the surface but for every ton of tree sticking up alive and well, there will (or SHOULD) be at least 10 tons of dead tree in the top 2 or 3 three feet of soil.
Likewise for grassland areas.
We know about that. We heard it from scientists researching Permafrost in Arctica and how it going to melt and create a(nother) Climate Catastrophe by turning into carbonoxide.
As any gardener or horticulturist will know (even a pot-plant on the windowsill will suffice), this dead (and alive) organic stuff retains water. It is after all made of water – one carbon atom to one water molecule and water has huuuuuge affinity for itself.
So far so good – lets venture out across the countryside and look for it. Remember, we’re looking for a layer of stuff like the Permafrost but not frozen solid.
But its not there is it.
And where are all the lakes and inland seas. We know they were there, just look at the roadside signposts and the names of the towns and villages.
Places with mere, moor, sey (sea) or Carr in their names. Places called Fen, previously underwater peat bogs
Where are they. All gone.
Why have they all gone?
To feed the people. Some televisual muppet popped up recently, in a repeat of an old documentary, to inform us that World Population had doubled in his lifetime. He was NOT a decrepit old f4rt with a stick in a wheelchair. Probably = 10 years less than me
It is the feeding of those people that has disappeared huge amounts of inland water resource and with has gone the clouds it would have craeted, with or without the help of Comsic Rayz, Milankovitch, endless oscillations ro dreaming notions that clouds somehow ‘shield’ you from The Cold.
What a crazy warped notion. Cold places are empty places, How do you ‘shield yourself’ from nothing. What sort of emanations come from ‘nothingness’
Of course it goes right back to childhood and the idea of someone/thing called Jack Frost – that he descended from cold clear skies and somehow made everything ‘frosty’
I used to believe that as a kid – I would put water filled glass jars and bottles out for him to play with.
Anyway, get the drift?
All these oscillations, oil-on-the-water, radiation rays and “Climate Always Changes” are *really* pathetic excuses to avoid the charge that Man, in the shape of (modern) farming has changed the water content of vast areas of land.
This has changed the clouds and set thermometers twitching.
Really really simple but NOBODY wants to go there do they because of the charges that will be levelled against them and THEY KNOW IT.
Its called Chickening Out. Sometimes = Appeasement.
A variation on Positive Feedback, something that NEVER has a happy ending.
But yes, it is one very tough nut to crack.
No matter, as long as the barley yield per acre or in total is still increasing, All Must Be Well With The World.
Or in fact also the yields of noxious & nutrient free starch, production of which dries out the dirt and creates deserts. An experiment that’s been repeated dozens of times through human history and what any Real Farmer will tell you
Deserts = Cold Places.
And *there* is something else the religious & School teachers & preachers have got All Wrong.
Hell is not a Hot Place as they assert,
Hell is a Cold Place
Not just farmers, city planners, builders and dwellers.
Recall: *every* year ‘we’ need at least 6 cities the size of London to accommodate New Arrivals
No matter, Cosmic Rays will ensure the weather in the city centre stays the same as it was inside the forest/grassland that was there previously.
We know that because a (super) computer adjusted itself and told us so.
And who is gonna argue with any computer, super or otherwise?
Or A Sputnik for that matter…..
There appears to be some problems with the ISCCP cloud cover dataset.
Identified in studies listed here…..
https://agwobserver.wordpress.com/2010/01/20/isccp-problems/
“The apparent decrease in global cloud cover has also been used as an argument against anthropogenic warming (but mainly outside of scientific literature). But when the sources of these arguments are consulted, almost without exception we run into ISCCP cloud cover data being used as the source. In the following, I will show you why it is false to claim global cloud cover trends based on ISCCP data.”
“It seems that the finding of Norris, Campbell, and Evan et al. about ISCCP satellite viewing angle (by changes in satellite network that affect the viewing angles) creating a spurious trend is a real problem. I think they have shown it beyond reasonable doubt. ISCCP website lists known and fixed errors in ISCCP data but there doesn’t seem to be any mention of this problem.
Many studies have made conclusions relating to clouds based on the apparent long term decrease in ISCCP data, but all that research is in doubt because the trend at least partly is not real. Furthermore, ISCCP cloud data is the longest satellite record we have on the subject, so it would be important to issue an official correction to this problem. When the trend is corrected, interesting things might be found, as shown by Clement et al. (2009) who corrected for the problem and found that cloud feedback is positive. As a long record, ISCCP data would be suitable to that kind of studies.”
The ISCCP website lists various problems and their corrections. See https://isccp.giss.nasa.gov/errors.html.
Of course you could have emailed Bill Rossow and asked him rather than just claimed that problems might exist.
I’ve been saying since this 2010 on the BBC blogs and at WUWT in 2012 https://wattsupwiththat.com/2012/08/20/spencers-cloud-hypothesis-confirmed/#comment-884789
Seems to me whilst Pinker stated she did not think cloud cover was responsible for rising temperatures, her 2005 paper clearly showed the link.
Observations: large areas of the ocean surface are smoothed by oil and surfactant pollution.
: En-route to Madeira a large smooth with meandering arms covered thousands of
square miles, with the smoothed areas resisting wave breaking up to force 4.
: https://seawifs.gsfc.nasa.gov/OCEAN_PLANET/HTML/peril_oil_pollution.html
An astonishing amount of oil is spilled every year.
: Tiny amounts of oil smooth large areas. (See Benjamin Franklin, Clapham Pond.
: The Mediterranean Sea is smoothed all along the Costa del Sol.
Conjecture: Fewer breaking waves reduces salt aerosol production
: Reduced mixing alters nutrient levels and disrupts the phytoplankton balance. Less
DMS production, fewer aerosols.
: Low nutrient tips phytoplankton populations towards more C4 and C4-like carbon
fixation. Reduced discrimination between C12 and C13, relatively more C13 pulled
down, a light carbon signature left in the atmosphere.
Predictions: Enclosed and polluted area of ocean – e.g. Med, North Sea, possibly Great Lakes
etc – will exhibit more surface warming than open ocean far from pollution sources.
: Diatom populations will persist later in the season
: Arctic ocean areas exposed to rivers flowing through oil production areas will exhibit
anomalous warming.
Observation: Until we research other causes of warming the pseudoscientists of the IPCC will continue to win.
JF
Again, is it a coincidence that Earth’s temperatures are bounded with a similar convergence as this curve?
The temperature of the equatorial Pacific area increased.

Please see
https://tambonthongchai.com/2018/11/02/spurious-correlations-in-time-series-data/
My theory on this is that clouds coverage reduces in response to increased CO2. Since it seems that if Ps/Pi is golden (1.618035), then the total fraction of surface emissions absorbed by the atmosphere can only be 2/(1 + g), where g is the golden ratio.
Since this ratio wants to be constant and increases CO2 increases absorption without clouds, fewer clouds are required to set absorption to what it wants to be. BTW, a small downward trend in cloud cover is also observed in the ISCCP cloud data.
The verdict is still out on Svensmark theory. The low average value solar parameters have just kicked in over this past year .
There has been no further global warming for the past two years ,still the big one for me is what overall oceanic sea surface temperatures do. That is the KEY, and thus far they are NOT cooling. That said they also have not made any further warming gains
It is wait and see.
That global cloud cover is a dominant modulating factor for GSAT should be apparent from first principles. This dictum also finds solid empirical support in the high coherence between local temperature anomalies and sunshine hours experienced at various well-run met stations around the globe. Without additional analysis Figure 1a, however, falls well short of providing strong evidence for this relationship. The overlying “plateaus” since ~175 months seem more a matter of graphic scaling than of demonstrated physical relationship.
Accumulating affects of clean air acts of 60’s, 70’s, 80’s in the west coupled with westerly winds reduce the amount of sulphate / particles in the northern hemisphere and then consequently reduce cloud nucleation of the water vapour carried alongside.
Could be. London stopped having “pea soup” fogs after coal was banned as a fuel for heating in London. A similar situation with other cities, so I’m told.
We clean up the air and more sunlight gets through. What a surprise (not)?
” Make hay while the sun shines”