
Guest Opinion: Dr. Tim Ball
A fascinating 2006 paper by Essex, McKitrick, and Andresen asked, “Does a Global Temperature Exist.” Their introduction sets the scene,
It arises from projecting a sampling of the fluctuating temperature field of the Earth onto a single number (e.g. [3], [4]) at discrete monthly or annual intervals. Proponents claim that this statistic represents a measurement of the annual global temperature to an accuracy of ±0.05 ◦C (see [5]). Moreover, they presume that small changes in it, up or down, have direct and unequivocal physical meaning.
The word “sampling” is important because, statistically, a sample has to be representative of a population. There is no way that a sampling of the “fluctuating temperature field of the Earth,” is possible. This problem of sample size is central to so much of what has gone wrong with climatology since the modelers took over. An early example was the 30-year normal. The original purpose was to provide a sample climate period for people like me reconstructing historical weather and climate record to use for comparisons. Gradually, it was adopted and adapted as the base for daily comparisons. We were told that it was the warmest or coldest day on record when they were only using the most recent 30-year normal. 30 years was chosen because in general statistics it is a valid sample size for a population. That has no relevance to weather and climate of the 4.5 billion years of the Earth’s existence. Part of the proof of this is that the 30-year normal period continually changes. We were told this was done because of more and better records. The reality is we have fewer stations now than in 1960 as NASA GISS explain (Figure 1a, # of stations and 1b, Coverage).


Not only that, but the accuracy is terrible. US stations are supposedly the best in the world but as Anthony Watt’s project showed, only 7.9% of them achieve better than a 1°C accuracy. Look at the quote above. It says the temperature statistic is accurate to ±0.05°C. In fact, for most of the 406 years when instrumental measures of temperature were available (1612), they were incapable of yielding measurements better than 0.5°C.
The coverage numbers (1b) are meaningless because there are only weather stations for about 15% of the Earth’s surface. There are virtually no stations for
- 70% of the world that is oceans,
- 20% of the land surface that are mountains,
- 20% of the land surface that is forest,
- 19% of the land surface that is desert and,
- 19% of the land surface that is grassland.
The result is we have inadequate measures in terms of the equipment and how it fits the historic record, combined with a wholly inadequate spatial sample. The inadequacies are acknowledged by the creation of the claim by NASA GISS and all promoters of anthropogenic global warming (AGW) that a station is representative of a 1200 km radius region. I plotted an illustrative example on a map of North America (Figure 2).

Figure 2
Notice that the claim for the station in eastern North America includes the subarctic climate of southern James Bay and the subtropical climate of the Carolinas.
However, it doesn’t end there because this is only a meaningless temperature measured in a Stevenson Screen between 1.25 m and 2 m above the surface. Figure 3 shows the average range of daily temperatures at different levels between 2.5 cm and 17m above the surface. The curve for 1.2 m is important because that includes where most plants and animals exist a region known as the biosphere. It is the zone most critical to agriculture, yet all they get is information above it.

Figure 3: Source: Oliver and Hidore, After Geiger 1950.
The Stevenson Screen data is inadequate for any meaningful analysis or as the basis of a mathematical computer model in this one sliver of the atmosphere, but there is even less as you go down or up. The models create a surface grid that becomes cubes as you move up. The number of squares in the grid varies with the naïve belief that a smaller grid improves the models. It would if there was adequate data, but that doesn’t exist. The number of cubes is determined by the number of layers used. Again, theoretically, more layers would yield better results, but it doesn’t matter because there are virtually no spatial or temporal data.
These layers are a result of the laminar flow that occurs in gases and liquids. However, the problems become worse when that flow is disturbed, and it becomes turbulent flow. Essex and McKitrick provide the best understandable explanation of the problems this creates for climate theory and climate models in their 2002 book Taken By Storm (revised edition). Turbulence is the reason the Intergovernmental Panel on Climate Change (IPCC) Scientific Section of Third IPCC Assessment Report, (2001) titled “Predictability in a Chaotic System” are forced to say;
“In sum, a strategy must recognise what is possible. In climate research and modelling, we should recognise that we are dealing with a coupled non-linear chaotic system, and therefore that the long-term prediction of future climate states is not possible” (My emphasis)
I know from four different areas of my career about the variability of the layers in the atmosphere and the oceans. The first involved detecting Soviet submarines in the North Atlantic. One of the techniques involved detecting engine and other sounds emanating from the submarine and transmitted through the water. You determine the layers in the water by dropping a thermometer down from the surface measuring water temperature with depth (a bathythermograph). It was remarkable how many layers existed and how they changed over time. I was also surprised by the number of inversion layers, that is an increase of temperature with depth. This work and computer models only consider the surface of the oceans. That all falls within the friction layer of the oceans, which extends down to approximately 1000 m.
Beyond that, the layers are more clearly defined because laminar flow dominates. However, even in these layers the height at which you sample can yield very different results because the circulation is completely different in space and time on a global scale. The deep ocean circulation below the friction layer has cold water descending at the Poles and ascending at the Equator. I understand that some of these circulations can take thousands of years to complete. This means you can have energy stored in the current that is not added back into the atmosphere for a long time; it belies the insanity of a 30-year normal.
The second experience involved flying long distances at lower altitudes, that is below 10,000 feet. In other words, we were always in the frictional layer of the atmosphere, which varies, but on average extends up to 1000 m. We took a page from Benjamin Franklin’s navigation book. He directed the US Postal Service ships to Europe to sail on the north side of the Gulf Stream and North Atlantic Drift going east and on the south side to avoid it going west. We flew what we called pressure pattern navigation, that is a similar pattern because the wind patterns cause the ocean currents (Gyre). Again, the level of optimum winds varied all the time, so you could not predetermine the level. Instead, we began with the forecast winds, which were invariably wrong, and found the optimum level once airborne.
Above the atmospheric friction layer, the temperature is mostly laminar, but even here differences within a layer are important. We saw this during the exploitation of the so-called ozone hole. The ozone layer spans from 10 to 17 km above the surface to 50km, which means it spans from the troposphere to the stratosphere, but only at the Equator because the Troposphere only extends to 10 km over the Poles in summer. This is why diagrams as in Figure 4 are inaccurate.

Figure 4
The reports were measurements of ozone from a selected layer. While there was a depletion in that layer, amounts were increasing in other levels. It didn’t matter because there was no evidence of CFCs affecting the ozone at any level within the layer. Indeed, when the speculation began, there was little knowledge about the all-important polar stratospheric clouds or as they were then known Noctilucent clouds.
The third experience involved the use of a 1000 ft radio tower just outside Winnipeg. We installed basic weather stations every 200 feet up the tower and recorded in real time (this is important for most users of weather data and is rarely available). Again, the number of layers and their change over time was remarkable with inversions occurring more frequently than expected. Each station at each level recorded distinctly different measures, and all of them varied from the official weather station at Winnipeg airport about 10 km away.
The fourth involved measurements to determine the pattern of the urban heat island effect (UHIE) in Winnipeg. Centered in an isotropic plain, it was an ideal place for such studies. We measured the spatial pattern of the UHIE but also tried to determine its profile. We did this comparing our surface with the tower data but also with instruments on high buildings in the city. The major finding was that the bubble of the UHIE was low, on average 300 m, but more importantly that the bubble shifted with wind patterns. This meant that you could not automatically apply a UHIE correction factor to Winnipeg Airport data. The Effect existed consistently but only affected the airport data under certain wind conditions. We also found that there was a distinct circulation pattern within the UHIE bubble as air rose in the warmest area went to the top of the bubble and diverged out and down into the suburbs like a mini convective cell. This was important for patterns of pollutant transfer, which we also studied by measuring their levels across the entire city.
So far, I have talked about the inadequacy of the temperature measurements in light of the two- and three-dimensional complexities of the atmosphere and oceans. However, one source identifies the most important variables for the models used as the basis for energy and environmental policies across the world.
“Sophisticated models, like Coupled General Circulation Models, combine many processes to portray the entire climate system. The most important components of these models are the atmosphere (including air temperature, moisture and precipitation levels, and storms); the oceans (measurements such as ocean temperature, salinity levels, and circulation patterns); terrestrial processes (including carbon absorption, forests, and storage of soil moisture); and the cryosphere (both sea ice and glaciers on land). A successful climate model must not only accurately represent all of these individual components, but also show how they interact with each other.”
The last line is critical and yet impossible. The temperature data is the best we have, and yet it is completely inadequate in every way. Pick any of the variables listed, and you find there is virtually no data. The answer to the question, “what are we really measuring,” is virtually nothing, and what we measure is not relevant to anything related to the dynamics of the atmosphere or oceans.
The IPCC Assessment Report 5 says the following in the Summary for Policymakers of the Physical Science Report.
Observations of the climate system are based on direct measurements and remote sensing from satellites and other platforms. Global-scale observations from the instrumental era began in the mid-19th century for temperature and other variables, with more comprehensive and diverse sets of observations available for the period 1950 onwards. Paleoclimate reconstructions extend some records back hundreds to millions of years. Together, they provide a comprehensive view of the variability and long-term changes in the atmosphere, the ocean, the cryosphere, and the land surface.
The first and last sentences are false. There are very few direct measurements, and the ones that exist are only representative of an extremely short period of time in a very limited area that is not even representative of the small area in which it was taken. Satellite data only covers from at best 1970 onward and in most cases, including temperature, does not provide global coverage. Again, from AR5, the surface temperature record, which has the best of inadequate records yields these results.
· The globally averaged combined land and ocean surface temperature data as calculated by a linear trend, show a warming of 0.85 [0.65 to 1.06] °C3, over the period 1880 to 2012, when multiple independently produced datasets exist. The total increase between the average of the 1850–1900 period and the 2003–2012 period is 0.78 [0.72 to 0.85] °C, based on the single longest dataset available4 (see Figure SPM.1). {2.4}
So, the best they can produce is an increase of 0.85°C, over 132 years with an error range of 0.20 below the average and 0.21°C above the average. As I understand, this is an error range of ±24%. But, they already admitted the data is of little value until 1950, which is less than half (62 years) of the period of record. Apparently, this is why they can only claim a discernible human impact from CO2 after 1950.
The reality is weather forecasting has not improved despite all the satellite and computer models: witness the most recent failures with hurricanes Florence and Michael. The other reality is that climate forecasting has deteriorated. Think what could be done with the trillions of dollars spent on computer models, government weather agencies, useless research, and unnecessary energy and environment policies based on their failed work. Why didn’t they spend this money on creating power grids and buildings capable of withstanding hurricanes? Every time there is a hurricane or even a mid-latitude cyclone, the power grid fails. That is just one small example of what could and should be done instead of this delusion that we are measuring the right things and somehow, we will eventually be able to forecast the weather and climate.
Ironically, all of this goes on because fossil fuels have created wealth, security, and better quality of life in every aspect of life across the world. The insanity this creates is that the IPCC wants to punish those nations who pioneered this advancement in the human situation and improvement in the human condition and deny similar opportunities to other nations by denying them the use of fossil fuels. Of course, they do all this from their fossil fueled corporate palaces in cities protected from the realities of the real world like Geneva, Washington, New York, and London. When will somebody stop this madness?
1. Actual temperature records.
2. Natural temperatures
3. Anthropogenic effects.
Where are the graphs for 2 of the above?
They aren’t published, which is more than telling.
Given you know 2, you can calculate the other.
Given the current claims, what you then find is natural temperature change and variation has stopped, with no evidence for a cause
nhsgp9 – October 14, 2018 at 11:08 am
“DUH”, …… GETTA clue, ……. are not “Actual (near-surface) temperature” the same as “Natural (near-surface) temperatures”?
And there is no way in ell one could create a scientifically accurate graph of the, …. per se, ….. Anthropogenic temperature effects on the actual temperatures and/or natural temperatures.
You can’t graph an entity (anthropogenic effect) ….. iffen you can ‘t measure or count it.
I think he is critical of the idea you can say its been anthropogenic from assumption 2 is dead flat all of sudden. Needs a bit of work but a good way to get through to the sheeple.
The only way to get number 2, “natural temperatures” would be to have a second earth, completely identical to the current one, but with no humans.
Until that is provided, even trying to consider “natural temperature” is a fools errand.
Tim Ball, you realise hopefully that drawing a circle on a mercator map has a high lattitude skew?
And just how much is the high latitude screwed?
Because land to the north appears larger than it really is on a mercator projection, the circles being drawn are actually covering less area than they should, so the problem is actually worse than it appears.
“…so the problem is actually worse than it appears.”
I knew it!
The distance is correct only the shape is skewed
The vertical height (above SL) of the land is also skewed, ….. right?
But who cares about any of this piffle ……. other than maybe the children who “track” Santa Claus’s yearly sleigh ride from the North Pole.
This has long been my gripe with reports about warming. Data is so sketchy. I see ocean temperatures from a century ago quoted to two decimal places! It is hard enough to reliably calibrate and to accurately measure to one tenth of a degree in a lab setting today. Don’t tell me you know what the average temperature was a century ago to a tenth of a degree. Nonsense.
The claim that “It is hard enough to reliably calibrate and to accurately measure to one tenth of a degree in a lab setting today” is nonsense. For about $1000 you can buy a calibrated digital thermometer accurate to within 0.02 degrees. So all you have to do is read the temperature off the screen.
And how long does it stay calibrated to 0.02C?
What are the pre-conditions that have to be met for that level of accuracy to hold, assuming you manage to maintain calibration?
Absolutely correct! Worked in a Cal Lab for several years. Many “Scientific ” devices came in to get their annual Cal were off by more than 10%, average was usually at about 2% OOC. Today many brainless scientists are using devices that have environmental specification requirements that require the device be within +/- 1 degree of calibration temp, and =/- 1 percent Humidity of calibration humidity. Yet these “sensitive” devices are used in the field, and I literally mean field. The electronics is subject to temperatures of under freezing and over 100 F. Same is true for every temperature taken in every electronic Stevenson Screen. The “Scientists” selecting this equipment simply look at the Spec sheet, see “accurate to 0.00x” and ignore the fact that it could change by as much as 1% for each 10 or 20 or so degrees in one way for high environmental temps and another for low environmental temp. Those that don’t think surrounding temperatures affect electronics should place their cell phone on the dashboard on a warm day and see if it works when it is very warm to the touch.
Classic case of confusing precision with accuracy. So the temperature that is inaccurate by 5K is presented with a precision of 0.01K .
And typically temperature probes of the same type all skew in the same direction over time so without recalibration there ill be a trend in one direction.
Ian W –> Bingo!
I know scientists can’t know everything but you would think they would be intimately familiar with the instruments they are using and their failings.
You can indeed get a temperature reading precise to 0.01 C and accurate to 0.02 C in a lab, but not with a thermocouple. Thermocouples are not that accurate.
If you use an RTD accuracy will be within 0.02 in the beginning and about 0.06 after a year. That is why the ARGO floats, after 5 years without calibration, are not accurate to 0.02, even though they have a matched pair inside, one for calibration.
It is not that it might ‘maintain calibration’ it is that it will maintain its accuracy. Well, everything drifts, some things sooner, some later, something more.
There is no way the global average temperature, if it exists, is known to better than 0.5 C, and the anomaly is no better than ±(0.5*Root 2). The reason the anomaly is less certain than the two contributing values is because both the input values have an uncertainty which propagates through the subtraction operation and increases it. And don’t let anyone tell you differently. Claims for an anomaly with an accuracy of 0.01 are laughable. Cannot be done and sure as hell can’t be done using thermocouples.
Perhaps I should have said it takes careful calibration and attention to accurately and reliably measure to a tenth of a degree even in a lab setting. A century ago in the field, the accuracy of measurements cannot be relied upon to the degree frequently quoted. A 2007 IPCC report stated that the Earth had warmed .74 degrees C in the previous century. Statements like that always set off my BS detector.
I still say that if you are selling me data from a century ago quoted to a tenth of a degree, I’m not buying.
If ever I want to torture myself, I try to imagine how I’d model a maize field. Or even just one plant.
Because it is designed to capture as much sunlight as possible. All those big bendy leaves, maybe moving in the breeze, and hence always a surface area perpendicular to the sun.
Apart from the energy captured and used for photosynthesis, it captures pretty well all the heat energy within the sunlight. Or whatever its albedo says it will.
My brain-ache is: what would be or is the effective energy-absorbing surface area of the maize plant and how would it change as the sun moves across the sky?
Then, all those big flapping leaves form a very large surface area that will lose that thermal energy to the surrounding air, via conduction & convection.
Where maize is grown (91 million acres) across the plains, it is not the native species. Previously there would have been perennial grasses. Growing close to the ground and during the hottest part of the year, presenting a high albedo and minimising the surface area presented to the sun.
Surely, native perennial prairie grassland would run cooler than a maize field?
Same would apply to wheat and barley fields but maybe not so much as they are much shorter plants.
Then something that seriously bugs me about the GHGE. For it work, everything is worked out using Watts per square metre but it also takes the atmosphere as being, to a greater or lesser extent, transparent.
Hence, if you go way up into high Earth orbit, you will see Earth radiating from a volume, not from a flat surface. The volume being determined by how transparent the air is to whatever wavelength of radiation you’re looking for.
Therefore, any sine or cosine adjustment for viewing angle goes out of the window AND, as the atmosphere is not completely transparent to solar radiation, what about incoming absorbed energy? A bit like the maize plants in fact. More is absorbed than first thought.
Nicely explains the Urban Heat Island also = lots of tall buildings presenting perpendicular absorbing surfaces from the very instant the sun rises until it it sets. The city will have an effective albedo lower than you’d see from considering it as a flat planar surface..
There’s a one for any Excel spreadsheet genii out there….
Peta, wouldn’t the ground in a corn field be cooler than on a prairie since the tall corn effectively generates better shade (i.e. removes energy) than the grasses?
Please remember that the historic tall grass prairie grew perennial grasses which early explorers recounted as being high enough to tie in a knot over the saddles of their horses. Doesn’t sound “short” compared to typical commercial corn plants. Even the “short grass prairie” varieties of grasses grow a metre or more in height and grow so thick that the leaf surface area is huge compared to relatively widely spaced corn stalks. Indeed, the native perennial grasses of the world’s prairie areas provide the highest conversion of solar energy to biomass of any plants, when grazed by large herds of herbivorous animals.
Steve, I think short grasses of the shortgrass praire such as blue grama and buffalograss were more like 1 foot or less in height.
Switchgrass is native to the prairies. It is very tall and dense.
But not the shortgrass prairie. Switchgrass is a tallgrass prairie plant.
“In native prairies, switchgrass is historically found in association with several other important native tallgrass prairie plants, such as big bluestem, indiangrass, little bluestem, sideoats grama, eastern gamagrass, and various forbs (sunflowers, gayfeather, prairie clover, and prairie coneflower). These widely adapted tallgrass species once occupied millions of hectares.[8]”
(yes I know Wikipedia is wrong about WUWT but..)
The “average temperature” is a physically meaningless statistic. Temperature is not conserved.
Let me elaborate. If you were to tell me the ‘average temperature’ measured throughout an object or system made up of diverse materials in different physical states at different temperatures and pressures and so forth, there is no meaningful physical calculation that I could perform with that number.
Further to that, due to the presence of water vapor the atmosphere has varying enthalpy. The correct metric for energy content of a volume of air is kilojoules per kilogram. Temperatures in the atmosphere have little relationship to energy content. Air at. 75F and 100% humidity has twice the energy content of air at 100F and 0% humidity. Averaging those is a nonsense.
Ian W,
That is another elephant in the room. And it’s a really big elephant but some don’t want to see it!
And speaking of elephants, there’s this:
http://jonova.s3.amazonaws.com/guest/cao-jinan/jcao_common-errors-stefan-boltzman_aug2012.pdf
Add this to the fact that a global temperature does not exist and to the fact that station consistency does not exist, and , … well, … it’s truly an absurd state of affairs:
We have “scientists” using a flawed foundational concept to attempt to collect data using flawed measuring configurations, to posit an effect based on a flawed application of physics.
THIS is what we should be alarmed about.
Right on target. I am amazed how many papers and scientific pronouncements are made with no analysis of the the measurements being used, their applicability to the item being studied, or how the accuracy of the data affects the outcomes that are posited.
It’s like saying I have developed a pill to make people healthier but I really don’t know what its composition is. I run studies based on business’ absence rates in a few locations and proclaim that it is effective in reducing absence rates. Yeah, right!
Jim,
and further,
You pay the people in the study AND they can only take the pill while at work.
Averages are not measured either. I get your point though.
Inversions are probably a long way from rare in the oceans, but finding papers on it are difficult. This may be because they change consistently and require on site persistence to understand. Fixed stations and buoys would seem inadequate, satellites a little better for the surface. This one talks about finger-like salt sheets (Kimura, S. and W. Smyth. 2011. Secondary instability of salt sheets. Journal of Marine Research. 69:57-77). They are fairly common in the Gulf of Mexico (Weatherly, et al., 2003. Temperature inversions in the open Gulf of Mexico. Journal of Geophysical Research. 108(C6):8 1-8. )
I have measured a few. Off south Texas N-S (more E-W to the north) currents change opposite directions seasonally with winds but can reverse in any month. Current collisions were noted as far back as 1898, but densities of course differ due to temperature and salinity. If I was younger and had a vessel I would chase these, probably not easy to fund. Also I would not call the Carolinas subtropical.
Of course a “global temperature” doesn’t exist. But a global AVERAGE temperature for any altitude (or depth) you desire does exist.
You can do an areal average of any scalar quantity you want.
The question should be, what physical meaning does it have? Well, departures from the global average gives us an important clue about how the system is responding to *something*. But it’s just one of many metrics which are needed to have any hope of understanding climate change. I’m not sure it’s THE most important metric…global average albedo comes to mind, and the global average infrared opacity is another. .. and certainly the global-averaged radiative energy imbalance at TOA. Unfortunately, we can’t measure those as well as the global average temperature. So….
Just my opinion.
Now there is something I totally agree with but probably flies over the heads of many in climate science.
The weather satellites
and weather balloons
fly “over the heads”
of most people
in modern
government bureaucrat
climate non-science,
but they never look up,
so to them, the satellites
and balloons don’t exist.
I’ll ask the same question a lot of regular old people ask. Why wouldn’t ONE thermometer located somewhere on the earth tell us if the global temperature is going up or down? Why does it have to be a “Global Average” determined by a computer? You can’t tell anything from the global average as far as regional variations so what good is it? If I look at the global average, do I know what is going on in the Arctic, Antarctic, US, Australia, or South America?
Why spend trillions of dollars on bureaucrats, scientists, measuring stations, super computers when one simple thermometer would give you the answer. Why spend this kind of money on something you can’t even validate, i.e., there is no instrument that you can use to tell you what the global average temperature is so how do you know if your computer program is giving a correct answer?
Ocean heat content is an important metric but deep ocean lags by hundreds of years to respond or affect what’s happening in the atmosphere
“Proponents claim that this statistic represents a measurement of the annual global temperature to an accuracy of ±0.05 ◦C (see [5]).”
But the reference [5] is talking about anomalies being accurate to ±0.05°C, not temperatures. I expect that much of this post can be explained by the failure to understand that distinction.
When we are talking about how much the earth has or has not warmed. There is no difference.
Subtracting one number from another does not increase accuracy.
But this post, and the quote from the paper are not talking about how much the earth has warmed – they are talking about the impossibility of determining a global temperature. For example, all the stuff about Stevenson Screens and temperature differences at different heights might be an issue if you truly want to know what the actual average temperature is, but are unlikely to have any real impact on the anomaly.
If you cannot measure the temperature reliably and if temperature tells you nothing about the heat content of the air(it cannot with out knowing the humidity) the anomaly is still nothing by an illusionary number also.
EXACTLY.
Bellman, that might be true if you were using the exact same equipment to measure both the base (average) temperature and the current temperature in order to calculate your “anomaly”.
In the real world neither case is true.
MarkW,
You don’t need the “exact same equipment” as long as the replacements are well calibrated, and if they aren’t that should be picked up during quality checks.
If you insist in the same equipment being used all the time, do you also regard satellite temperature data as meaningless as inaccurate as well?
Bellman,
It doesn’t matter, because at some point you must measure the absolute temperature in order to calculate the anomaly (which is just a subtraction operation). If, when determining the temperature, you have a +/- 0.5 accuracy, then the anomaly will have the same accuracy. It can’t be better!
Paul Penrose,
That’s not the way it’s calculated. You don’t work out the anomaly by working out the global average, you get the anomaly for each station and work out the global average anomaly from them.
In any event it misses my point – your estimate of the global average could be completely wrong, yet you can still get an accurate measure of the average anomaly.
Anomalies are used as the sampling is too poor for a good estimate of the average and only the change is important. Its only a quick fix if the long term trends for all stations is the same otherwise it has the same problems as estimating the change in the actual average.
I appreciate climate scientists who collect and process data, otherwise we’d be ignorant.
Because of the wide variety of data and coverage areas, the number one thing I think we can do now that couldn’t be done 30 years ago is see were and when the sun’s light energy warms the ocean, how it moves in the water, when it escapes as OLR and/or water vapor, and were that energy goes, and the havoc it does along the way to space. It truly amazes me to be able get this information from anywhere, from home, and for that I’m very grateful to the climate industry.
Where I draw the line with the climate industry is the make-believe they engage in, where they say the climate is driven by very small changes year to year of CO2, which actually lags temperature. They go on to demand we believe their fantasy, their science fiction.
According to the climate industry, the knowledge of the transient climate response and the equilibrium climate sensitivity is the holy grail. How can this whole AGW thing be taken seriously when in reality CO2 is a result of climate forcing, not the cause of climate change as they say? Every recalculation and regurgitation of the latest TCR and ECS estimates is further brainwashing of a backwards idea.
There can’t be a TCR or ECS for CO2 unless future lagged CO2 controls past temperature change.
AGW is impossible because CO2 doesn’t drive temperature change.
So yea, why are we wasting all that money?
Thank you much Bob Weber.
I published a similar conclusion in January 2008 on icecap.us – that CO2 trends lag atmospheric temperature trends by ~9 months in the modern climate record. I later wrote that ocean temperatures led atmospheric temperatures by a few months, but that was discovered by others.
Humlum et al repeated these observations in 2013.
It is gratifying that people are now starting to discuss these observations, only ten years after my publication.
When conventional climate science can credibly explain how the future can cause the past, then their estimates of “climate sensitivity to increasing atmospheric CO2 (ECS,TCS, etc.)” will be much more credible – but I want to see their logic, and/or their time machine. 🙂
Stevenson Screen temperature helps to understand local temperature/weather condition and relative comparison of other stations weather/temperature. The lapse rate was defined to understand the temperature/weather variations with the height. However, in winter with inversion layer this is modified based on the pollution status. These are used for different purposes. However, these are modified by several local conditions like see breeze, land breeze, forest cooling breeze, mountain hot and cold breeze, etc. Also, heat waves and cold waves primarily depends upon the general circulation pattern — for example, the high pressure belt located around Nagpur in India plays the main role on the heat and cold waves path. So, we should not confuse our selves and create panic among others. For denouncing global warming concept, we make science a scapegoat, which is bad science. Some of these basics were presented in the standard textbooks of meteorology & oceanography.
Dr. S. Jeevananda Reddy
For denouncing global warming concept, we make science a scapegoat, which is bad science.
If climate science defines science and we cannot denounce man-made global warming, then science has clearly been reduced to a matter of enforced belief in impossible illogical science fiction – it’s dogma.
AGW is belief in the illogical; it’s scapegoating humans for what nature has done.
It’s bad science to allow this bad science to live on.
If global warming is science, it should prove the relationship scientifically in terms of carbon dioxide versus solar spectra of CO2 band. Every other day people are dangling with this — Climate sensitivity factor –. Even IPCC goes on reducing this factor. In nature this factor should come down non-linearly with increasing anthropogenic greenhouse gases as the energy is not dynamic in real terms but a static with the Sun as centre. So, linear relationship between CO2 and its energy band. This is same with energy versus production or moisture versus production, etc.
Dr. S. Jeevananda Reddy
Nothing to do with climate science but from the hard sciences you will probably have that answer next year. Mid last year quantum transfer was achieved to the orbiting quantum satellite from a ground based emission (https://arxiv.org/abs/1707.00934). It is the reverse of the earlier satellite to ground base reception of entangled particles. Transmitting into space is more difficult as turbulence in the Earth’s atmosphere causes the particles to deflect.
They will be transmitting thru the optical windows which includes CO2 but via the entanglement they will have the properties of the entire path length of the transmission by switching the properties at different heights of the path thru the atmosphere. They hence confirm the characteristics of the gases including CO2 at heights along the path.
It is all possible because the entangled pair retained at the ground station can instantly transmit the property change to the launched photon as it ascends the atmosphere.
.
❶①❶①❶①❶①
❶①❶①❶①❶①
❶①❶①❶①❶①
❶①❶①❶①❶①
.
How Tamino proved himself wrong.
Tamino has made it clear, that he is a slowdown, pause, and hiatus, denier.
But in a recent post, Tamino has made a stupid mistake.
In his eagerness to show how bad global warming is, Tamino has accidentally acknowledged that the recent slowdown exists.
https://agree-to-disagree.com/how-tamino-proved-himself-wrong
If you wanted some idea of the global average temperatures 1.2m above the ground, you would need to do a “Super TOBS”, not the sort that gives comfort to the temperature wroughters who create all the “mann-made” global warming with an algorithm. A well distributed set of automatic stations around the globe should be read simultaneously say every half hour. Dont wait until the sun wakes you up wherever you live to do your local TOBS. An average earth temp is certainly not possible if you have to wait half a day for the measurement to be taken on the other side of the globe for that day. And you certainly can’t take them relative to an artificial time zone time. I’d like to hear from the TOBSY types about this.
Remember when we used to use the wonderful array of high tech temperature buoys for ocean temps on and below the surface. They quit all that when the ocean temps turned out to be dropping and went back to old reliable ship-based temps (they could be reliably fiddled with.)! Satellite temps also fell from favor when they detected the “Dreaded Pause^тм”.
Sea level flattening resulted in the “need” to add on a isostatic rebound factor which changed a two dimensional metric to a partial volumetric measure, thereby creating a sea level that is magically floating somewhere above physical sea level! And dont get me started on the unhappy discovery that the centers of CO2 emissions were found to be in the tropical forest belt far from fossil fuel gorging industries (and not good news for the thoroughly mixed in CO2 worriers.
I always wait with relish for Dr Ball’s diatribes, as well as Willis’ and in fact I spend a good deal of time every day at this site, and love Anthony’s great work. Good brain exercise.
What I would like someone to do is to alternate the sites in the data ( divide into two sets ) and see how they differ. I certainly think that they will not agree very well at all. All this use of temperature as the only important descriptor of climate deserves only ridicule. It is sort of like determining the usage of a vehicle by the tire pressure. Valuable information but overall of little use.
Global average,,, my a**.
Global average temperature is the average temperature of the entire ocean- which is about 3.5 C.
An ocean with average temperature of 1 to 5 C, tells you Earth is in an icebox climate.
When ocean temp is above 10 C, Earth is in a hothouse climate.
A hothouse climate has a high average global temperature which globally has a more uniform temperature as compared to icebox climate. A hothouse climate has polar regions which has semi-tropical conditions- don’t have cold winters and don’t have hot summers. And dominate climate globally is tropical- moderate temperatures and temperatures with little seasonal changes- and higher humidity and wetter. And tropical plants will not be confined to the tropical zone. Though in higher elevation it’s cooler and drier.
Currently Earth is cold, most of history of Earth has been warmer and with ocean average temperature of about 10 C. If Earth ocean were 10 C, it would result in very high sea levels due to thermally expansion of ocean. And one would also not have our ice caps or polar sea ice.
But the ocean can not warm up quickly, a 1 C rise in ocean average temperature within a century can not happen and is unlikely to occur within a thousand years.
But if oceans warm from 3.5 C to 4.5 C you will have a large sea level increase- more than 1 meter due to thermal expansion, and in last hundred years sea level have gained about 7″ or about 20 cm and at most about 2″ [5 cm] due the thermal expansion or due to average ocean temperature increasing.
But if ocean warm by 1 C, one will get global temperature which are more globally uniform and we move a inch closer to a more normal global average temperature of Earth- or less like the Ice Age that we are in, and have been in for more than 1 million year.
In last interglacial period oceans were about 5 C in the warmest part of that interglacial time period. [see: https://en.wikipedia.org/wiki/Eemian ]
Tim asks “When will somebody stop this madness?” Well not yet in the UK, as the Government madness is getting worse. Hence “Climate experts asked for advice on net zero target”.
https://www.gov.uk/government/news/climate-experts-asked-for-advice-on-net-zero-target?utm_source=1fdb2250-a7f2-4562-86a4-27961780e375&utm_medium=email&utm_campaign=govuk-notifications&utm_content=immediate
How can you average land air temperature and ocean water temperature meaningfully?
I also very much appreciate Dr. Ball’s articles. One of the few that have stood up for principles when so mamy others were blinded by fame and fortune. Well done Dr Ball.
Just a thought.
It is recognised that the climate system comprises the atmosphere and the oceans, with by far most of the heat contained in the water rather than the air. Surely then the measurement of air temperatures, while interesting for all of us who live and breath on dryish land, is really of very little interest in determining what the climate is doing or will do in the future. Variations in heat content of the oceans must be the dominating factor.
Related to this, when considering the whole system and comparing the surface temperature of our dynamic Earth to that of a black body, shouldn’t the average temperature be calculated including the water in the oceans?
Even further, shouldn’t the “average temperature” be calculated including all altitudes in the atmosphere, from ground/water level to, say, the altitude that is the center of mass of the whole atmosphere?
The thing that always bugs me is that in science you should never use a precision that is greater than the least precise figure and yet these so called climate scientist are continually doing it.
Thank you Dr Ball.
” ..’ The reality is weather forecasting has not improved despite all the satellite and computer models: witness the most recent failures with hurricanes Florence and Michael. … ”
—
What amazes me is that none of the comments above took issue with that ludicrous sentence. It looks like everyone has decided to just go quiet on what’s clearly an absurd claim. These are crank remarks being dressed-up as rational conclusions (and a gratuitous case of ‘The Nile’ too, just not about the usual suspects).
I’m not going to sit and nod at what are plainly ridiculous remarks. No, the alleged high-water mark in weather forecasting did not occur when I was a boy. That is simply delusional, IMHO.
2c
I am going to disagree with you slightly WXcycles. Science did not do a very good job -forecasting- the most recent hurricanes. Meteorologists did a great job -observing and tracking- the hurricane. They did not anticipate their origins nor did they do an accurate job of predicting their paths except in general terms with landfall and trajectory paths spanning hundreds of miles. Yes, yes, yes, when the hurricanes got close enough their paths became inevitable, and thus predictable, but the forecasts a week out? Not very good.
I looked at both closely, they’re vastly better quality forecasts than were available 20 years ago, and both were more than sufficient for the purposes they were intended for, and both were extraordinarily accurate 4 days out.
If you are looking for precision forecasts of stochastic factors in weather you’ll need a different cosmos.
I have recreated figure 2 using a 12 inch globe.
I have 2 different sized circles, the small ones are 1200 km diameter (600 km radius) and the larger ones are 1200 km radius.
Globe specifications: One inch = 660 Statute Miles, Une Cm = 418 Kilometers
My circle cutouts: 1.12 inches, 2.25 +/- inches
Great essay, and I like the examples of three-dimensional measurement comparisons you’ve been involved with.
I think the AGW promoters would admit that the temperature data aren’t adequate theoretically, but that all they are trying to do is demonstrate trend changes. If a data set is held consistent for decades in a certain place and certain height above ground, and if it is well sited, and if there is no encroachment of man-made heat sources, then if it shows warming over the decades it means something — and if there are hundreds of such results around the world in various places you can claim to have demonstrated evidence of global warming…
… the trouble is, the data isn’t consistent, the sites are often not well-sited or have man-made encroachment like UHIE, there are large gaps in the data, the equipment quality control is questionable, and they keep fiddling with artificial and questionable adjustments of the data, as well as claiming greater accuracy than the instruments are capable of giving.
The climatologists are trying to do the best they can with data that is far from ideal — and trying to make it work “good enough.” Maybe they have shown there is enough data to show concern about possible global warming, but not prove it, and what should happen next is that money should be spent on creating much better data sets from now on — including perhaps adding three-dimensionality — temperature data collection towers all over the world that are 1,000 feet tall with sensors ever 100 feet, etc. Instead they skip this step and go directly to conclusions, with fake claims of accuracy and predictive ability, and threaten the world with predictions of imminent hellfire and calamity, demanding we overturn our economy and systems of government based on their say-so. It’s not scientific.
Thanks for a great essay Dr. Ball.
The meaningless number splashed about for “global temperature” is only useful when scamming ignorant people. Example: This morning across the Front Range in Colorado a weather network I contribute to has reported measurements ranging from 8 degrees F to 18 degrees F. The official number will come down somewhere near those numbers but will undoubtedly be associated with an instrument located close to concrete, buildings, and heat sources. I would scoff at any number that someone claimed was the global temperature. The insanity it takes to claim to have determined that measurement, and keep a straight face, is unfathomable. It’s a lie!
Dr Ball,
I found your experiences #3 and #4 interesting, do you have any papers relating to them available?
Also, I’ve always wondered why 30 years was picked for the base year length, I understand part of the problem was lack of longer duration data (of any accuracy), what length would you suggest might be more realistic? In a previous life, I maintained AWOS systems, and that experience helped to remove doubts regarding AGW. 🙂
Dr. Ball says: The first involved detecting Soviet submarines in the North Atlantic.
I did this for 20 + yrs. from 67 N lat to Bermuda and Norfolk to Perth Australia. And you are correct. The last time I ran into the layer problem was in the Indian Ocean with radar. An inversion layer gave us ranges of nearly double the physical capability of the radar.
It sometimes it comes in handy. We often could dial in US radio stations while flying over in IO for entertainment.
Commie sub hunting is the best.
Something that I posted years ago. I was wondering whether fractions of a degree differences was meaningful. This is a plot for three stations in a city for a year. They are within 10km of each other on a plain. AP is 8 km from the built up city centre and 1km from the coast of a gulf. The other two are on different sides of the built up centre. I looked at the difference between each station and the mean of the three, for the maximum. There is a 5 day moving average smoothing and in winter it doesn’t differ much but still weather patterns don’t just affect the temperature in the region, they effect how stations differ in the area by half a degree at least to a over a degree.
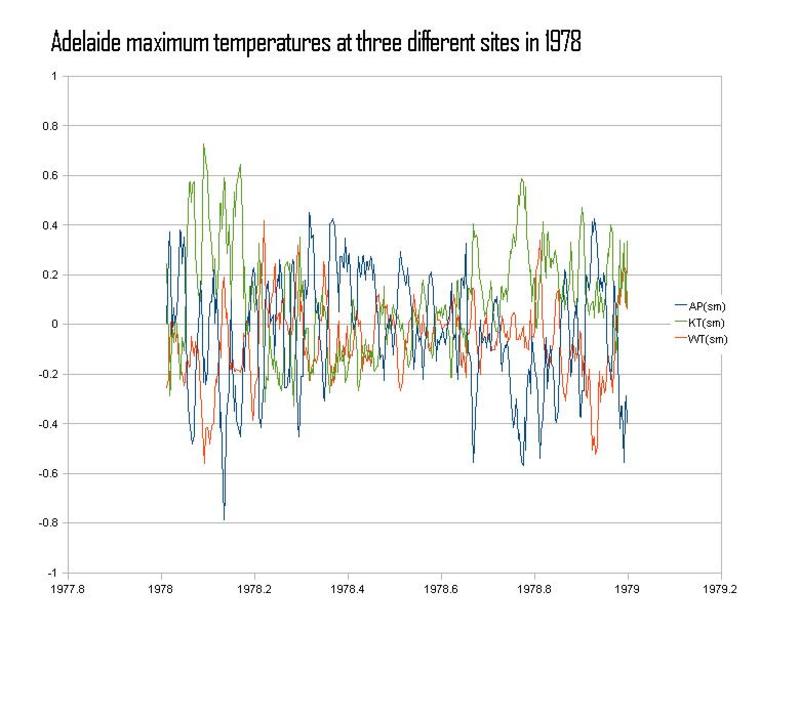
If the sampling was even, record good and no homogenisation needed, you could assume the random variation is negated by many measurements but that is not the case.