I will soon be publishing again my Monthly Global Surface (Land+Ocean) and Lower Troposphere Temperature Anomaly posts at my blog ClimateObservations and at WattsUpWithThat . Since my last update back in December 2015, NOAA has once again revised their Extended Reconstructed Sea Surface Temperature dataset, from the “PAUSE-BUSTER” ERSST.v4 version to ERSST.v5, the latter of which I’ve appropriately dubbed NOAA’s “PAUSE-BUSTER 2” sea surface temperature data.
Because NOAA NCEI and GISS now use the new NOAA ERSST.v5 data in their global land+ocean surface temperature anomaly products, we’ll take a quick look at this new NOAA ERSST dataset. This is a quick introduction with only two comparison graphs. I’ll expand the examination of the new “Pause-Buster 2” ERSST.v5 data sometime in the future.
A couple of years ago, we examined NOAA’s ERSST.v4 “pause-buster” data in a series of six posts, which are summarized and linked in the two final posts of the series:
- The Oddities in NOAA’s New “Pause-Buster” Sea Surface Temperature Product – An Overview of Past Posts (WattsUpWithThat cross post is here.)
- On the Monumental Differences in Warming Rates between Global Sea Surface Temperature Datasets during the NOAA-Picked Global-Warming Hiatus Period of 2000 to 2014 (WattsUpWithThat cross post is here.)
The new “Pause-Buster 2” ERSST.v5 sea surface temperature data is supported by the September 2017 paper Huang et al. Extended Reconstructed Sea Surface Temperature, Version 5 (ERSSTv5): Upgrades, Validations, and Intercomparisons.
ENOUGH WITH THE INTRO STUFF, BOB. SHOW US THE GRAPHS
Figure 1 presents the most recent three versions of NOAA’s ERSST sea surface temperature data in annual absolute (not anomaly) form, globally, excluding the polar oceans (60S-60N), for the period of 1998 to 2014, which was one of the periods used by NOAA in their 2015 Karl et al. paper Possible artifacts of data biases in the recent global surface warming hiatus.
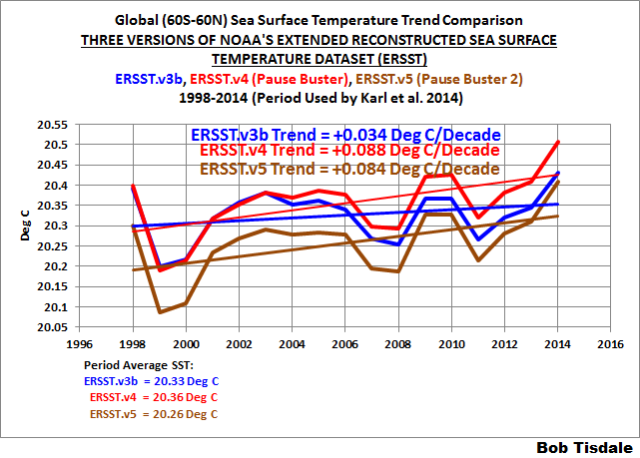
Figure 1
I don’t recall in past posts comparing the ERSST.v4 “pause buster” and ERSST.v3b data in annual absolute form. Curiously, on an annual basis, those two datasets track almost perfectly from 1998 to 2003. And comparing the two “pause-buster” datasets, during the NOAA selected period of 1998 to 2014, the warming rates of the global (60S-60N) ERSST.v4 “pause-buster” and ERSST.v5 “pause-buster 2” datasets are basically the same.
Note also that the latest ERSST.v5 “pause-buster 2” data have the surfaces of the global oceans cooler than the ERSST.v4 “pause-buster” data by 0.1 deg C.
Why is that important?
With the ERSST.v4 “pause-buster” data, the climate models used by the IPCC for their 5th Assessment Report (stored in the CMIP5 archive) were showing modeled virtual sea surface temperatures that were warmer than the observations for world ocean surfaces.
With the new “pause-buster 2” ERSST.5 data, there is now a greater difference between models and observations. See the model-data comparison of global (60S-60N) sea surface temperatures in Figure 2, which runs annually for the past 30 years.
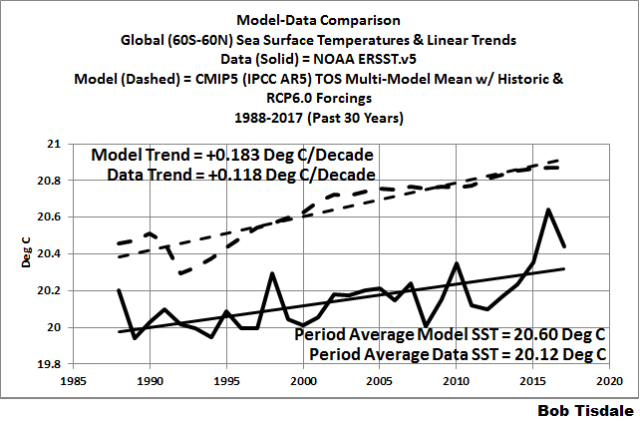
Figure 2
And as expected, climate model tuning clearly ensures too much warming over the past 30 years.
For the comparison, I’ve used the multi-model mean of the TOS (Temperature Ocean Surface) from the CMIP5-archived models, which, again, were used by the IPCC for their 5th Assessment Report. The multi-model mean represents the consensus (or, better said, groupthink) of the modeling groups.
SOURCE
The ERSST.v4 and ERSST.v5 data and the CMIP5 climate model outputs are available for free at the KNMI Climate Explorer. (Thank you, Geert Jan.) The ERSST.v3b data are no longer available there, but I had them on file from the earlier posts.
STANDARD CLOSING REQUEST
Please purchase my recently published ebooks. As many of you know, this year I published 2 ebooks that are available through Amazon in Kindle format:
- Dad, Why Are You A Global Warming Denier? (For an overview, the blog post that introduced it is here.)
- Dad, Is Climate Getting Worse in the United States? (See the blog post here for an overview.)
Ciao
Bob
Bob, are these datasets from only the ARGO floats?
Alan, no. ERSST.v5 uses near-surface ARGO data, and ICOADS data which is made up of observations from buoys and ship inlets and buckets.
See Huang et al (2017) linked in the post and below.
https://journals.ametsoc.org/doi/10.1175/JCLI-D-16-0836.1
Cheers
Bob
Bob Tisdale
October 14, 2018 at 4:22 am
Many thanks for the useful update.
The new ERSST v5 at 1.18 C per century (30 year record) or 0.84C per century (20 year record) doesn’t seem anything to get too worried about I would have thought. We’re not going to fry for some time to come.
how “near surface” is the near surface data ? the near surface temperatures can cool and warm a lot faster than some people would give them credit for. a week of cloud at this time of year will see surface temp drops of 2 to 3 degrees in inshore waters around here.
There’s the rub. Nobody knows how “near surface”. There is no standardization on the data.
Anyone who uses that data is declaring up front that the don’t care about accuracy.
“DATA CONTRIBUTORS AND INDICATOR REVIEWERS”
If you look at this list from EPA 2014 cited early in the Huang, et al. paper for important indicators of climate, you can see the problem. My sample size is small, but may indicate what goes on with too many government programs, basically a conflict of interest. I would like to know the attempts, if any, made to find independent reviewers in all these programs (or papers) that are not associated either with government at some level or other conflict of interest organizations.
As an example, often noted here, this paragraph from the report (among other problems) should have been challenged as there is so much wrong with it.–“Ocean Acidity. The ocean has become more acidic over the past few centuries because of increased levels of atmospheric carbon dioxide, which dissolves in the water. Higher acidity affects the balance of minerals in the water, which can make it more difficult for certain marine animals to build their skeletons and shells.” I actually ran across an old paper that used “acidity” (pH around 5.5-6.5).
The statement “dissolves in the water” appears to have been written by a fifth grader, no offense to students smarter, and others, than their teachers (or the EPA).
Does climate science give new meaning to the word ‘airhead’ or is that now a forbidden word?
“high-latitude SSTs are decreased by 0.1°–0.2°C by using sea ice concentration from HadISST2 over HadISST1.”
Why don’t they use the expansion of coral plus similar “adjustments” and lump that in with the temperatures? / sarc Climate scientists indeed have no shame when it comes to including apples with oranges in their datasets.
Hmmm….lowering the past data has now entered the 21st century just prior to Argo data which is much harder to adjust.
Nice work Bob Tisdale.
The official scientific establishment is totally corrupt. ” The best science money can buy. ” Paraphrased form a barbarian on trial in Rome who was determined to be not guilty. On leaving, someone asked him how he got off. ” I paid off the Senate. Best justice Money can buy. “
https://www.tropicaltidbits.com/analysis/ocean/
The ocean tid bit site which I really like.
Question how reliable is the data? I like this site and I hope it has not been manipulated or reconstructed.
Hey MODS getting “This Page Can’t Be Displayed” this AM.
Also this AM getting cursor freeze on vertical scroll arrow.
“Also this AM getting cursor freeze on vertical scroll arrow”
Problem is your end.
According to Fig 1 from 1998 to 2014 the SST moved from 20.3C to 20.35C, i.e. 1/20C.
This is well within margin of error, and for all practical purposes the only reasonable conclusion has to be:
“there was no change in the SST during 16 year period considered.”
There has been no statistically significant change in the temperature during the analysed period.
Or
If there has been any change in the SST, it is not detectable with any meaningful level of confidence, i.e. more than 5%.
“the SST moved from 20.3C to 20.35C, i.e. 1/20C”
Well, that is Bob’s calculation. According to the NOAA anomaly average, the trend for that period is 0.11 °C/decade, with a rise for the period of 0.32°C. And if you include the last four year, it is 0.123°C/decade.
I assume Bob’s is an average of absolute temperature, and this is one of many cases where that matters. The problem it makes for trend is that it may reflect a change in the composition of the set measured, rather than in temperature. With SST, it is going to depend on how you allow for sea ice, but sensible averaging is of open sea only. And over this period, the region of open sea expanded, with melting ice. But of course, the new sea being added to the average was very cold sea, and the trend reflects that. That is yet another reason why one should always average anomalies, not temperature.
Nick writes, “I assume Bob’s is an average of absolute temperature, and this is one of many cases where that matters. The problem it makes for trend is that it may reflect a change in the composition of the set measured, rather than in temperature. With SST, it is going to depend on how you allow for sea ice, but sensible averaging is of open sea only…”
Nick, read the post and the title blocks of the graphs again. The latitudes only reach from 60S-60N. In other words, I’ve excluded the polar oceans, so there’s no concerns about sea ice.
Regards
Bob
Thanks, Bob
Yes, sorry I missed that. So averaging absolutes is probably OK here.
But the restricted region does explain some of the discrepancy between that and the NOAA trend.
Just one more example of Stokes’ misleading comments.
“…And over this period, the region of open sea expanded, with melting ice. But of course, the new sea being added to the average was very cold sea, and the trend reflects that…”
It appears you’ve spun yourself silly.
ergo :”when in a hole stop digging”
Hi Nick,
What’s the tolerance on those numbers? Is the tolerance wider than the claimed value? If so – it’s not statistically significant.
The Adjusters strike again.
…they can’t claim anything right now
We won’t know what the temp is right now for at least another 20 years
The climate priesthood is releasing new versions of its prayer-book as frequently as new software updates for the iPhone! Please stop! This is confusing and distressing for the believers. Learn a lesson from the Vatican. Talk SLOW. Debate issues endlessly. Release encyclicals and decrees once every half century or so. Then folks will take your religion seriously. Not every couple of months. That lacks the needed dignity and gravitas. It makes it look almost as if you are scrabbling to cover something up.
“Note also that the latest ERSST.v5 “pause-buster 2” data have the surfaces of the global oceans cooler than the ERSST.v4 “pause-buster” data by 0.1 deg C.
Why is that important?”
[This update incorporates a new release of ICOADS release 3.0 (R3.0), a decade of near-surface data from Argo floats, and a new estimate of centennial sea ice from HadISST2]
[The reconstructed SST is systematically decreased by 0.077°C, as the reference data source is switched from ship SST in ERSSTv4 to modern buoy SST in ERSSTv5. Furthermore, high-latitude SSTs are decreased by 0.1°–0.2°C by using sea ice concentration from HadISST2 over HadISST1]
2) It increases the slope making it appear there is more warming.
So why is this not done for very recent years including the 2016 El Nino? There has been no decrease in surface temperatures for the strong El Nino period.
If these reduce the El Nino 1998/99 any more it will be indistinguishable from any noise. It has already been reduced by about 0.3 c.
There is very little difference (within error) between global SST’s during peak 1997/98 El Niño and that of 2016. All this does is shows further cherry picking and adjusting these further apart are only getting less accurate from the truth.
Why not cool the recent El Niño 2016 by about 0.3? This will happen in future years so why not do it now to safe the obvious future cherry pick?
These regular cherry picks of adjustments are nothing more than insulting the intelligence of the public and fellow true scientists.
Finally, if the data was suppose to be good even with recent modern technology why is it no good just several years later? This isn’t science, it has become a game where cooling past and warming present are the new rules in support of the cause. It is only ever one way because they are con artist’s. Before anyone mentions it, the cooling and warming are done in precise parts of the timeline too perfect to be random errors.
Matt G,
“It increases the slope making it appear there is more warming.”
How so? The temp is adjusted down.
“…ship SST biases are now calculated relative to more accurate buoy measurements, while the global long-term trend remains about the same.”
The effect is to lower the SST, while preserving the trend. I tried to point out in another thread that the trend would be the same whether the buoys or the ship data were used for adjustments, and evidently many here still don’t understand it. >>>It’s all relative.<<<
"These regular cherry picks of adjustments are nothing more than insulting the intelligence of the public and fellow true scientists."
There's always some lame reason to claim the scientists are wrong, corrupt, etc. Maybe you should think twice about whose intelligence you think is being insulted when you say this is a "cherry pick" of adjustments, since this method of handling the data bias is something many skeptics have long claimed was the right one.
“It increases the slope making it appear there is more warming.”
[How so? The temp is adjusted down.]
Adjusting the temperature down for a cherry picked period causes the temperatures after it to have a higher difference so the slope increases after it.
The cherry pick of adjustments does apply.
Regarding the buoy measurements.
Why not make these adjustment before when sceptic’s long claimed was right? Temperatures wouldn’t have been as warm as they appeared to have been back at the time. It has been done later on purpose to lower the timeline that has now not become so recent.
1) The adjustments down never occur to the very recent data. (last few years)
2) Why not lower temperature for the 2016 El Nino?
3) Timing of the changes are predictable
4) The errors are larger then the little adjustments they keep doing, but longer term they have a significant influence on the slope.
For three decades now adjustments to increasingly not so much data have been in the same pattern. Only cool when in past to show higher slope or during an El Nino to help neutralise it. Warm the very recent data to exaggerate the current trend or warm an inappropriate cool trough to higher the slope.
Thanks so much! Desperately trying to stay afloat in the manipulated waves of “data” and there aren’t many climate scientists willing to even try. I’d just like to know why not?
If you look long enough, you’ll eventually find a set of data that will support your conclusion.
Bob,
As many people here have pointed out, temperature is an extrinsic physical property. That is, temperature can vary depending on the pressure of a gas, and the specific heat of a solid or liquid. The temperature of surface air cannot be be averaged from a rigorous physics viewpoint. However, because we have standardized the elevation of meteorological stations, we measure an index of heat (temperature) that has a relationship similar to that between mass (intrinsic) and weight (extrinsic). As long as everything is kept constant, except the heat content, temperature can be averaged with the caveat that it is really a proxy for the heat content of the local air mass.
However, water has a specific heat that is about twice that of surficial materials, and much higher than air. That is, the constant of proportionality between heat and temperature is very different for water, than what it is for air, grass, or concrete. Measuring air temperatures is important because that is the medium that biological life forms are immersed in, and it is what adds or subtracts to body temperatures. It is neither appropriate nor desirable to average sea surface temperatures with land air temperatures. A further consideration is that if trends are changing, they will show up earlier in land air temperatures than they will in water temperatures. Because of the high specific heat of water, changes in water temperature are slow and lag behind air temperatures. Water temperatures are of interest, but they should be presented and examined separately, NOT combined with land air temperatures!
I’m going to disagree with your conclusion. I believe the water temperature is the anchor to the atmospheric temperature. Air temperatures will rise and fall around some air heat content that is linked in some way to the water temperature. So regardless what the air temperature does, there is no overall change unless and until the ocean temperature changes. *musing* Is there some research somewhere that supports that?*/musing*
Red94ViperRT10 ,
You said, “So regardless what the air temperature does, there is no overall change unless and until the ocean temperature changes.” So, I guess that explains why Phoenix is so hot — it is right on the coast! 🙂
“Because of the high specific heat of water, changes in water temperature are slow and lag behind air temperatures.”
Incorrect, slow changes in water temperatures occur due to variance in annual solar radiation with air temperatures later responding. The only quick air temperature changes occur where they are not influenced by a body of water.
Air temperatures lag ocean temperatures at all times because the surface area being 71%.
http://www.woodfortrees.org/plot/hadsst3gl/from:1998/plot/hadcrut4gl/from:1998
I am very familiar about specific heat capacity and it’s this that stores the sun’s energy. My point being solar energy warms it not the air. The water and ground is warmed up first by the sun and then it warms above it increasingly less the further away from the ground, through the atmosphere. (known as the lapse rate)
I never meant you were incorrect because of specific heat capacity, but because water temperatures do not lag behind air temperatures.
This part that I was referring too that is incorrect.
Look at global ocean/sea temperature once regions drop below 200m/w2 solar energy. This occurs around Iceland in about 4 or 5 days time for example.
What happens?
They start cooling relatively quickly.
The comment about the lake temperature is not relevant because it is comparing the temperature of land with water temperature, not the air above water compared with water.
Matt G,
You said, “The only quick air temperature changes occur where they are not influenced by a body of water.” Which is most of the interior of continental masses.
Next time you go camping near a lake, put a thermometer in the water and take readings every hour. Also put a thermometer in the shade near your tent, and compare the readings with the thermometer in the water.
I take it that you are unfamiliar with specific heat capacity.
https://en.wikipedia.org/wiki/Heat_capacity
If you are intent on obfuscating relevant metrics in the debate, then you average them.
“As many people here have pointed out, temperature is an extrinsic physical property. That is, temperature can vary depending on the pressure of a gas, and the specific heat of a solid or liquid. The temperature of surface air cannot be be averaged from a rigorous physics viewpoint.”
Well, yes, they do point that out. Never quoting any authority, and I think it is rather bizarre. But usually the claim is that temperature is an intrinsic property. And at least that part is right – here is Wiki on the topic, with temperature listed as an example of an intrinsic variable.
In fact intrinsic variables are very commonly averaged. It’s true that they often weight the averaging relative to some extrinsic variable such as mass, so the average becomes a measure of heat content. But that averaging is really what intrinsic variables are for, and it is often reflected in their units, like kg /cu m. To find the density, you take various volumes and measure the mass. The density you measure is actually the average density of that volume.
And so temperature is averaged relative to area weighting. It’s true that area is an imperfect proxy for mass, which, given the inhomogeneity, can’t usefully be determined in a corresponding way. But, as usual, imperfect doesn’t mean worthless.
Nick,
Do you mean in the above, “intensive” rather than “intrinsic”?
Kristi,
Well, I was following Clyde’s usage, but yes, I did equate with intensive, which is a more Wiki has a separate entry, and says archly that they are not to be confused, but the usages do seem similar. Anyway, I don’t think Clyde was distinguishing, and I wasn’t.
Nick,
I don’t think they are similar, or certainly not synonymous.
See my post to Clyde.
Kristi,
I think you’re right, and intensive/extensive was what I meant. As I said, I was following Clyde’s usage, and I think it is what he meant, but I’m not sure.
Nick,
OK, you may have me here. But, would you be good enough to explain to me how temperature is intrinsic when the adiabatic compression of a volume of gas will cause the temperature to increase?
Similarly, please explain how briefly suspending two solids of equal volume, with different specific heat capacities, in a liquid bath, results in two different temperatures if the temperature is an intrinsic property? Similarly, two equal volumes with different thermal conductivity will result in different temperatures if not allowed to reach thermal equilibrium before being measured. Lastly, a single rod, of the same material, heated on one end will have a temperature different from the other end. How is that an intrinsic property when the same object has different temperatures throughout?
Clyde,
The heat is a good example of using intrinsic properties. The heat content of a mass M kg is ρcM, where c is specific heat coefficient. This is a typical product; M is extrinsic, and you multiply by intrinsic variables to get other extrinsic properties (heat content in this case). You don’t usually multiply extrinsic properties like mass. But you can add them – you add masses to get total mass.
If you have a mass made up of parts m_i, you can add up the heat content, sum ρₖcₖMₖ. That’s how you deal with variable temperature; in the limit it is integration. If c was constant, then the proper average would be that integral (or sum of products) divide by total mass. Then the heat content is just Mass times c times that average. So it’s useful.
Temperature is important because it is a potential for heat flow. So an area integral (or average) makes sense as a total potential, as when you add up surface radiation.
Nick,
You didn’t really answer my questions.
Clyde,
On adiabatic compression, I didn’t see the connection. But the IGL is a good illustrator of intrinsic vs extrinsic. pV = nRT. Each side is in total an extrinsic property. V is a specific volume of gas. p is an intrinsic property. n is a number of moles – extrinsic. R and T are intrinsic.
But you can convert it by writing
p = MRT, where M = n/V is the molar density. Then is is an all intrinsic equation.
The two solids of equal volume I did explain. The volumes are extrinsic; you modify with intrinsic density, specific heat coefficient and temperature to get the extrinsic heat content, for which you can write a balance equation.
On your last
“How is that an intrinsic property when the same object has different temperatures throughout?”
that is actually the point about intrinsic. It doesn’t belong to a mass, but to a continuum. Temperature can vary, and a way of measuring it is to work out the heat content in a very small volume around each point. A classic way of measuring density is to take a lump of matter, a spring balance, and weigh it in air and under water. The difference is proportional to density. But it’s actually proportional to average density. It might be varying internally, but you are still measuring something real. You can cut the lump up and measure different parts. That will give a measure of the density variation.
Nick,
Note that at the explanation of intensive v. extensive properties,
[ https://www.thoughtco.com/intensive-vs-extensive-properties-604133 ]
There is a list provided of typical intensive/intrinsic properties. All of the items in the list can be, and often are, used in the identification of solids — all EXCEPT temperature. Whereas hardness is a diagnostic physical property of diamond, its temperature is NOT.
From the above cited article, “While extensive properties are great for describing a sample, they aren’t very helpful in identifying it because they CAN change according to sample size or CONDITIONS.”
Similarly, compressing a volume of gas increases the temperature. Neither temperature alone is uniquely characteristic of the gas, although one might deduce the composition from the temperature ratios.
To me, it is clear that temperature does not belong in the list of intensive properties because it can change, whereas density or elasticity does not. Perhaps it is a poor fit for extensive as well, unless one considers temperature a proxy (or index) for heat content. In that case, adding two identical solids (of the same temperature) doubles the total heat content, just as the mass is doubled. Of course, if the definition of “identical” does not include heat content, but just the intensive properties that uniquely identify the substance, then adding together two otherwise ‘identical’ substances will result in the bulk temperature being the median or mid-range of the two (arithmetic mean for many pieces) pieces.
I think the answer to this problem lies in a careful unit analysis, which I’m not prepared to do at this time.
The oceans heat and cool on different time scales and for different reasons than does the atmosphere. The summing of their average temperatures makes no sense.
Since sunlight drives ocean temperatures, not greenhouse gasses, analyzing the time variance of temperatures at separate depths would tell us physical facts about our changing climate that are not applicable to the atmosphere. The addition of ocean surface temperatures to near-surface (land) atmospheric temperatures tells us nothing. On average, the oceans add heat to the atmosphere.
Clyde,
“To me, it is clear that temperature does not belong in the list of intensive properties because it can change, whereas density or elasticity does not.”
It seems to my you are actually describing “intrinsic” here, rather than “intensive.”
Density can change. Heat water, and it will have a lower density – but maybe you mean it doesn’t change within a system in equilibrium? But neither does temperature.
Wiki:
“An intensive property is a physical quantity whose value does not depend on the amount of the substance for which it is measured. For example, the temperature of a system in thermal equilibrium is the same as the temperature of any part of it.”
This is where people are getting confused about being able to take an average of a quantity like temperature. The system is no in thermal equilibrium, so the definition doesn’t apply. A given amount of air in a South Dakota winter is certainly not going to be the same temperature as that in the Amazon; there’s no problem with averaging global temperatures.
“There is a list provided of typical intensive/intrinsic properties. ” These are not synonymous. Temperature isn’t an intrinsic property of anything. Density is an intrinsic property of some things, but not others (isn’t that right? Diamonds don’t change density when heated, do they?). Hardness is both an intrinsic and intensive property of a diamond.
“Intrinsic properties are dependent mainly on the chemical composition or structure of the material”
(I hope I’m not making a fool of myself here – you guys know more about physics than I; I’m just trying to get the definition right. I think the point about equilibrium is important in terms of global temperature, anyway.)
……………………………..
Regarding the averaging of SST and land temperature, does it make a difference that what’s actually being averaged is the anomalies? And are we sure that they are treated the same, without some kind of conversion factor to make them comparable?
Well Nick at least you keep us skeptics honest. You of course are correct. Since one can not add temperatures, they are an intensive property.
So much B.S., so little time. The issue is averaging air and water temperatures and getting nonsense in a scientific sense.
Keeping them separate would wound the CO2 control knob theory.
Everyone here should regularly visit Bob’s website: https://bobtisdale.wordpress.com/
Please support him by buying his insightful, inexpensive books and donating what you can.
I continue to object to referring to collections of data which have been “adjusted” as “datasets”. The collected data was a “dataset” prior to “adjustment” but is now merely an estimate set.
The data in the dataset might have been in error, but there is no assurance that the “adjustments” eliminated or minimized that error.
Ed Reid,
If you are looking for assurance, perhaps you should read the many published papers documenting why data are adjusted, and what errors are minimized.
Samples (data) are by nature estimates of reality.
I don’t think that even wily economists have gone as far as the climate historians in always revising GDP statistics in one direction and one direction only. Sometimes GDP is revised upwards, sometimes down, but never so predictably in only one direction. Perhaps after losing all credibility in the field of “climate science”, they’ll have a new calling at the Federal Reserve…
In fact, as this article shows, the change from V4 to V5 lowered the trend and the absolute value.
V3b was disappeared. Inquiring (scientists’) minds want to know: What will V6 say?
The science may be settled, but the data aren’t?
Dave, sorry if I wasn’t clear with “The ERSST.v3b data are no longer available there…”, meaning only that the ERSST.v3b data are no longer available at the KNMI Climate Explorer.
The ERSST.v3b data are still being updated by NOAA:
https://www.ncdc.noaa.gov/data-access/marineocean-data/extended-reconstructed-sea-surface-temperature-ersst-v3b
Thanks, Bob.
I was just joking around, not making any statement other than, with data changes over time, how does a scientist calculate anything with certainty? Settled science?
Trend went from 0.034 deg C/decade up to 0.088 and is now down to 0.084…they REALLY rolled-back the pause-busting. if they make only 12-13 more adjustments like that, they’ll finally be back to 0.034!
Of course, that is ONLY for 1998-2014. As the actual paper notes, “The global SST warming trend in the past century (1900–2015) remains essentially unchanged.”
…and the models continue to suck, albeit even slightly worse now with this slight adjustment.
We need to ban all sports, all the fans driving to these events using fuel causing the release of more and more CO2. 😉 And the tailgating and all those grills putting out additional CO2. Fans need to stay home, sit on the couch and control their breathing.
No sex!?! I’ll be damned if I give up sex to protect the planet, Steven!
To me it seems that the main fulling for “pause busters” relies on the short term expectations due to ENSO
internal variability effect in the temp data. The temporary effect of El Nino-La Nina pump on the temps.
Simple question:
“Any body really keeping count of the number of failed El Ninos and failed La Ninas since the last strong proper El Nino???”
Seems to keep going up like never before!
A record in ENSO neutral, in time duration, is a big problem for AGW.
And any signal of an EL Nino condition in the cards, will be used and abused to enhance a fake warming trend.
cheers
What are the trends for the UAH data set?
==========
❶①❶①❶①❶①
❶①❶①❶①❶①
❶①❶①❶①❶①
❶①❶①❶①❶①
==========
How Tamino proved himself wrong.
Tamino has made it clear, that he is a slowdown, pause, and hiatus, denier.
But in a recent post, Tamino has made a stupid mistake.
In his eagerness to show how bad global warming is, Tamino has accidentally acknowledged that the recent slowdown exists.
https://agree-to-disagree.com/how-tamino-proved-himself-wrong
Bob ==> How much of this data set is made up of satellite “sea surface skin temperature” and how much is actual surface water temperature?
Do we have any idea how much these two measures vary in the real world?
Bob, thanks for this article.
I note you say that NOAA/NCEI global temperature dataset now uses ERSSTv5. Are you sure? It still says at https://www.ncdc.noaa.gov/data-access/marineocean-data/noaa-global-surface-temperature-noaaglobaltemp, that for NOAAGlobalTemp (formerly known as MLOST) “The SST dataset is the Extended Reconstructed Sea Surface Temperature (ERSST) version 4.0.”