Does climate vary more from century to century when it is warmer?
Century-scale climate variability was enhanced when the Earth was warmer during the Last Interglacial period (129-116 thousand years ago) compared to the current interglacial (the last 11,700 years), according to a new UCL-led study.
The findings, published today in Nature Communications and funded by the Natural Environment Research Council (NERC) and the Australian Research Council (ARC), reveal that the Last Interglacial period was punctuated by a series of century-scale arid events in southern Europe and cold water-mass expansions in the North Atlantic.
Assessing natural climate variability under relatively warm conditions is crucial to inform projections under future carbon emission scenarios. Professor Chronis Tzedakis (UCL Geography), study lead author, said: “The Last Interglacial is particularly relevant because it provides insights into climate processes during a period of excess warmth.”
The Last Interglacial period contained an interval of intense Arctic warming, with surface air temperatures estimated at 3-11°C above pre-industrial, comparable to high-latitude warming scenarios for the end of this century.
Global sea-level during the Last Interglacial is estimated to have been ~6-9 m above present, with 0.6-3.5 m derived from melting of the Greenland Ice Sheet.
Previously, several North Atlantic and European records have detected century-scale changes in temperature and precipitation within the Last Interglacial, but there has been considerable uncertainty over the timing, extent and origin of these climate oscillations.
This new study by international researchers from twelve institutions used marine and terrestrial geological archives, coupled with climate model experiments, to create the most detailed timeline of ocean and atmosphere changes in the North Atlantic and southern Europe during the Last Interglacial.
To address the uncertainties in comparing records from different environments, researchers produced a “stratigraphic ‘rosetta stone’ by analysing different fossils from the same sediment samples in a marine core off Lisbon,” said Dr Luke Skinner (Cambridge University) who led the palaeoceanographic analyses.
“The marine core also contained pollen transported from the Tagus river into the deep sea, thus enabling a direct comparison of vegetation and North Atlantic ocean changes,” said Dr Vasiliki Margari (UCL Geography), who undertook the pollen analysis.
Changes in vegetation, primarily caused by variations in the amount of rainfall, were then linked to changes in the chemical signature of rainfall recorded in stalagmites from Corchia Cave in northern Italy.
“The Corchia record is particularly important because it is supported by very detailed radiometric dating using the decay of uranium isotopes, producing one of the best chronologies for this period available,” said Dr Russell Drysdale (University of Melbourne), who led the team studying the Italian cave.
Climate model experiments, undertaken by Dr Laurie Menviel and Dr Andrea Taschetto of the University of New South Wales Sydney, revealed that the spatial fingerprint of these changes was consistent with disruptions of the Atlantic meridional overturning circulation.
Greenland ice-melt and runoff as a result of strong high-latitude warming during the Last Interglacial may have contributed to the weakening of the Atlantic meridional overturning circulation and to the observed climate changes.
“Although not a strict analogue for future anthropogenically-driven changes, the profile of the Last Interglacial that emerges is one of enhanced century-scale climate instability, with implications for ice-sheet and ocean dynamics,” said Professor Tzedakis.
“Future research efforts should focus on constraining further the extent of melting and runoff from the Greenland ice-sheet and its effects on ocean circulation during the Last Interglacial.”
###
Source: UNIVERSITY COLLEGE LONDON
The paper: (open access) https://www.nature.com/articles/s41467-018-06683-3
Enhanced climate instability in the North Atlantic and southern Europe during the Last Interglacial
Abstract
Considerable ambiguity remains over the extent and nature of millennial/centennial-scale climate instability during the Last Interglacial (LIG). Here we analyse marine and terrestrial proxies from a deep-sea sediment sequence on the Portuguese Margin and combine results with an intensively dated Italian speleothem record and climate-model experiments. The strongest expression of climate variability occurred during the transitions into and out of the LIG. Our records also document a series of multi-centennial intra-interglacial arid events in southern Europe, coherent with cold water-mass expansions in the North Atlantic. The spatial and temporal fingerprints of these changes indicate a reorganization of ocean surface circulation, consistent with low-intensity disruptions of the Atlantic meridional overturning circulation (AMOC). The amplitude of this LIG variability is greater than that observed in Holocene records. Episodic Greenland ice melt and runoff as a result of excess warmth may have contributed to AMOC weakening and increased climate instability throughout the LIG.
So non-anthropogenic warming is more extreme than anthropogenic warming, oh my!
Took the words right out of my mouth, Steve.
Regards.
Bob
Not only that, but maybe there folks will try to separate natural forcing from human forcing when playing with their models.
Gums sends…
We need to try harder! CO2 isn’t working.
More cow farts! I need more cow farts!
Yeah, but not right in my face.
My cat’s farts are pl3enty aromatic enough, thank you.
Auto
‘plenty’ – sorry.
auto
Also my thoughts. Natural range exceeded current interglacial range. So how is the control of CO2 so powerful when we get O.8 Degrees in 288 for a sudden 40% rise in CO2, then? Nothing to see here, never mind pretend to avoid based on no evidence of a real effect that exceeds natural causes. Just saying.
This is possible. It might be that human land use has a stabilizing effect on climate.
That’s worse than even a pessimist such as I could imagine.
Yawners. Another lame-o attempt by pseudoscientists to connect previous warm periods to today’s “carbon-enhanced” warming. Next.
This cynical comment is unfair and inaccurate. The authors have taken great care to collect, sample, and analyze proxy data from the last interglacial from a high resolution sediment core. Read the methods section; “pseudoscientists” don’t work like this.
On the premise that the last interglacial period could be an analog for the current one, understanding it is valuable for comparison.
That premise and the touting of “excess warmth” invite cynicism.
The proof is in the pudding:
And
Definitely an agenda there.
My thoughts exactly. The “analogue for future anthropogenically driven changes” falls apart because of the ice-core data not mentioned in this study. We have known for more than 20 years that detailed isotopic measurements from ice cores show that T changes 400-800 years before CO2 follows along. Temp is the dog and CO2 is the tail
I give them credit for doing some really detailed measurements from the sediment cores and careful correlation with the cave speleothem record. Good confirmation that the Earth determines its own climatic variations without assistance from us.
They invoke the ‘state-of-the-art’ pseudo-argument for models, as if they are ‘state-of-the-art’ they actually work. They call the garbage models exponentially amplifying garbage inputs as ‘experiments’. That’s an agenda plain and simple. Also a religion, a blind belief in the crystal globe that shows hallucinations. State-of-the-art garbage hallucinations.
Be understanding, without funding no future research. Nobody wants to end up like us, excommunicated and expelled.
Very interesting, says “129-116 thousand years ago” or 13 thousand years, ours 11.700 years. Does that mean we have about 1300 years?
No you have 12 years the IPCC said so 🙂
so as we continue to ride down the hump….weather should get better
http://jonova.s3.amazonaws.com/graphs/lappi/gisp-last-10000-new.png
Nice pic of the Taku Glacier, I think…
Nope.
The Perito Moreno glacier in Patagonia. That is a southern beech in the foreground.
Which big Argentine Andean glacier is growing, despite its frequent ice dam ruptures in its terminal lake.
Likewise the Chilean glacier Pio XI (aka Brueggen), largest in the SH outside of Antarctica. Patagonia is one of the regions with mainly growing glaciers.
Ok, I see where the picture comes from now. I was looking at the water, the Ice and the snowcapped mountains, and not the flora.
Its a beautiful sight. Thanks for the tip.
Just because the climate 130k years ago was different doesn’t make it more variable. Century scale events argue that it was less variable.
Yes, and the 13C and 18O profiles in their benchmark cave show opposite trends before 130kya and then suddenly come into accordance. Quite peculiar. The cave seems very regular at 1mm deposition every thousand years.
You mean to tell me that the rocks at Hallett Cove in South Australia that can show 130M sea level rise over 8000 years means the sea level mightn’t have risen the average 16.25mm a year for all those years? It might have been only 16mm for one decade and then 16.5mm for another? Well I’ll be…! Gaia sure can be a capricious creature sometimes.
We are going to Italy next week . One of our stops will be Ravenna where there are several ancient churches with mosaics from the Byzantine era 1400 years ago. At the time the Churches were built Ravenna was a sea port. It is now 5 miles from the Adriatic.
Some time in the late 1970s a visiting scholar pointed out that the climate in the last 10,000 years has been abnormally stable. This has enabled agriculture and civilization as we know it to develop.
The good thing now is that our resources for dealing with an unstable climate are orders of magnitude better than our ancestors had.
I expect climate 130k years ago had 1/f variability just like our present climate.
The longer you watch the more likely you are to see an extreme event.
This makes people mistakenly assume the climate is getting worse. In reality the climate is unchanged. What is changing is the length of your sample.
So, they admit the oceans can drive major changes in climate.
“The spatial and temporal fingerprints of these changes indicate a reorganization of ocean surface circulation”
Now, if only they would apply that knowledge to recent history.
As usual, my takeaway is different than the intended one for paleoclimate papers. So, the previous interglacial had Arctic temps up to 11C above temperature projections for 2100 based on pre-industrial levels. Ooookay, so then what happened with this colossal warming? Err…we slipped into another 100,000yr glacial period!!!
What this study is really trying to tell these geographer types is that: heat-shmeat, we are going to freeze our asses off eventually anyway as real big climate takes hold.
“As usual, my takeaway is different than the intended one for paleoclimate papers. So, the previous interglacial had Arctic temps up to 11C above temperature projections for 2100 based on pre-industrial levels. Ooookay, so then what happened with this colossal warming? Err…we slipped into another 100,000yr glacial period!!!”
It also means there is no tipping point with respect to runaway heat.
Agreed, and also – yet we are still here. No tipping point!
“Assessing natural climate variability under relatively warm conditions is crucial to hyping baseless, bullshit projections about future carbon emission scenarios.”
There, fixed it for ’em.
“Professor Chronis Tzedakis (UCL Geography), study lead author, said: “The Last Interglacial is particularly relevant because it provides insights into climate processes during a period of excess warmth.””
“EXCESS warmth?! The climate is what it is, and the ridiculous assertion that any climate different than the (if anything) anomalously COLD current climate constitutes an “EXCESS” of warmth exposes this as not “science,” but “activism.”
Of course, I knew that as soon as I saw it was published in “Nature PROPAGANDA, er… COMMUNICATIONS.”
We can’t even agree on what the actual temperatures were just 150 years ago in any detail for much of the planet when my great grandparents were alive. What likelihood is there that a few proxies here, a few proxies there, has any actual validity as to what was actually happening in any detail 125,000 years ago? The more I learn about modern day climate science, the more suspect I am about what actually happened in any detail with regards to the distant past. Maybe in very wide generalities.
I think we put far too much faith in science and just accept blindly without much evidence what we are told happened so long ago, because of ‘experts’ who declare something. The deceit in modern day climate science as expressed by those with an agenda and socio economic designs on humanity and politics just taint my understanding of many other branches of ‘soft’ sciences now.
“We can’t even agree on what the actual temperatures were just 150 years ago in any detail for much of the planet when my great grandparents were alive. What likelihood is there that a few proxies here, a few proxies there, has any actual validity as to what was actually happening in any detail 125,000 years ago?”
Proxies are SWAGS, nothing more. Even ice core data, which supposedly show that CO2 lags temp by ~800 years is probably pretty far off.
Had to look that one up…lol SWAG…Scientific Wild Ass Guess
Is there anything good about this paper?
No, not a rhetorical question. If we filter out all the obligatory Global Warming BS, is there any good data underneath?
They make quite the claim, that the last interglacial was more variable than the current one. Then they say:
“The strongest expression of climate variability occurred during the transitions into and out of the LIG.”
Well, we know that transitions into and out of interglacials are marked by what we would call extreme variability. We also expect that the warmer it is, the less variability there is, due to the lessened temperature difference between the equator and the poles. Did they then use a model to “homogenize” the variability from the ends of the interglacial into the middle, more stable portion?
With all this aside, there is probably some good paleo data here, if indeed it is new, and not just another “reanalysis”.
“is there any good data underneath?”
Yes, but there is no new data. This has all been well known for at least a decade. If you read the paper you will notice that these cold intervals already have generally accepted stratigraphic names: C24 to C28 (“Cold 24” to “Cold 28”). I’m not sure when they were introduced, but at it must be at least 15 years ago.
Thanks for the extra info.
““Although not a strict analogue for future anthropogenically-driven changes,”
Objection! Assumes bullshit (anthropogenically-driven changes) to be fact.
“the profile of the Last Interglacial that emerges is one of enhanced century-scale climate instability, with implications for ice-sheet and ocean dynamics,” said Professor Tzedakis.”
So climate is more stable now than in the past when they can’t possibly blame it on fossil fuel use. Interesting how whatever they find, it always is used to perpetrate the “human-induced catastrophe” nonsense.
What I get from this is the climate is far more variable, both in terms of the temperatures at any point in time and the variability of “climate” in all its components, than we are experiencing today. Which means they can pound all their claims of anything “unprecedented” going on where the sun doesn’t shine.
Conclusion not surprising. From Antarctica ice core data: Temperature increased above today’s ~131 kyr ago; peaked several degrees above today’s ~128 kyr ago; decreased several degrees; then increased ~124 kyr ago; then steadily decreased into the glaciation. Depending on the ice core, polar temperature was above today’s for ~10 kyr.
By contrast, temperature over past ~8 kyr of the Holocene has been a slow decrease, without the variations apparent in Eemian ice core data.
Perhaps the Younger Dryas meteor impact put a damper on the Holocene, producing a slower decrease.
From a philosophical point of view I wonder if civilisation could have evolved under any other circumstances.
I remember reading, about 3 decades ago, a very interesting article in the Toronto Star about the “Sangamonian Interglacial”. Climate zone boundaries were discovered to be much further north than their current positions as their was tremendously abundant evidence indicating it was much warmer then than now.
Given the academic climate community’s expressed concern on the current “warming” why would a newspaper of such standing (among others) not report on this now?
It is perfectly well known that the Sangamonian/Eemian interglacial was much warmer (up to 10 degrees C in the Arctic) without any catastrophic effects (e. g. no methane release as the permafrost melted).
However it is definitely not mentioned in MSM nowadays.
The key takeaway point from this study is to understand how weather interacts with climate. Because if the climate was more variable during the last LIG then that means the weather patterns were more static during the LIG.
In order to get stable climate there needs to be highly variable weather as this is the cause of a stable climate because it avoids the extremes in climate from forming. So the climate becoming more arid in southern europe during these events, meant the weather had became more prone to blocking in this area and so deducing the amount of rainfall that took place. So the take home point from this study is that the weather patterning was more prone to become static during the LIG over the area in question in this study then it is current warm period.
Assuming the data is accurate, that it has been interpreted effectively and that there are no relevant unknowns (always a consideration) that might render the study useless, there appears to be something in this study for everyone:
CAGW adherents can show evidence of raised sea levels (with all the appropriate implications) and more, related to higher temperatures, and,
sceptics can point out that higher temperatures than those we’re experiencing and we’re being warned to expect, somehow occurred without fossil fuel users lending a hand. What’s not to like . . ?
This one appears to be worthy of some very close examination.
I find it amazing that an article such as this has as its purpose to know what we might be in for in this supposed era of human induced warming while at the same time this article proves that natural cycles dwarf any human influence.
I’m looking for a wall to bang my head against.
“Climate model experiments, undertaken by Dr Laurie Menviel and Dr Andrea Taschetto of the University of New South Wales Sydney, revealed that the spatial fingerprint of these changes was consistent with disruptions of the Atlantic meridional overturning circulation.”
First off “Climate model experiments” …. they are OK are they now ?
Do we have any “disruptions of the Atlantic meridional overturning circulation” identified in the Holocene?
This study ….
Says:
“Abrupt changes in climate have occurred in many locations around the globe over the last glacial cycle, with pronounced temperature swings on timescales of decades or less in the North Atlantic. The global pattern of these changes suggests that they reflect variability in the Atlantic meridional overturning circulation (AMOC). This review examines the evidence from ocean sediments for ocean circulation change over these abrupt events. The evidence for changes in the strength and structure of the AMOC associated with the Younger Dryas and many of the Heinrich events is strong. Although it has been difficult to directly document changes in the AMOC over the relatively short Dansgaard-Oeschger events, there is recent evidence supporting AMOC changes over most of these oscillations as well. The lack of direct evidence for circulation changes over the shortest events leaves open the possibility of other driving mechanisms for millennial-scale climate variability.”
So plenty of changes in the Holocene too … as should be expected in a transition out of Glaciation.
None of which invalidates warming due to anthro increases in GHGs over the last ~150 years – the forcing of which only really overcame -ve natural ones (>1 W/m^2) in the 1970’s – and then interrupted by several volcanic aerosol events …..
The difficulty in explaining those coolings as being due excessive melting of Greenland ice is that there is very strong evidence that arctic ice caps grew, not melted, while they were happening:
https://www.researchgate.net/publication/320750356_Eemian_estuarine_record_forced_by_glacio-isostasy_S_Iceland_-_link_with_Greenland_and_deep_sea_records
I would say this is a pretty clear case of agenda science.
It has been clear for quite some time that there were marked cold/dry oscillations in the early Eemian, at least in the North Atlantic area. Note that all these ‘newly discovered’ cold intervals already have generally used and accepted stratigraphic names (C24 to C28)
Here is a ten year old paper with well-nigh identical results but without the CAGW flourishes:
https://www.whoi.edu/fileserver.do?id=23643&pt=2&p=18528
However that these cold episodes were due to “Greenland ice-melt and runoff“ is patently ridiculous since sea level declined during the cold intervals and arctic ice grew not melted. Which is hardly unexpected by the way:
https://www.researchgate.net/publication/320750356_Eemian_estuarine_record_forced_by_glacio-isostasy_S_Iceland_-_link_with_Greenland_and_deep_sea_records
And it is depressing to see that “6-9 meter sea-level rise” being hauled out again and again. It is a AGW factoid with essentially no factual support. Actual study of tectonically stable last interglacial coastlines suggest about 4-5 meters is more likely:
https://www.researchgate.net/publication/322843264_The_last_interglacial_MIS_5e_sea_level_highstand_from_a_tectonically_stable_far-field_setting_Yorke_Peninsula_southern_Australia
https://www.researchgate.net/publication/228565750_Relative_sea-level_fall_since_the_last_interglacial_stage_Are_coasts_uplifting_worldwide
Why is this important for CAGW? Because it is essentially impossible to suggest “collapse” of the West Antarctic ice-sheet with less than about 7 meters sea-level rise.
This study ….
https://www.annualreviews.org/doi/abs/10.1146/annurev-marine-010816-060415
Anthony,
That study concerns the last glacial interval, not the Eemian interglacial which preceded it.
D/O and Heinrich events during glacial phases might share some causes with Bond cycles during interglacials, but the magnitude of warm and cold snaps is larger during glacials.
Heinrich events, ie armadas of icebergs released into the North Atlantic, associated with the coldest interval during glaciations, might be caused by ice shelf collapses (as perhaps off Labrador), or some other surge of land ice into the ocean, as from the outlet to Hudson Bay under the Laurentide Ice Sheet or similar outlets on the other side of the Atlantic. When the freshwater from these bergs melts, it puts a lid of cool, less saline water over the North Atlantic, easing sea ice formation and affecting circulation patterns.
Or it might be the other way around. Changes in ocean circulation might destabilize ice shelves. Or it might be secular changes in tidal amplitudes that does it.
Hope we don’t have to wait for the next ice sheet advance to figure out what causes HEs.
To me, they look like icy versions of the cold meltwater events during deglaciation which probably caused the YD and 8.2 Ka cold snaps.
It’s remarkable how icy was the North Atlantic during the Last Glacial Maximum and other of the coldest stadials. This, combined with much lower sea level, spawned the Solutrean hypothesis to explain the (much later) Clovis Culture in North America.
“Century-scale climate variability was enhanced when the Earth was warmer during the Last Interglacial period (129-116 thousand years ago) compared to the current interglacial (the last 11,700 years), according to a new UCL-led study.”
That’s impossible. CO2 was lower during the last interglacial so the temperature had to have been lower.
That’s what the models say and models are never wrong. (Genuflect towards the computer)
‘That’s impossible. CO2 was lower during the last interglacial so the temperature had to have been lower.
That’s what the models say and models are never wrong. (Genuflect towards the computer)’ But, ‘This Time It’s Different” don’t cha know.
Excerpted from published commentary:
But, but, but, …… just prior to the Last Interglacial period (129-116 thousand years ago) atmospheric CO2 was below 200 ppm …… and then the CO2 increased to about 280 ppm for a short time as the Interglacial temperatures increased …… and then began its decline down to about 180 ppm (see following proxy graph) at the Last Glacial Maximum at 21,000 YBP.
CO2 proxy graph for the past 800,000 years
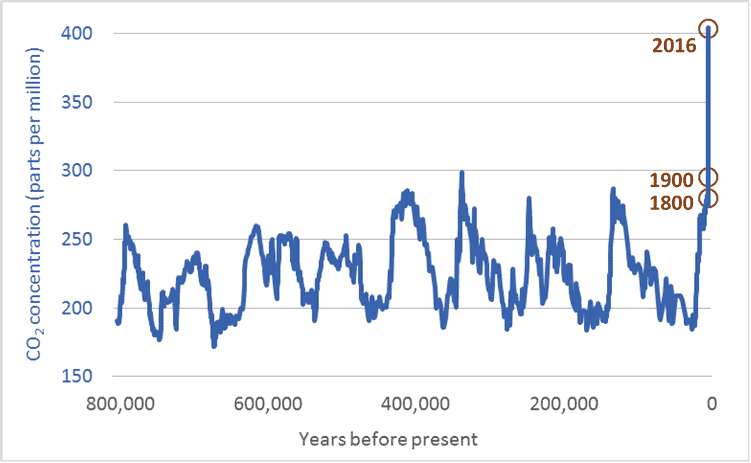
So geeeeeze, …… given the fact that there were not tens-of-millions of humans burning fossil fuels during the past Interglacial, …… just what caused that high-latitude temperature increase of 3-11°C?
Was the “cause” the same as it was for the 2.5° to 7.0°C “warmer-than-modern” high-latitude temperatures that occurred during the current Interglacial, ….. between 9,000 and 7,000 YBP?
“Yes”
In both cases it was the sun of course. More sun at higher northern latitudes due to orbital changes.
CO2 just tails along. About 800 years later at the beginning of an interglacial and about 5,000 years later at the end.
Just quickly and as best I can, they are saying (estimated most of the time) that The Main Action happened towards the end of the interglacial. Circa 115ky ago.
Main action being the extended droughts and decline of the trees and presumably the ‘interval’ of (estimated) 11 degC warmth.
And all along, no mention of what actually caused anything. All they have is a list of occurrences and the reader is left to puzzle out what happened. Aided and prodded into a particular Conclusion Jump with talk of something similar happening now.
The dirt did it.
It wore out, got weathered and eroded and washed out to sea. Or blew away and mostly landed in the sea.
Surely, extended droughts, big temperature variations tell of a big desert coming into existence. The dirt was wearing out, the trees were struggling and catching fire. Like SoCal now.
Once they start burning, that is it. End Game. Desert.
And deserts are cold places. Maybe have high temperatures at mid-day but have next to zero heat storage. No thermal inertia. No trapped heat. haha.
And once the desert extends far enough North, winter ice & snow melt later and later in the year, effectively creeping South.
Enter the Ice Age.
And they tell us that when they say xyz all occurred barely 1,000 years before the ice cover was complete.
Warmists really do want to be careful with what they wish for. Their assertion, that everyone becoming vegetarian will slow climate change, is flat out wrong.
Why.
Because they are asking farmers to accelerate the rate of soil erosion growing these veggies.
The buffalo knew how to manage dirt, as did the people who lived with them.
Did anyone ask (what’s left of) them?
And we know that farming is eroding the soil – Global Greening is in part** caused by dust coming off dry farmland (rich in potash & phosphate) landing on places that have never known the stuff in such quantities.
**In part because nitrogen and sulphur oxides do the rest.
And their blind insanity is complete with the assertion that burning biomass will be a saviour also.
It’s impossible to be more wrong.
“Century-scale climate variability was enhanced when the Earth was warmer during the Last Interglacial period (129-116 thousand years ago) compared to the current interglacial (the last 11,700 years), according to a new UCL-led study.”
University College London
But here we are being told that all our variability is entirely due to us. And we can fully control our climate.
From a former post: Warm is stable – Cold is change https://wattsupwiththat.com/2017/08/01/warm-is-stable-cold-is-change/ the following graphic:
Colder periods generally show a higher temperature variability than warm periods.
And from the Abstract of the Tzedakis study above: “The strongest expression of climate variability occurred during the transitions into and out of the LIG”
The authors also could have concluded:
1. Here it is shown that without any human influence the natural variation during the Eemien outpaced Holocene temperature fluctuations
2. Given the strong Little Ice Age cooling (century scale) and comparable strong recent warming (century scale) the Earth possibly/probably started the transition into the next geological stage: the next glacial. As we know, such transitions are characterized by a larger natural variability, exactly what we have seen the last centuries.
Oh!?
And how did they “prove” that correlation?
Answer, they didn’t; it’s all make believe and confirmation bias.
Well, state of the art in climate models is that every climate is wrong. So, this model is state of the art amongst climate models.
It is how they brought confirmation bias into their fantasy and promptly blamed Greenland and the Arctic’s melt on dangerous warming.
But, the Arctic’s temperatures are quite normal every summer, and Greenland is accreting ice, not melting catastrophically.
I wonder why they didn’t mention Antarctica warming?
Likely because the only part of Antarctica warming up, currently, is the human occupied West Antarctic Peninsula.
Just another climate model delusion.
The Younger Dryas put a damper on the Holocene, slowing down our fall from grace.
Way too many assumptions and weak projections being made on very flimsy evidence. It’s far more complicated than they are assuming it to be and their analysis is no more than a wild guess.
Was there greater natural climate variation during the last interglacial, or is it that we just havent seen the full variation in the current one?
Whenever I see the words, ” Computer model says”I turn off. They are just modern day chrystal balls, and can only tell their users just what those same users programme them in what to say.
What did researchers in matters of weather and climate do before computers. Was it a sort of Dar k Ages in research, or did it produce some really good results. ?
MJE
“Last time it happened naturally, therefore this time. It’s being caused by us.”
Fail.
Richard Lindzen is right.
Climate changes BY ITSELF.
From internal dynamics.
Even with NO OUTSIDE FORCING.
Try to get this.
Erratum
How did that full stop get between the “time” and “it’s”? Shouldn’t be there.
This is a good and meticulous palaeoclimate study. This is real climate science.
We can graciously ignore the AGW genuflection.
The true implications of this clear demonstration of natural climate oscillation is there for all to see.
Typical of genuine research discoveries, it raises a question and paradox – which itself has the potential to lead to further deeper insight. The paradox is this: we know that during glacial periods climate is less stable and more variable. The extreme and violent Dansgaard-Oesger oscillations (“micro-interglacials”) – 5-10 degree C up and down fluctuations in a few centuries – happen during glacial, not interglacial periods.
So generally, climate is more stable during interglacials. But this new research points to warmer interglacials having more variability (eg Eemian) than cooler ones (eg Holocene). Curious and counter-intuitive. WUWT?
What in hell is a “Climate model experiment” other than an oxymoron? Surely, it is nothing more than playing around with input parameters in a theoretical model to produce theoretical outcomes based on predetermined formulae and transfer functions. It is certainly not an “experiment” in the scientific sense of a physical experiment to obtain new, real empirical data.
Is how science dies?
Before we all get too excited, this isn’t news. We knew this from the ice cores.
Simply plotting the last 4 glaciations on top of each other shows why this was blindingly obvious, the last interglacial warming period was known to be inhibited by the extreme cooling events of the older and younger Dryas (of unknown cause but the Milankovitch eccentricity believed to be causal was at its lowest variability for this last interglacial warming) ). The Dryas events returned atmospheric temperatures to the lowest glacial levels while the oceans continued to thaw, as shown by the continuous increase in sea level throughout both events. AS a result the maximum warming that prior ice ages had realised was never reached in the last, and “normal ” interglacial service was delayed by 3-4,000 thousand of the normally warmest years, hence sea levels did not reach their highest levels either. Ours is a rather runtish interglacial. Fact. Obs.
You don’t need a Harvard degree to figure out the blindingly bleeding obvious, see graph. (i). However corroboration by another proxy temperature measurement is helpful when disabusing the climate alarmists of their delusional beliefs that humans are having any noticeable effect of the serious planetary scale business of climate change, based on no real date a, proxy or otherwise, just massively biased models that don’t predict reality because of their mostly incorrect pesumptions as to cause and effect. Here’s the evidence, for those with more opinions than facts. Plot your own from Petit et al and the other named series if you doubt them. Enjoy!
(i) Unless you are a second tier climate so called scientist , hard of physics, in search of unachievable credibility for your unprovable pseudo science, and in need of another grant fix to avoid getting a real job.
Brian
It’s a correct observation that our interglacial is “runtish”. And an interesting idea that the aYD is responsible. I agree that this is possible but would approach it from a different angle.
For one thing, like Margaret Thatcher and society, I don’t believe there is such a thing as the YD. What was real was the Bolling-Alerod (BA) – the warming peak that forms the early bound of the YD. The BA was simply the last DO event. There were 19-20 such events during the last glacial interval. During the extreme and violent Dansgaard-Oesger oscillations (“micro-interglacials”) NH temperatures rose then fell by 5-10 degree C in the course of just a few centuries.
The BA was – in my thinking – a DO event that happened just as glacial termination had begun (with Antarctic Ocean warming). Thus the “YD” is simply the interval in time between the last DO / BA event and the subsequent abrupt glacial termination. Thus the BA was not glacial termination that was aborted by the YD. Instead it was a DO event just before glacial inception.
If so, then you still have a fair point – why did the Holocene end up being runtish – with a weak and delayed warm optimum compared to other interglacials like the Eemian? I would agree that the “YD” phenomenon (abortive followed by stable glacial termination) did sabotage the Holocene. But I would guess that it did so by a resonant effect – by introducing a resonance or harmonic toxic to rapid and strong interglacial inception. Thus the cool interglacial. Oddly the coolness of the Holocene might have made it more stable, if the research reported above in this post is to be believed.
Yes sea level did continue to rise during the “YD”. Which tells us that the sea level rise and “YD” were separate oceanographic processes. Sea level rise was associated with slow Antarctic Ocean warming that had begun 20,000 years ago. It was a global event and the larger and more powerful process, not affected much by the YD, which was a NH only phenomenon and likely linked to an excursion of the AMOC / Gulf Stream.