Steve McIntyre has a look at the “revised” PAGES2K temperature proxy dataset that includes tree rings and river sediments. He finds the usual ridiculous problems from the past, such as upside down data and river sediment accumulations that have more to do with building a dam than climate.
Excerpts:
New Proxies
There were three “new” proxies: one tree ring series and two lake sediment series. In addition, two tree ring series were updated.
New Tree Ring Proxies
The”new” tree ring series (CAN Composite 15) had, like the other series, been in the Neukom and Gergis 2012 network. For some reason, it had been screened out of the PAGES 2013 network, but now determined to meet the PAGES2K criteria after all. Of the original 63(!) tree ring chronologies in the Neukom and Gergis 2012, only four(!) made their way into the PAGES2017 network. I do not believe for a minute that these four tree ring chronologies are unique thermometers. A more likely interpretation is that their satisfaction of proxy criteria was fortuitous and that they are no more trustworthy as thermometers than the excluded chronologies. Nor did any of these four chronologies reach back to the medieval period: their start dates ranged from 1435 to 1636, start dates, long after the medieval period.
Interestingly, the fresh data in the two updated tree ring series further illustrates the ineffectiveness of these South American tree ring chronologies as temperature proxies, as shown in the plots of Central Andes 6 (CAN 6) and Central Andes 9 (CAN 9) below.


CAN9, which is barely over 300 years long, has high values in mid-20th century, but declines in the last half of the 20th century despite temperatures increase. Its late 20th century decline continues into the 21st century, where values have reverted to the long-term mean. Similarly CAN6 has had little longterm change, but had a late 20th century spike, but has regressed to low values subsequently.
A more plausible interpretation of the data is that these four series were selected ex post because their 20th century values were somewhat higher than values in earlier centuries, but are not magic thermometers.
…
The tree ring component of this network is, more or less, a reductio ad absurdum of tree ring chronologies as useful temperature proxies: only four of 63 original tree chronologies have sufficient Hockey Stick-ness to be retained in the network, with even these poor remnants reverting to the mean in the 21st century updates. There is negligible similarity between the three lake sediment series, each of which uses a different indicator, though similar measurements appear to have been taken for all three sites. The only series with a meaningful HS (Chepical) appears to result from construction of a dam in 1885AD, rather than from increased temperature. This leaves the Quelccaya ice core series – which was a staple of temperature reconstructions as early as 1998 and, which, ironically, was used upside down in PAGES2K (2013), corrected in PAGES 2017 without disclosure/admission of the earlier error.
All in all, a rather pathetic show by PAGES2K.
Read the full analysis here at Climate Audit
Kudos again to Steve. AGW is Lysenkoism.
To deny Progressive Lysenkoism is to deny science. If that is true, and they vigorously assure us that it is, then how do they define “science”?
“Paging Dr Mann, paging Dr. Mann,
Code Green, Code Green, your Nature Trick is needed
In the Tree Lab, stat!”
Thank you Steve and Bravo Joel!
Some history:
http://wattsupwiththat.com/2012/05/18/the-question-put-to-dr-mann-at-disneyland-today/#comment-989607
Davidmhoffer
Sin7; Dr Mann claims that Phil Jones reference to “Mike’s Nature trick” was out of context and only referred to clever but proper handling of the data.
Reality; Dr Mann truncated tree ring data from his paper submitted to Nature because it began declining, rather than rising like a hockey stick. He patched in instrumental data instead, without explaining what he had done. This was the “trick” that he used to “hide the decline”. Having now been caught, Dr Mann reluctantly admits that the tree ring data goes in the opposite directionh to the instrumental temperature record for nearly half of the instrumental record. Despite this, Dr Mann continues to claim that the previous 900 years of tree ring data (which cannot be corroborated) accurately represent temperature.
****************
More on “the Divergence Problem”, “Mike’s Nature Trick” and “Hide the Decline”:
It took eight years before the “Divergence Problem” was revealed, also in testimony. Mann grafted modern surface temperature data onto earlier tree ring temperature proxies to produce his upward-sloping “hockey stick” graph. Grafting together two different datasets is usually NOT good scientific practice.
Why did Mann do this? Because if he had exclusively used tree-ring data, the blade of the hockey stick, instead of showing very-scary warming in the last decades of the 20th Century, would have shown COOLING.
The correct scientific conclusion, in my opinion, is that using tree rings as a proxy for temperatures is not sufficiently accurate for the major conclusions that were drawn from the Mann studies.
Mann and the IPCC were clearly wrong about the hockey stick – the only remaining question is not one of error, it is one of fraud.
For more on the public revelation of the Divergence Problem in 2006, see
http://climateaudit.org/2006/03/07/darrigo-making-cherry-pie/
“The discrepancy between the forecast and the actual caught Cuffey’s eye and he asked D’Arrigo about it. She said “Oh that’s the “Divergence Problem”‘?. Cuffey wanted to know exactly how you could rely on tree ring proxies to register past warm periods if they weren’t picking up modern warmth “questions dear to the heart of any climateaudit reader”.”
Have you ever considered the possibility that the tree ring data is a better reconstruction of temperatures than is the heavily adjusted and bastardised thermometer record.
Everyone rushes to dismiss tree rings as good temperature proxies because of the divergence issue. Whilst tree rings do not respond exclusively to temperatures, perhaps the divergence issue is primarily the fault of our thermometer temperature reconstructions, which themselves are not a good proxy for global temperature, Perhaps even given the warts of tree ring proxies, they may be a better proxy for temperatures than the heavily adjusted and bastardised thermometer record.
In my opinion we need to test the thermometer record by identifying say the best 200 sited stations which are completely free of environmental changes and have good historic records and practices, and then retrofit these stations with the same type of LIG thermometer and the same type of enclosure painted with the same type of paint as was used by each individual station back in the 1930s/1940s and then take readings using the same TOB as used at each station.
One would then get a series of 200 individual records of modern day unadjusted RAW temperature data that could be directly compared to the stations own past historic unadjusted RAW data. One would not try and make some hemispherical or global construct, just compare each station with itself and see what changes had occurred from that station’s historic highs of the 1930s/1940.
We would quickly know whether there has been significant change. Further since about 97% of all manmade CO2 emissions have arisen since the 1930s, this would cover the most useful period to see what impact rising CO2 may have had on temperature.
that would be a great idea if determining a better temperature record was desirable richard. i have a funny feeling that is the last thing the climateriat want. the current mish mash of records suits their purpose to a tee. for instance, everyone at best would be out of a job if we had real numbers to work with as opposed to mathturbation.
Using the width of tree rings as a reconstruction of temperature is absurd. Tree rings are subject to any number of external factors. Among them: the availability of water. competition with other vegetation. the composition of the vegetation ( some plants excrete chemicals that inhibit the growth of other plants and some help). nutrients. altitude. range of the plant ( how far north or south). the orientation of the plant to the sun ( which side of the hill)
The scientific way of determining temperature from tree rings is isotopic bonding.
The thing that is going to kill AGW is apathy. They said so at the recent love fest in Korea.
AGW has made predictions, set deadlines, and shrilled on about it. Then nothing happened.
NOBODY CARES.
It’s as if most normal people reached the same conclusion at the same time. No matter how much the media goes on about it, NOBODY CARES. As if I’m going to vote for the moonbeam here in Colorado that his agenda is to drive up the cost of electricity to $1200/month. The clear and present danger of developing hypothermia out weighs some fuzzy, hocus pocus math that maybe someday….. yep, it snowed on the 10th of October, 2018 and Sunday it is suppose to snow again with lows in the teens. I don’t feel guilty turning the heat on at all.
rishrac, my sense is that AGW will indeed be killed by apathy. People really don’t give a crap and they’re for carbon taxes like they’re for a bullet in the head, and they’re not about to let do-gooders impose it on them.
Nothing is happening. It’s just weather. I think people intuitively understand that, even if they give lip service to the consensus.
We’ll see how this winter shapes up. My guess is that people will realize that the IPCC has been crying “wolf” all along, and it’s time to ignore them. It was never about the science in the first place.
Don132
[youtube https://www.youtube.com/watch?v=AihvuZiDhsg&w=1000&h=563%5D
One never knows what that tree has actually experienced.
Trees, as with most plants respond to multiple conditions:
Food,
Moisture,
Light,
Temperature,
Carbon Dioxide,
Damage; damage to cambium layers as caused by animals, insects, rock or tree fall, and storms.
Where is the corroborative proof that any particular tree responded to temperature, versus any of the other critical conditions?
While, it might be claimed that trees are a better metric than the very problematic and cherry picked modern temperature record; that fails to prove that either of the metrics is sufficient for the tasks assigned.
That thermometers respond directly to temperature, while it is yet to be proved that trees, or any specific tree, responds solely to temperature during every year of it’s life, rejects using trees as a temperature metric.
Exactly. A tree ring tells you how good, or not, the local conditions were for that year. There is no way that you could tease out which of the many factors were limiting in any particular ring, using only the ring’s width or density. Then there’s the possibility of double rings due to a major stress during a year, such as an untimely frost or fire. Let us also keep in mind survivor bias.
ATheoK,
Tree species respond differently to precipitation and temperature. Some respond to the latter, some to the former, some to both. Selection of the right species for proxy records is key.
If there is a major change in light, that should be sudden and visible over years. Normally you wouldn’t see a big change in nutrients. Temperature and precipitation are the main factors.
Other proxies are used, too.
cdquarles,
“There is no way that you could tease out which of the many factors were limiting in any particular ring, using only the ring’s width or density.”
This is not true.
There are statistical procedures to differentiate which environmental factors affect the growth of the trees. The PCA that Mann et al. used, for example, extracts signals due to different variables.
A review of recent history of GISS fiddling since 1998 under Hansen. It was In WUWT early on. At the time, 1998 spike did not set a new record and 1937 held the record certainly in US, Canada, Greenland, Scandinavia… and later discovered, in SouthAfrica, Uruguay, Ecuador… (Paul Homewood). In 2007, before Hansen’s retirement they finally pushed 1930s-40s down half a degree and in the process erased the 40 yrs cooling spell that followed the high. The truth is all the warming to date took place prior to 70yrs ago before manmade CO2 could have had a significant effect.
“The truth is all the warming to date took place prior to 70yrs ago before manmade CO2 could have had a significant effect.”
There it is! Boiled down to its essence.
And that’s what the Climate Charlatans were trying to hide with their surface temperature chart manipulations. If they show the 1930’s as being warmer than today, then people would start wondering where the problem is since nothing unprecedented is going on with the temperatures. So they ginned up a fake surface temperature chart to make things look like there is unprecedented warming going on.
It’s all a lie. A deliberate lie (see Climategate).
Gary,
” The truth is all the warming to date took place prior to 70yrs ago before manmade CO2 could have had a significant effect.”
Ummm, how do you figure? This is such a remarkable statement that you really need to back it up with evidence.
(Tom Abbott,
“So they ginned up a fake surface temperature chart to make things look like there is unprecedented warming going on.” This is another assertion that needs very ample evidence to be even remotely credible. Who is “they”? Do you think the whole thing is a world-wide conspiracy? Do you have any idea how difficult that would be to pull off?)
“Have you ever considered the possibility that the tree ring data is a better reconstruction of temperatures than is the heavily adjusted and bastardised thermometer record.”
no…because two adjacent trees can have totally different rings
Latitude has it , have been cutting wood for home heating for over 20 years and depending on the species the growth rings differ amazingly.
If I wanted to get samples of good even growth over 60 years plus it’s not a problem and if I want the stuff that has irregular growth patterns and has had a hard life in some years it’s easy as and this is the timber I usually prefer because I’ve found it burns longer .
“two adjacent trees can have totally different rings”
Well, yes. But scientists are not so stupid that they are just going to cut down and few adjacent trees and say, There you have it!
that’s right kristi, i believe a certain scientist only needed one tree 😉
Good work, Allan, and good on Climate Audit. Professor Mann appears to not only have merged two data sets to show the current Warm Period, but also to show an acceleration in the warming. The problem, pointed out by geologists, is that there is no climate change signal observable against the normal background noise (variations in sea level 50 meters higher and 100 meters lower are normal in the geologic record). Ergo, Professor Mann constructs a signal showing unusual acceleration (in the merged temperature record).
“It took eight years before the “Divergence Problem” was revealed”
That is incorrect. It was “discussed” in the literature at the time, but only glossed over and dismissed as insignificant. It certainly wasn’t shown prominently on graphs, and some data was truncated to “hide” it.
Jeff,
It obviously wasn’t insignificant when it came to temperature reconstructions using dendrochronology.
I believe that was my point.
“Grafting together two different datasets is usually NOT good scientific practice. ”
I think you’re being too generous there, Allan. I was thinking more along the lines of
“Grafting together two different datasets is a scientific incompetence.”
Allan
The divergence problem was known years before the hockey stick came out.
https://agupubs.onlinelibrary.wiley.com/doi/abs/10.1029/95GB00321
More info is here:
http://science.sciencemag.org/content/267/5204/1595
And Briffa had already published about it:
“During the second half of the twentieth century, the decadal-scale trends in wood density and summer temperatures have increasingly diverged as wood density has progressively fallen. The cause of this increasing insensitivity of wood density to temperature changes is not known, but if it is not taken into account in dendroclimatic reconstructions, past temperatures could be overestimated. ”
https://www.nature.com/articles/35596
Because many proxies were used in the hockey stick, it’s not true that it can’t be corroborated that they accurately represent earlier temperatures. Furthermore, the same pattern has been found by several independent researchers since.
Fraud? No. Not at all. It was a mistake not to make clear in the caption that the instrumental record had been combined with the proxy record, but that’s not fraud, and I’m not even sure if that was their mistake or the report’s. It was discussed in the text, I believe.
It’s not Mann’s fault if Cuffey hadn’t read the literature.
You are entitled to your opinion, but that’s all it is.
Kristi writes
Have you looked closely at proxies Kristi? You should. If you’re genuinely open to changing your ideas then look into them and you’ll realise that they’re at best a vague indication of the conditions surrounding them and definitely not temperature “readings” where one might accurately compare to today’s conditions to the nearest tenth of a degree.
Frequently there are documented confounding factors which are ignored. McIntyre’s investigation of the Laguna Chepical sediment proxy being a case in point.
The Author of the paper from which it was taken noted
But the authors chose to ignore it.
An additional, potentially important environmental variable was the construction of the earth dam in AD 1885. However, as indicated by cluster analyses, the construction of a low (ca. 2 m) earth dam and the subsequent relatively small increase in maximum lake depth did not significantly affect most of the sediment properties measured with VIS-RS scanning and had no influence on the R570/R630 values. Therefore, the reconstruction of summer temperatures based on calibration-in-time, which was developed for the period after dam building, is also valid back in time.
Seriously? Damming a river doesn’t impact its flow and sedimentation?
McIntyre notes the the proxy started a steep “temperature” increase at the time it was dammed.
Call me skeptical.
“TimTheToolMan”
Proxies are not intended to be a direct substitute for temperature readings from a modern thermometer. They are estimates – just as some temperature readings from older thermometers are. When there are multiple types of proxies used and they support each others’ estimates, there is a very good chance that they are producing reasonable estimates. Of course, the error (uncertainty) must be taken into consideration.
I’m assuming the paragraph “An additional, potentially important … is also valid back in time” is a quote from the paper.
This suggests that they did not in fact ignore the dam at all, but tested to see whether it would affect their results.
Once this was determined, the skeptical approach would then ask why McIntyre believes, ” The only series with a meaningful HS (Chepical) appears to result from construction of a dam in 1885AD, rather than from increased temperature” since he did not explain his reasons for thinking so.
Skepticism should not be applied only to the data or results one doesn’t want to believe, or it is simply bias.
Kristi writes
You may not believe me but the thing is that McIntyre has probably as much knowledge on proxies as anyone in the world. He’s also a statistician. So when he says he cant see how cluster analysis can prove the dam didn’t impact the sedimentation rates independently of temperature, you’re dealing with as knowledgeable an opinion as you’ll find anywhere.
Pages2K didn’t explain their reasoning behind their claim either.
Regarding your comment “Skepticism should not be applied…” ironically Pages2K is heavily biased towards finding AGW whereas McIntyre is mainly biased towards finding fault with papers. You tell me which wins as far as whether the Pages2K is reliable or not.
“the same pattern has been found by several independent researchers since”
Using independent data, or all using the same data?
To me a temperature reconstruction can only be trusted if sub-sets of the data give similar results, and even then how do you know that the driver is temperature, and not some more complicated mix of variables?
I’m not sure whether all new data were used in reconstructions, but there were reconstructions using additional data.
The proxies are chosen/analyzed to reflect temperature rather than other variables. Mann et al, for instance, used a statistical procedure that “pulls out” the variability due to different factors.
I don’t know why subsets of the data should be used. One would have to ask, which data? How would one choose? How small a subset? The smaller the subset, the more error you might have. To me it seems more reasonable to use more data as they become available, and different statistical procedures. Or, if there are some data that are particularly questionable, omit those – but you’d have to have very good grounds for doing so. M&M omitted so much data that they were not able to reproduce the results. This doesn’t show that the original results were erroneous, though, especially since M&M were trying to prove that Mann et al. were wrong. The proper way to go about testing reproducibility would have been to replace any suspect data with BETTER data.
Oh, wait – Wahl and Amman appear to have excluded proxies subject to criticism, using the original dataset:
“A systematic sequence of analyses is presented that examine issues concerning the proxy evidence, utilizing both indirect analyses via exclusion of proxies and processing steps subject to criticism, and direct analyses of principal component (PC) processing methods in question. Altogether new reconstructions over 1400-1980 are developed in both the indirect and direct analyses, which demonstrate that the Mann et al. reconstruction is robust against the proxy-based criticisms addressed”
ROBUSTNESS OF THE MANN, BRADLEY, HUGHES RECONSTRUCTION OF NORTHERN HEMISPHERE SURFACE TEMPERATURES: EXAMINATION OF CRITICISMS BASED ON THE NATURE AND PROCESSING OF PROXY CLIMATE EVIDENCE
https://web.archive.org/web/20060503103311/http://www.cgd.ucar.edu/ccr/ammann/millennium/refs/WahlAmmann_ClimChange2006.html
A couple more reconstructions. There are more, but you can always do a search for yourself.
https://www.nature.com/articles/sdata201788
(Note corrigendum)
https://translate.googleusercontent.com/translate_c?depth=2&hl=en&ie=UTF8&prev=_t&rurl=translate.google.com&sl=de&sp=nmt4&tl=en&u=http://www.nature.com/articles/ngeo2566%3Ferror%3Dcookies_not_supported%26code%3D7851281b-0f66-4ef8-849a-b9ea71cc690f&xid=17259,15700023,15700043,15700124,15700149,15700186,15700190,15700201,15700214&usg=ALkJrhjTa8Qd-lBjpoBsa0xBQuEzc9x24w
And a review. Note that the reconstructions are not all global or of the same seasons and ” With the exception of HPS2000 and OER2005, the reconstructions use partly overlapping data, so their errors are not statistically independent. In addition, the above works also use a range of techniques.” (see section 2)
https://www.clim-past.net/3/591/2007/cp-3-591-2007.pdf
>>>>There is ample evidence to suggest that the basic hockey stick shape has withstood many reconstructions, although there is some variability in details. It’s very strange to me that so many skeptics either aren’t aware of this or deny that the hockey stick is a legitimate representation, despite a known statistical error. Or maybe not so strange.
[there is also ample evidence to suggest that the hockey stick is a load of crap -mod]
Perhaps the moderator would like to provide the ample evidence of the hockey stick being a “load of crap” and ample rebuttal of the hockey stick evidence if he is going to append my comments with his own opinions. That would mean in-depth critique of all the reconstructions of the hockey stick, showing just where they had gone astray.
Otherwise, the moderator’s comment might as well itself be taken as a load of crap.
Kristi, the moderator is correct.
There is ample evidence on Steve McIntyre’s website climateaudit that MBH98 et al (“MBH98”) were false nonsense – you should not ask that it be repeated here. The is ample evidence that MBH98 was not only false, but fraudulent.
If you still have doubts, read the Wegman report. The North report was weaker, but under questioning, North agreed with Wegman’s conclusions.
Before Steve McIntyre’s skilled and diligent work, we already knew that MBH98 was false, because it eliminated the Medieval Warm Period and the Little Ice Age from the historic record, and these periods are very well-recorded.
Large portions of European populations died from cold, starvation and deprivation during the Little Ice Age. I am guessing from your name that these were your people; they certainly were mine. Let us show some respect for their suffering.
Regards, Allan
https://wattsupwiththat.com/2018/09/02/climate-scientist-michael-mann-congratulates-identity-thief-peter-gleick-for-receiving-his-carl-sagan-award/#comment-2447182
Repeating for Phil:
For more on the PUBLIC revelation of the Divergence Problem in 2006, see
http://climateaudit.org/2006/03/07/darrigo-making-cherry-pie/
Phil, Briffa is discussed by Steve McIntyre in his above 2006 post on ClimateAudit, but the true significance of the Divergence Problem, and the shifty way it was handled by Mann and others was not a matter of public knowledge until about 2006.
We owe a great debt to Steve McIntyre for his highly competent and tenacious efforts to reveal this warmist chicanery.
Mann’s early poor-quality tree-ring data eliminated the Medieval Warm Period and the Little Ice Age to depict the straight shaft of the Hokey Stick, but his later tree-ring data would have showed modern cooling with the blade of the stick turning down (the so-called “Divergence Problem”), so Mann deleted the modern tree ring data and instead grafted on modern surface temperature data to show the very-scary global warming message that he wanted to portray. Mann became famous, moved to Penn State and a tenured position, etc.
In summary, the Divergence Problem was “solved” thus:
Pure tree-ring proxies showed a downturn in modern temperatures, so Mann grafted modern surface temperature records onto the tree ring data to show global warming. Presto! Problem solved!
The IPCC loved Mann’s hokey stick and published it several times as an important piece of evidence in their “2001 TARpaper” – a steaming pile of deceptive warmist propaganda!
Now it was time to stampede the sheep!
References:
https://www.ipcc.ch/ipccreports/tar/
2001 TAR Fig SPM-10b and other figures
https://judithcurry.com/2014/04/29/ipcc-tar-and-the-hockey-stick/
“Regarding the Hockey Stick of IPCC 2001 evidence now indicates, in my view, that an IPCC Lead Author working with a small cohort of scientists, misrepresented the temperature record of the past 1000 years by (a) promoting his own result as the best estimate, (b) neglecting studies that contradicted his, and (c) amputating another’s result so as to eliminate conflicting data and limit any serious attempt to expose the real uncertainties of these data.” – John Christy
Kristi also wrote
Mann denied it. That makes it scientific fraud, not some sort of “oversight”.
TimTheToolMan and John Endicott,
Oh, hahaha. Whoops. I was thinking of the “grafting” comment.
Mann would deny wrongdoing when it came to the WMO figure since it was the work of Jones, according to Wikipedia (to which Jones was referring in his famous email). That is what I was referring to.
By the way, there is a difference between fraud and lying and scientific misconduct.
Fraud: “wrongful or criminal deception intended to result in financial or personal gain” This would not include lying in order to save oneself from disgrace or prevent others from trying to discredit one’s work – neither would result in personal gain, let alone financial. Preventing loss is not the same as pursuing gain.
Scientific misconduct would include intentionally manipulating data or analyses to come up with a desired result. It doesn’t include error. Hard to prove conclusively, but very easy to assume – rightly or wrongly.
Kristi writes
Look at the man. Look at his behavior time and time again. Its easy to see what happened with a high degree of certainty.
“Scientific misconduct would include intentionally manipulating data or analyses to come up with a desired result. It doesn’t include error. Hard to prove conclusively, but very easy to assume – rightly or wrongly.”
Grossly overweighting one proxy (stripbark pines) in order to overwhelm all the other proxies to obtain a hockey stick is fraud, period.
Kristi, forgetting to mention it is mere incompetence. Actually denying do it (as Mann did) is fraud. So take your pick fraud or incompetence, either way it’s not a good look for climate science.
No, he denied that the instrumental record was “grafted on.” This is different from using statistical procedures to combine the records.
By the way, I was wrong. I just read that Jones created the graph used on the WMO report. He was at fault for not differentiating between the instrumental record and the proxies on the graph.
I personally don’t have a high opinion of Jones. Mann, either. However, Mann was very young then, and it’s possible he has learned his lesson. Nor do I believe that their actions at the time constitute “fraud.” There is no indication that they directly benefited from their actions – all it got then was tainted reputations, death threats and huge headaches.
At any rate, it is very wrong to judge all climate scientists based on the actions of a few.
Here’s the famous email from Phil Jones, to Ray Bradley, Michael Mann & Malcolm Hughes, and cc’d to Briffa & Osborn:
https://sealevel.info/FOIA/0942777075.txt
Jones was talking about the now-infamous “hockey stick” graph for the cover of this 1999 WMO climate statement:
https://sealevel.info/wmo913.pdf
Here’s the cover illustration, juxtaposed with a picture of a hockey stick:
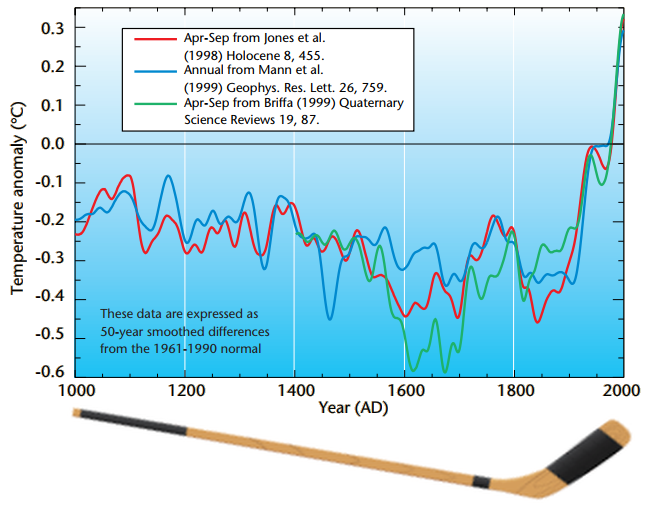
Here’s a zoom-in on the splice points in that fraudulent graph:
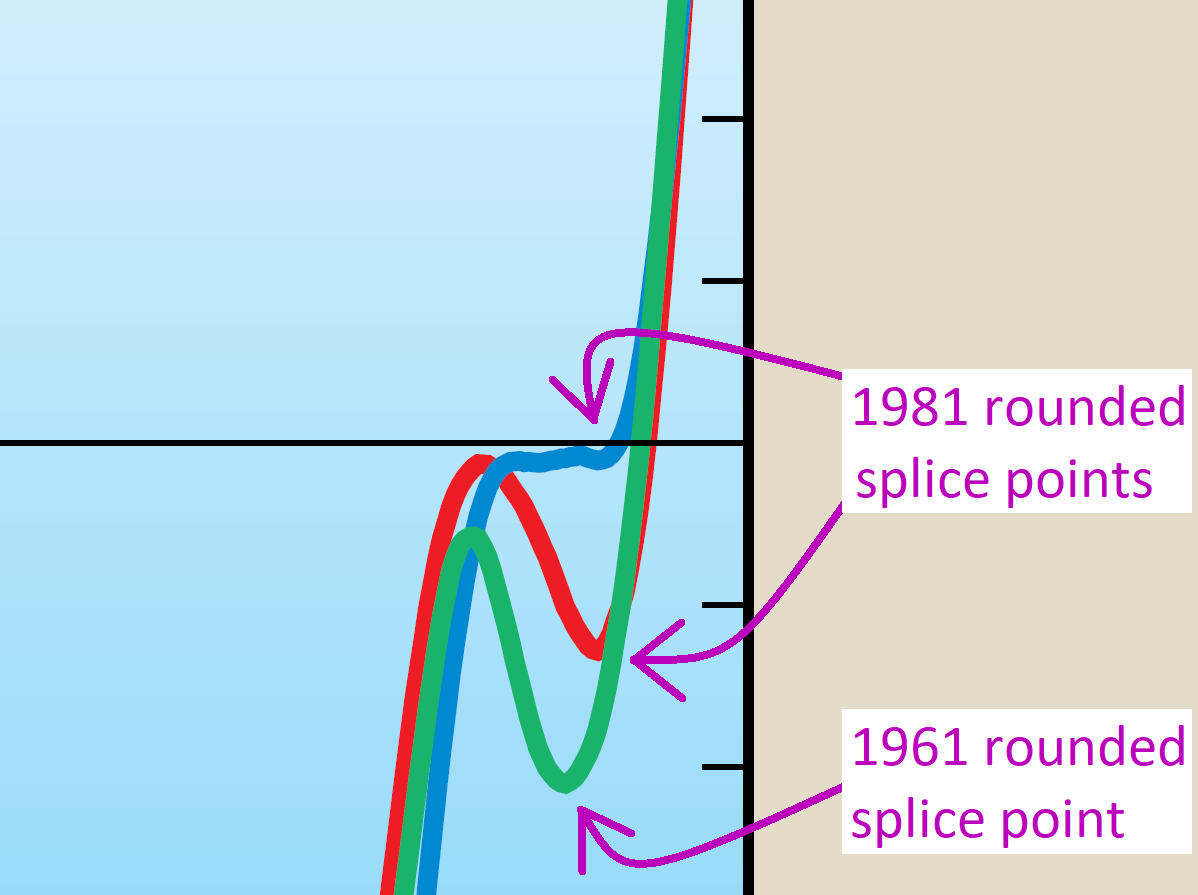
Note how Phil Jones used identical colors for the instrument data and the proxy reconstruction data, and note how he rounded the three splice points to hide them.
He even “bent” the bottom of the blue instrument trace out to the left a bit, to connect it with the blue (Mann) proxy trace. Remember: despite the graph labels which claim that the three traces are proxies, from 1981 on all three traces are the actually real (instrument) temperature data (and the green trace is real temperature data from 1961 on). Yet the three traces of the same instrument data aren’t quite identical, because, to hide the splice points, Jones had to bend the traces a bit, to make them line up with the three proxy traces.
In a field where ethical behavior mattered, all six of them would have lost their jobs.
Dave,
The email means nothing. “Trick” was a statistical procedure. “Hide the decline” refers to the fact that the tree ring data for the last couple decades was wrong. See my post above. Of course, you will see what you want to in it.
Are you sure Jones created the image? According to the description, “(Sources of data: P.D. Jones, K.R. Briffa and T.J. Osborn, University of East Anglia, UK; M.E. Mann,
University of Virginia, USA; R.S. Bradley, University of Massachusetts, USA; M.K. Hughes, University of Arizona, USA; and the Hadley Centre, The Met. Office).”
Seems to me it was a WMO report problem. The info came from different papers. How do you know Jones created it? Maybe he did, I don’t know. It was a mistake not to make it clear where the instrumental record began, that’s true.
Kristi, defender of the indefensible. It’s was a “statistical procedure” designed to hide inconvenient data. That’s not how science is suppose to work. That, however, is how con-men work.
John,
It didn’t hide inconvenient data, it replaced faulty data. Using faulty data is scientifically indefensible.
“It didn’t hide inconvenient data, it replaced faulty data. Using faulty data is scientifically indefensible.”
Wow. There is no evidence that the data was faulty. Only that it didn’t conform to pre-conceived notions, and was therefore assumed to be faulty. It’s called post hoc data selection.
And, because of the divergence problem, we can have no confidence in the same proxies before the instrumental record. That is the crux of the matter.
has anybody ever seen kristi silber and linda sarsour in the same room at the same time?
Has anybody ever seen the scrotum of gnomish? Is he really the eunuch everyone says he is?
are you her director, abdullah?
“But scientists are not so stupid that they are just going to cut down and few adjacent trees and say, There you have it!”
tried to ad lib when you were out with the goats?
stinks of taquiya, to me.
Post a picture gnomish, and prove you aren’t a eunuch.
waha, sidi
that’s what you got bacha bazi for, no?
PS Mr. Gnomish, did you know that “taquiya” doesn’t apply to the Sunni? It is fun to play with ignorant bigots like you.
Embarrassed because you have ” little hands” gnomish?
awesome.
i think my work is done here.
Har har har, gnomish runs away when confronted by a strong woman.
…
Defiantly lacks a pair.
Betty Pfeiffer October 12, 2018 at 4:54 pm
Taqiya is also permitted in Sunni Islam under certain circumstances.
Please see entry “Takkiyya” by R. Strothmann in the “Encyclopaedia of Islam”, (2nd ed.), in P. J. Bearman; Th. Bianquis; C. E. Bosworth; E. van Donzel; W. P. Heinrichs (2000).
The 3rd edition has been in the works since 2007.
https://en.wikipedia.org/wiki/Encyclopaedia_of_Islam
Sorry, but I can’t find a free on-line version of any edition. Might have to go to the library in true 20th century fashion.
Betty,
This might have to suffice, should you lack access to the Encyclopaedia.
https://www.globalsecurity.org/military/library/report/call/call_12-18_ch09.htm
In Afghanistan, I had the opportunity to discuss aspects of Pashtun culture with a terp with whom I became friendly. The Taliban are Pashtun Sunnis, and hate the Shia Hazaras, but yet the influence of Persian culture is strong among them, as of course too among Dari-speakers, whose language is a Persian dialect. Farsi speakers consider Dari and Tajik (Dari written in the Cyrillic alphabet) to be “hillbilly Persian”. This influence has led to some usually Shia concepts finding purchase among Sunnis in Afghanistan.
Which is not to say that Arab, Kurdish or Turkish Sunnis might not also practice taqiya under certain circumstances.
“has anybody ever seen kristi silber and linda sarsour in the same room at the same time?”
Can’t say that I have. Who’s she?
Kristi, there’s this thing called the internet where you can look up just about anything you want. 1 second in a search engine was all it took to find the wikipedia entry
https://en.wikipedia.org/wiki/Linda_Sarsour
Tillman, thank you, I appreciate it when you post ” under certain circumstances”
…
Unfortunately, taquiya originated in Shia Islam, and is applicable to it specifically. Your attempt to spread it to other sects of Islam is admirable, but bound to failure. You’re trying to take a century old principle and apply it globally to all sects of Islam. Doing so reveals your ignorance of Islam. It also reveals that you have swallowed the anti-Islam propaganda spread by the alt-right media machine.
…
Seeing that you are attempting to support gnomish, can you tell me if he has shown you his scrotum?…..Is he your boyfriend? Is he a eunuch?
Tillman, why does the POTUS practice “Taqiya” whenever it suits him? I thought he was Christian?
Tillman- prolly every lady you ever met said, lustily, ” HAR HAR HAR – tell me about gnomish’s scrotum”, amirite?
the sweet, demure souls are always begging strangers for pics of it. defiantly.
true story!
https://www.thereligionofpeace.com/pages/quran/taqiyya.aspx
there seems to be a fresh flood of ‘trolls’ hitting sites that encourage discussion that’s contra progressive narrative.
having never seen a group planning a campaign, a normal person might never imagine it is even a thing.
when half a dozen practiced trolls plan a mission, the target never knows what hit him.
novices are clumsy but when they get enough practice they can hold character very convincingly. try to spot them in their training stage.
watch for new guys that seek to engage and control the discussion or who are very needy and just never seem to ‘get it’ without more explanation.
signs to look for:
half the text of a thread is produced by one person
several new nicks swarm on a person as crows harry a hawk
topics are bombed with shocking rudeness that derails the discussion
nicks are chosen to set expectations so that questions of identity seem self evident and don’t need to be asked – as the wolf in sheep suit.
very often a female nick will be used because guys don’t perceive any threat from the gentler sex and it indulge fantasies they have to pretend they don’t have… honey-pot.
try putting DR in front of your nick and see how that changes the way people engage with you. it exploits habits with false perceptions.
betty is probably not the only louse working wuwt.
he’ll probably be replaced, though, cuz he screwed up so badly.
interesting and astute observation gnomish. something similar has occurred on another forum i frequent with very similar posting patterns.
It is amazing that some can accept that the most recent tree ring data is not an accurate representation of temperature, but posit that the past tree ring data (pre-thermometer) must have been accurate. (Simply because there is no way to calibrate it!?)
Pretty much the only way I’d believe any CAGW ‘proof’ data these days would be if it were independently audited by Steve M.
Rainfall, competition from neighbouring trees and insect defoliation have as much to do with tree rings as temperature.
Has the blade fallen off the shtick?
Self body check or a unintentionai self inflicted high stick?
Tree ring proxy data could certainly be better tested and understood. Whether it can be made fit for purpose is questionable. It certainly isn’t now.
It’s only useful if you know all the other environmental factors at the same time.
It’s less than useful…..you can core a tree on three sides….and get three different rings
John,
Why not? What is it about the testing of the data that makes it not fit for purpose?
You have to ask , has there ever been such a need to use industrial scale amount of ‘smoke and mirrors ‘ in ‘settled ‘ science before ?
Presumably these days with the current greening of the planet, (due to increased CO2?? ) the tree rings will all be a little fatter. Pick your variable and you can sing whatever song you like.
Tree rings? I believe the “reductio ad absurdum of tree ring chronologies as useful temperature proxies” was published by Mann et al some time ago. IPCC models still can’t confirm the so called climate scientists conclusions from that data, and natural reality as recorded by instruments and human records never did. Meanwhile the sky is not falling.
So I hope to see this tested properly and repeatedly by multiple independent scientists using real scientific method and clearly independent of the multi Billion pa funded IPCC confirming climate science bubble when the data is finally placed in the public domain by the University of Arizona, as has now been ordered to by the courts. As John Lennon sang, “Just gimme some truth”. It will make a change from the IPCC’s pseudo science for profit, that so accurately represents Feynman’s definition of this phenomenum. “You cannot prove a vague theory wrong” – neither should you spend Trillion pa on its untestable conclusions..
PAGES2k is the opposite of science.
It does not want past climate to be known, it wants it to be un-known or de-known.
It does not want to make clear, it wants to make un-clear.
It does not select data to sharpen the focus on past climate, but to blur past climate.
It does not want to reveal, but to hide.
It is a cynical, deceitful, obnoxious and dangerous pretense of science.
“It does not want past climate to be known, it wants it to be un-known or de-known.”
Sort of. They only want their narrative known, not reality.
What is more, it continues to be difficult to comprehend why mainland Australia, similar in area to USA less Alaska, has practically no proxy studies in PAGES2K, despite having star participants Gergis and Karoly and a large supporting cast with a huge budget. Must one conclude that there have been many proxy studies, but they are unreported because they did not yield the results that were wanted?:. Geoff
phil salmon “PAGES2k is the opposite of science.
It does not want past climate to be known, it wants it to be un-known or de-known.”
bingo !
As anyone who works with wood should know after having looked at an untold number (many hundreds ) of pieces of wood, from sunken ships right through fresh tree stumps to new carcassing timber the tree ring variance is so great to make short term proxy identification is impossible, so not sure how it could produce long term graphs of any greater accuracy.
I even used to keep some of the weird pieces showing obviously enormous changes to temps, step changes in 1 year from a continuum of wide to very narrow, that is of course unless it isn’t temp that drives the greatest change.
The dendocronologists use trees at the extremes of their range (high elevation or high latitude). In theory, this will make those trees growth more linked to temperature than a typical tree. However, I think that these trees will still respond to water availability, animal/insect damage, sunlight (cloud), even CO2 availability. The extreme of their range isn’t determined simply by temperature.
A classic case in the UK was 1976 where a hot, but very dry, summer ended up with narrow tree rings.
I do not recall the exact thread, but I asked our resident (self-identified) ecologist, Kristi Silber, if she believed that trees (or tree rings, more specifically) could be used as a proxy for past temperatures. She politely responded with a simple, “No.” I would assume that someone in her position is able to accurately assess such a question, and respond with an authoritative answer.
As far as I am concerned, case closed.
Vlad
Vlad,
You’re dreaming. Show me the thread, and I’ll believe it.
I recall seeing that as well, Vlad, but trying to find it would be fruitless. I don’t have that kind of time on my hands.
My apologies for the tardy reply, I’ve been away for a few days, and did not see your post in a timely manner.
OK, you asked, so here it is:
Post title: “20 Years Later, The Hockey Stick Graph Behind Waves of Climate Alarmism Is Still In Dispute.”
Post Date: 30 April 2018
My first post on the thread: 30 April 2018, at 1:56 PM, where I said:
“Cue Kristi in 3 … 2 … 1 …”
Several posts down, after you berated us for being ‘ … vultures … ‘, I said:
on 01 May 2018 at 07:50 AM: (partial quote)
“Do you, as an ecologist, support this belief, unconditionally? Since I do not want you ‘ … wasting … ‘ any more time here at WUWT than necessary, a simple “yes” or “no” will suffice.”
You responded, 01 May 2018 at 1:01 PM (full quote)
“Vlad,
No.”
So, it would seem that you have disavowed Mann and the ‘hokey schtick’ yourself.
Your response?
Regards,
Vlad
Vlad, that’s mighty deplorable of you!
During the Roman Period, there was no ice on the Thames .
No ice => no hockey =>no hockey sticks /sarc
McIntyre obviously doesn’t know what “reductio ad absurdum” is. Nowhere does he explicitly state which hypothesis he assumes to be true (in order to falsify it.)
The hypothesis is obvious, that South American proxies are sufficiently consistent to provide an indication of temperature history for that region.
No, it is not obvious. There is not even an allusion to that in his article.
Inconsistent proxies can still provide a temperature history. The inconsistencies will only add to the width of the error bars.
Indeed.
273±100 K should cover most proxies fairly well.
Inconsistent testimonies about a crime can still provide usable data for investigators. The inconsistencies will only add to the width of the error bars.
Inconsistent testimonies about a crime provide defense lawyers something called “reasonable doubt” which most often results in the acquittal of the defendant.
And, by that standard, there is more than enough “reasonable doubt” about the proxies to say they are not fit for purpose.
Tree rings = confounding variables. Any valid statistical analysis needs to account for confounding variables.
Phil,
OK in theory, but does not work when the accumulated errors from the other factors make the final result so uncertain as to be of little use or value.
It is a widespread problem in Earth sciences, but seldom expressed so clearly when the result can be phrased with might and could, instead of the study being ceased or forming a paper with a negative outcome. Geoff
I used to be a seasonal timber cruiser and the compass man on the forestry cruise pulling the measuring chain and identifying the plot every 300 feet that will establish the ‘science’ of the make up and productivity of the forest. I also cored the trees and counted the rings, amongst other things. On a pleasant day, this is really nice work out in the woods on a sunny day. Not so much in cold, windy and wet snow or rain.
Without so much as admitting this, I can tell you almost any story you want, by just adjusting the plot location within 15-20 feet acceptable deviation, and drilling the tree at DBH on the side that is most (south) or least (north) conducive to what result you want. As someone said above, you can core the same tree on 3 sides, and get 3 different results. Usually I just follow random variability and accept whatever results come of it. But sometimes for fun, I get bored, and want to see what would happen if I did this, or I did that. Or maybe some poor company needs a bit of a lift in their cut control, or a decrease, and it can be manufactured anyway you like it. Perhaps it isn’t ethical, but it is true. Or if I am tired at the end of the day and I can choose a plot 17 feet that way with 4 trees in it, compared to 17 trees 14 feet away in a slightly different direction as the plot centre with perhaps a partially different site index due to slope, canopy, drainage etc, that changes (partially) theoretically the make up and science of that whole cut block. Sometimes, it was required to do a whole new cruise of the same timber block, for one reason or another. The results could be as high a 50% difference on the next cruise in the same timber block, just stating in a different location with different plot centres.
The same is true for Dendrochronology in the wider study of Dendrology and it is very subjective as it relates to establishing temperatures from a distant time ago. And even applicable to subjective bias, such as general laziness or just plain deceit. While it may have some limited usefulness to using this procedure in generalities, I would rather look at the scale return for how much timber that cut block had after a harvest, than a hypothetical number pre harvest from a scientific timber cruise. Using tree rings to establish science is variable. It has higher effectiveness if you re-visit those plots for the next 50 years and keep measuring. But in essence, there is a lot of variability with a one off result, because the selected target of both the tree and the location can be selected for the result you are seeking, or you don’t know all the other variables that went into establishing that sample in the first place. It is maybe good for generalities. The point is, all of this isn’t an exact science, although it is argued if is done impartially and enough times, you can get close. Maybe, but that is like politics and polling. Sometimes you are right, close or completely out of the ball park. If it is being done to establish long ago temperatures and climate to any specific exact degree, I would say someone has been smoking too much pot and is either hallucinating or fantasizing.
Earthling2
You are saying that by taking cores on different sides of the tree, you’d come up with a different NUMBER of rings? You weren’t doing something right.
I hate it when people assume that scientists don’t know what they’re doing (or they are biased, lazy, greedy, corrupt – it’s all ASSUMPTION without any evidence!). Why make such assumptions??? If you want to read about dendrochronology, or more specifically, dendroclimatology, try this:
https://www.ltrr.arizona.edu/~sheppard/Raul/DendroclimatologyReview.pdf
Kristi,
Not a different number of rings, but of a different pattern of ring widths. Which should come as no surprise.
Earthing2 says he counted tree rings. There is no indication he measured them. Besides, scientists don’t just take any tree and core it. It you read the article, it talks a little about selection:
“A crucial first step in dendroclimatology is site
selection.28 In sites where moisture availability limits
tree growth, tree rings can be used to reconstruct
precipitation, whereas in sites where growing season
temperature limits tree growth, tree rings can be used
to reconstruct temperature.29 Once at a dendroclimate
site, trees are chosen for sampling based principally
on apparent age and on the absence of evidence
of disturbance by nonclimatic processes such as
fire,30 wind,31 wildlife,32 earthquakes,33 volcanic
eruptions,34 or humans.3”
The patterns of the rings are relative to each other. On different sides you may get cores that look different, where the rings are more compressed, for instance. Still, they show the same general patterns. I wouldn’t be surprised if researchers took multiple cores to determine whether it was a good sample tree. I don’t know. But I tend to assume that people who study these things are probably at least as aware of variation as others who cores trees for different reasons.
What I object to are the the endless assumptions that scientists are ignorant, corrupt, etc. and that they let their biases interfere with their research. There is no evidence for this, just assumptions. Sure, scientists make errors – everyone does. That doesn’t prove that ALL the science is worthless. Science is reproduced, and tends to be self-correcting over time. Skepticism is fine, I have no problem with that. Skepticism in science is a good thing. So be skeptical, but there’s no reason to write off a whole field of inquiry that is an accepted part of science and has produced thousands of papers. If tree rings data had little to offer paleoclimatology, it would be well-known by now.
“A crucial first step in dendroclimatology is site
selection.28 In sites where moisture availability limits
tree growth, tree rings can be used to reconstruct
precipitation, whereas in sites where growing season
temperature limits tree growth, tree rings can be used
to reconstruct temperature.”
Those conditions can change from month to month, year to year, decade to decade, etc. No dendro knows all the conditions for the history of any tree cored. It’s a sham to pick one factor and say, that’s the one.
For 30 years I was a Forester for the Government, measuring trees (height, diameter, age). In that time I worked in many different vegetation types in several different states. I have counted rings in a tree that was 3″ in diameter in one group (stand) of trees that was over 100 years old. Then counted the rings for a tree that was also 100 years old but was more than 14″ in diameter and less than 200 meters from the first stand. The soil, direction related to the sun, and elevation were all the same. Only difference was the first was with a lot of other trees the same age that had not reduced their numbers per acre as the second group had.
Trying to determine the temperature from trees rings in my opinion is almost impossible. Tree growth is determined by water, soil, and temps, but also a big determining factor is what is happening in the stand of trees, how much competition is there, is there other competing plants for the water and soil. Taking 4 tree is not going to tell you anything except what was going on with those trees. More samples would need to be taken from different stands of trees, different elevation. Then after looking at say 1000 different samples one might say what was going on in the past, just for that area.
g75phillips
All true except this: “Trying to determine the temperature from trees rings in my opinion is almost impossible” and the fact that you’d need 1000 samples. This is where the science of dendrochronology comes in, and the use of proper statistical analyses to find the appropriate environmental signals.
Keep in mind that the tree ring data were not assessed in isolation, but along with other proxies.
“…the use of proper statistical analyses…”
I am pretty damn sure climate science statisticians must have their own set of statistical laws.
I work in biological sciences, and in this field the huge variances, low or nil replication, use of multiple types of instrumentation and proxies, huge geographical and altitudinal variation, and vast amounts of missing data, which are all happily tolerated in climate science would see the whole data set thrown in the bin.
Steve writes:
“only four of 63 original tree chronologies have sufficient Hockey Stick-ness to be retained in the network, with even these poor remnants reverting to the mean in the 21st century updates”
But just remember this: 4 tree chronologies is a 4-fold improvement over some past peer reviewed papers, especially the one where 1 tree provided all the evidence that was required to prove CAGW.
Rick,
“But just remember this: 4 tree chronologies is a 4-fold improvement over some past peer reviewed papers, especially the one where 1 tree provided all the evidence that was required to prove CAGW.”
This isn’t true. There is no paper where only one tree was used, and there was never any suggestion that it “proved CAGW.”
There are at least two I know of that RELIED on one tree (Briffa’s YAD061), or one stand of trees (MBH98 and the Bristlecone Pines). They used more, but those others didn’t give the desired results.
The only real use of dendrochronolgy is the derivation of historical sections:
https://www.google.at/search?q=egyptian+emperor+chronological+order+tree+rings&oq=egyptian+emperor+chronological+order+tree+rings&aqs=chrome.