
It’s been a couple of weeks since Hurricane Florence made landfall as a Category 1 storm. The weakening from a Category 4 storm must’ve really tweaked alarmists.
NOAA just updated their much-adjusted ERSST.v5 sea surface temperature dataset to include September 2018 data. So let’s take a look at the September sea surface temperature anomalies for Florence’s full storm track. Keep in mind, these are preliminary data from NOAA. That is, if you were to check these results in a number of months, the September 2018 value might be different. The reason: the high-frequency filtering applied to NOAA’s ERSST.v5 sea surface temperature data. See Huang et al. 2017. Thus the notes in blue on the time-series graphs that follow.
NOTE: Please understand that I am not attempting to make light of the losses in life and property, or other sufferings, associated with Hurricane Florence. This post is solely intended to provide a reference for those who would like to use real data to counter the typical alarmist nonsense normally spread during and after natural disasters like Florence…alarmist nonsense spread by the mainstream media, by enviro-profiteers, by brainwashed gullible persons, by activist climate scientists who wallow in government funding, and by politicians (Eek, it’s an election year!).
We all realize the sea surface temperatures in the North Atlantic near to the coast of the Carolinas were higher-than-normal. But, obviously, sea surface temperatures are not the only thing to dictate the strength of hurricanes. This should have become blatantly obvious when Florence weakened significantly in its last few days over the North Atlantic, back to a category 1 storm, before making landfall. According to Dr. Judith Curry’s discussion here, the weakening before landfall was caused by wind shear. Thank you, wind shear…and thank you, too, Judith.
Many persons ignore the eastern portion of Florence’s earlier storm track where the sea surface temperatures were well below normal. In this post, I’m presenting the sea surface temperature anomalies for the entire track, the warmer-than-normal and cooler-than-normal portions combined. And as you’ll soon discover, there was nothing unprecedented about the sea surface temperatures for Florence’s full storm track.
Figure 1 is a map that shows the full storm track of Tropical Storm-Hurricane Florence. I’ve highlighted the three regions I’ve used for its full track. They are 12.5N-22.5N, 42.5W-22.5W for the southeastern portion, where Florence formed; 17.5N-37.5N, 60W-42.5W for the central part; and 25N-35N, 80W-60W for the northwestern, closer-to-shore portion.

Figure 1
For the graph that follows in Figure 2, I’ve provided a weighted average of the three grids, where the northwestern (25N-35N, 80W-60W) grid is weighted at 34.8%, and the central (17.5N-37.5N, 60W-42.5W) grid is weighted 30.4%, and the southeastern (15N-25N, 42.5W-22.5W) grid is weighted at 34.8%. That is, the southeast and northwest portions of the storm track are weighted the same, while the center portion is weighted a little less.
Figure 2 is a time-series graph of the sea surface temperature anomalies for the full storm track of Florence, with the data for the three regions weighted and averaged as discussed above. The September 2018 anomaly was a not-so-alarming +0.26 deg C above the 1981 to 2010 average.

Figure 2
In other words, as the title of the post reads there was nothing unprecedented about the sea surface temperatures for Florence’s full storm track. That value has been regularly achieved as far back as the 1940s and the late 1800s.
JUST IN CASE YOU’RE WONDERING
Figures 3, 4 and 5 present the ERSST.v5-based long-term sea surface temperature anomaly data for the three regions individually. As you’ll see, the September 2018, sea surface temperature anomalies were not unprecedented in any of the regions used of Florence’s storm track.

Figure 3
# # #

Figure 4
# # #

Figure 5
TRIVIA: WHAT DECADE SINCE 1900 HAD THE MOST HURRICANES MAKE LANDFALL IN THE CONTINENTAL UNITED STATES?
When I published my short story Dad, Is Climate Getting Worse in the United States?, I promised myself I would never present any of the graphs from it in a blog post. Well, I’m about to break that promise to myself so that I can answer the above question. See Exhibit 02 below from that short story.

Exhibit 02 from Dad, Is Climate Getting Worse in the United States?
The 10-year period ending in 1942 had the highest 10-year average, of course. On a decade basis, basically, the 1930s had the highest number of hurricanes making landfall on the continental United States. And please notice, the recent 10-year averages are roughly half (and less than half) the peak value. The source of the data is the “The Hurricane Research Division of the NOAA Atlantic Ocean Meteorological Laboratory (AOML), specifically the table with data titled “Continental United States Hurricane Impacts/Landfalls 1851–2017” at their website here [archived here].
Hmm, the 1930s also had the worst drought conditions across the contiguous U.S. and the highest high temperatures there as well, as also illustrated and discussed in Dad, Is Climate Getting Worse in the United States?
Yet some parties would like everyone to believe that climate is getting worse in the United States. Ha ha ha ha ha! And keep in mind the Great Depression was also taking place in the 1930s. Oy!
As many of you know, this year I published 2 ebooks that are available through Amazon in Kindle format:
- Dad, Why Are You A Global Warming Denier? (For an overview, the blog post that introduced it is here.)
- Dad, Is Climate Getting Worse in the United States? (See the blog post here for an overview.)
Don’t have a Kindle reader? No problem. See the Get the free Kindle app webpage.
READ THEM FOR “FREE”? Both of those Kindle ebooks are now available through Kindle Unlimited and Kindle Owners’ Lending Library, so if you subscribe to Kindle Unlimited or Amazon Prime, you can read the books at no additional cost.
To those of you who have purchased them or downloaded them, thank you very much. To those who haven’t, please do. You might even learn something. I always learn stuff while preparing my books.
Enjoy your day!
Bob
Thanks, Anthony!!
…and thank you too!
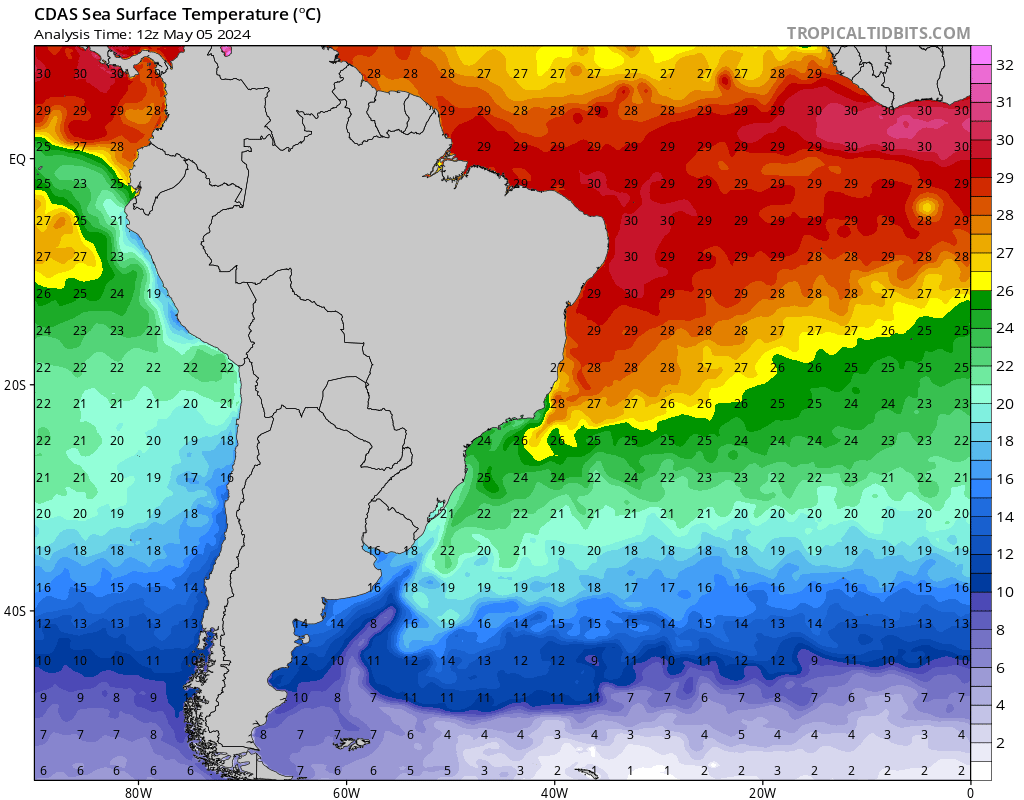
Just for fun, you can see SST’s in almost real time here..
http://www.fishtrack.com/fishing-charts/southeast-us_58668
Yes, you are worthy of our thanks and praise for your work here, Bob. Your writings and graphs are solidly citable. I hope you are a mentor to many more than just myself.
“SST’s in almost real time here”
“SST’s in almost real time here”
“SST’s in almost real time here”
You can see a movie of the region in the period here. It shows (relative to 1971-2000 base) the temperatures over the last 50 days, with 1/4 deg resolution. I shows the cooling of the track of Florence brilliantly.
You can see the original data on an interactive globe here.
Readers should note that the 1/4 degree Nick mentions is an angle, not a temperature, just in case you were thinking there were now squillions of real-time temperature monitoring bouys throughout the breadth and depth of the oceans to enable such precision.
From his link: “It has 1/4 degree (about 25km) resolution.”
Also from the link, can anyone believe the temps can be measured to a thousandth of a degree or that the darkest blue represents -71.645C?
“can anyone believe the temps can be measured to a thousandth of a degree or that the darkest blue represents -71.645C”
The data is provided to 100ths. You are referring to markings on the color scale, which are worked out from a nonlinear formula designed to keep most colors for the range of temperatures encountered. -71.645C represents the bottom of the lowest range. You won’t see any locations in that color.
Thanks Nick, that’s interesting. Bob has shown cooling along storm tracks in the past, that is what I was expecting here.
@Bob. your figure 4 seems to show a circa 60 year”cycle” . More of cosine half cycle than a simple harmonic oscillation.
If you shift your “exhibit 02” back 5 years to properly centre the filter you will see it lines up quite well with figure 4. You could then overlay the two for visual comparison.
BTW the day you learn to apply a proper filter instead of your crappy running mean you will find you no longer have 2-3 year squiggles after supposedly applying a 10y filter. I’ve been trying to explain that for 10y , so I don’t suppose you will ever be bothered to learn how to do that. That’s a shame. It would enhance your work.
If Bob did overlay those graphs ( with proper filtering ) he may arrive a something like from my article “Ace in the hole” over at C.etc.

https://judithcurry.com/2016/01/11/ace-in-the-hole/
Oh yeah, WP no longer show image links , let’s try the HTML tags:
OK so WP dumped on my tags.
MODS: is there a way to inserts a image ? This used to happen automatically until the breakage last month.
“Nothing Unprecedented about The Sea Surface Temperatures for Hurricane Florence’s Storm Track”
Damn!
Correct the temperatures were not unprecedented
They DONT HAVE TO BE
“We all realize the sea surface temperatures in the North Atlantic near to the coast of the Carolinas were higher-than-normal. ”
you need to first understand the argument the other side is making
They are not making the argument you are refuting.
Hurricane Bob happens and temperatures are roughly normal (N)
Question, what would be the effect if the temperatures were slightly less than N?
Question, what would be the effect if the temperatures were slightly more than N?
Those are the questions.
Not, do other things, like wind shear, effect the results
Not, is N unprecented
Nothing about N being unprecendent
These are the questions
What is the effect of Lower than normal temps
What is the effect of Higher than normal temps
The REAL question has nothing to do with AGW ( more GHGs warm the planet)
LOOK, If the Sun increased its output and SST warmed a little more than normal, we would have the same
questions
What is the effect of Lower than normal temps
What is the effect of Higher than normal temps
And the answers are:
All other things being equal ( wind shear for example) colder SST would lead to a less intense
storm. warmer SST would lead to a more intense storm.
If the sun warmed SST by few unprecedented fractions of a degree, we would not hear you arguing
that the increase was not unprecendented. We would hear people say
“hey, the sun warmed a little, the SST warmed a little, and the Hurricane as a result was a little more
intense than it WOULD HAVE BEEN OTHERWISE.
That wouldnt make it the worst on record, it doesnt have to be. It just has to be a little more intense
than it WOULD HAVE BEEN OTHERWISE.
It just has to be a little more intense
than it WOULD HAVE BEEN HAD THE TEMERATURE BEEN NORMAL.
We do this reasoning all the time: The storm hits at low tide. And then we can reason, that it would
have been worse had it hit at high tide.
To make it even clearer.
Assume the temperature (X) were .15C Below normal (N)
Assume a storm traverses an SST of temperature X: it will have intensity Z, and rainfall T
Now ask the question what WOULD HAVE HAPPENED if the temperature had been normal?
would the storm be less intense or more?
more rain or less
If the temperature were a little higher than normal, we would reason that the storm would be
a bit more intense.
REGARDLESS of the cause of that extra warmth
Mosh, go ask Joe Bastardi those questions. You might learn something.
so you have an expert you trust?
will you 100% accept his answer regardless?
or think for yourself?
Says the guy who routinely parrots what ever he is told.
..I don’t believe anyone has enough data to establish what is normal
We have enough data to establish that some things are abnormal…like Mosh.
Mike J LMFAO on Mosh comment. Thank You
Normal is defined BY CONVENTION
However, we dont even need that concept
Hurrican happens over water of Temperature X
Answer the following
A) if the temperature HAD BEEN X – . 0.3C would it have been less intense?
You are dug into a logical fallacy of “all things being equal” which they never are in climate!
That is unknowable. You pose a false question based on the false premise of “all else being equal”.
click to view graph:

https://judithcurry.com/2016/01/11/ace-in-the-hole/
Just when SST was having its “hottest decade on record”, Atlantic accumulated cyclone energy (ACE) took a dive in 2010.
So clearly this is more complicated than “all else being equal” because it never is in a complex interlinked system.
Logical fallacy : “all else being equal”
There’s no way of knowing…..too many factors come into play….SST is just one of them
When the eye spins down and gets tighter…it’s faster…that’s what they call stronger
…resistance to land, wind, atmosphere, etc all come into play to make that happen
“Normal is defined BY CONVENTION”
Really, normal is whatever the largest group of people says it is.
Back when we used to do science, normal was defined by the data.
Mosher, I read as far as your third sentence. There’s no reason to waste my time reading any more of it or replying to you, because you obviously did not comprehend what was written and presented.
Plus the use of All Caps is quite annoying to read.
Pro-tip: use bold Mosh.
Joel, from brother Mosher’s Berkeley Earth bio:
“He attended Northwestern University where he graduated with honors and BA’s in both English Literature and Philosophy.”
If this is really him, why do we need to correct his writing?
Just a passing thought.
From Brother Mosher’s bio and his CV and eperience at BEST, he is obviously an intelligent guy. Quite intelligent.
Why I suppose Anthony likes to have his longer comments here that aren’t drive-by’s.
It’s just the use of ALL CAPS really slows down my speed reading of comments as I scroll, makes me skip over them they are so hard.
Dear Joel O’Bryan,
I send to you my proposals in previous email to you. I hope you will find it.
Yes I have English problem, despite I am leaving in the USA from August 1992. But I did not sending SPAM email to anyone.
I have BS in Physics, worked as teacher of Physics and Technology – 5 years and as designer Engineer in Riga, Latvia – 25 years including 20 years in Radiotechnika Company with 15,000 employee, which produce home radio devices for entire former Soviet Union.
When I retired in August 2004 I started read books of climate change and during few month found that they are deadly wrong about reason for climate change after Industrial Revolution..
If you did not received my proposals, please send again email to me mioffe_2000@yahoo.com
The best, Michael Ioffe.
Hi Michael,
No thanks.
Best of luck in your travels.
Latvia is a beautiful country.
Selective use of all caps is fine with me — I do it, and I support Mosh’s doing it, just not the logic it might be trying to emphasize.
Some composition professors would discourage bold for emphasis too, claiming that the use of language should be so skillful that any sort of emphasis should not be necessary. I disagree strongly. Selective bold or selective all-caps are practically the same in my view.
THIS is not really that different from this. Sometimes I might even take it to another level and write T H I S or t h i s. Of course, the maximum effect would be T H I S
Yes, but his style of journalism does little to legitimize his viewpoint, to me.
Usually all caps or bold comes across as shouting, belittling, or insulting the reader’s intelligence. It does not facilitate effective communication. A least that is what I recall from the training we had at the environmental engineering company I worked for.
If you worked for Farmer Environmental in Edwardsville, IL, I might have already met you.
Just a shot in the dark…
Pop Piaza – No – I worked for a different environmental co. to your south. Have done environmental work in many states from coast to coast to coast including 7 where I have PE licenses.
Exhibit 02 almost looks like the inverse of the Arctic Sea Ice Extent.
You couldn’t prove this with emperical measurement/s if your life depended on it, lying basket.
” more GHGs warm the planet”.
GHGs block a small proportion of the IR spectrum ( by definition ). This is the one thing 97% truly agree on.
How the climate responds to that change has not yet been shown to be distinguishable form natural variability.
“…Question, what would be the effect if the temperatures were slightly less than N?
Question, what would be the effect if the temperatures were slightly more than N?…”
With all of that “extra warmth,” it rapidly pizzled from a Cat 5 – with articles appearing suggesting a separate Cat 6 category may be necessary in the future – to a Cat 1.
You can play that pretend game all you want…”It would have been even less intense without global warming.” How much more of a cop-out is there? What if global warming led to more wind shear? More Saharan dust? Why would you insist on “all things being equal” other than temperature?
Sure, you can “reason that the storm would be a bit more intense” with higher temperature. Scientists reasoned we’d have more and stronger tornados with global warming…and the years since have made them look foolish.
What Mosher ignores is that in a warmer world, the temperature difference between the tropics & the poles will be lower than it is currently. That change will actually reduce the average intensity of storms, not increase them, despite the extra water vapour the atmosphere will be able to hold.
The temperature difference between the poles and the tropics has the potential to play a role in how strong thunderstorms near cold fronts get, and by extension, tornadoes.
This temperature difference plays no role in how strong hurricanes get. The critical factor there is the temperature difference between the surface and the upper atmosphere.
You are partially correct. The surface temperature plays a role but there is no guarantee a warmer ocean makes for a stronger storm, unless a lot of things are held constant, which of course they are not.
How is AG CO2 responsible for higher SST’s? What is the magnitude of the effect, if any? Would a 0.2% difference in RH overwhelm the AG CO2 effect?
There is no point in talking about general theory without putting orders of magnitude on the variables. A slide rule is all that is needed, not a super computer, if the elements are all understood.
Can somebody translate Steven M’s long comment for me ?
A little early on the bottle is my take.
But hey, it’s 5-o’clock somewhere.
Total tosh!
It is alarmism for the sake of alarmism.
Mosh:
“…the Hurricane as a result was a little more
intense than it WOULD HAVE BEEN OTHERWISE.”
You do not and cannot not know that. The idea that ‘warmer water makes stronger hurricanes’ is based on the claim. That ‘a hurricane that is warmer contains more energy’. I have heard the claim dozens of times. It is based on the erroneous idea that if a stove has a higher enthalpy (total energy content) it will release that energy. “Global warming” makes everything warmer so everything will contain more energy therefore hurricanes will be more destructive. Because we assume global warming is in part caused by human activities, therefore part of that destruction is human-caused.
I think I have that argument captured reasonably. The error is the oversight about the concept of global warming making everything warmer. While we hear about polar amplification the main thrust of the argument is that if a hurricane holds more energy it will be mores destructive. This is incorrect.
If a hurricane and the seas and the land and the entire troposphere is warmer (for whatever reason), we also know the cold part of the atmosphere, the polar regions are not only also warmer, many claim they warm first and faster than everywhere else. This being the case, the Delta T is reduced for all storms, reducing the potential to dispense energy in the form of winds and consequent damage.
To the extent that human activities have increased the global average temperature, to the same extent the preferential warming of the polar regions reduces the temperature gradient for the hurricanes. Human activity weakens hurricanes. That is the bottom line, if we have any influence at all.
The idea that we ‘strengthen’ hurricanes is based on a defective understanding of thermodynamics.
Warm water is “necessary, but not sufficient in itself”, would be the correct statement.
Water is needed, yes. Define “warm”. Until you ask a properly framed question, no answer is possible.
Since we do not understand all the processes involved and how they interact, there can be no definitive statements.
Joel
There are cold water hurricanes. There was one in the Arctic in the summer of 2012 which cause the unprecedented’ low 15% sea ice extent. ‘Warm water’ is clearly not a prerequisite for a hurricane.
those are not tropical cyclones. They have no warm core.
Nor’easter snow makers climbing-up the US East coast just off-shore are also examples of cold core cyclones.
which is a totally artificial line of argument, since many parts of the climate and weather systems are inexorably linked. This is not some lab experiment where you can hold all other confounding variables constant and study with “all other things being equal”.
There does seems to be linkage as would be expected from the fact that SST is the source of the energy of a storm. But there is also the break around 2010 at the end of the ACE data in this graph: just when SST was going through the “hottest decade on record”.
So your totally artificial “all things being equal” logic falls apart because “all things” are never equal in the real world. It is a complex interlinked system. Just when you think you’ve manage simplify some behaviour down to one variable it shoots off in the other direction and pulls the rug on you.
The storm in question was Cat 4 weakening to Cat 1 at landfall. All perfectly normal.
Chris Landsea has stated the theoretical windspeed difference due to global warming see:
http://www.aoml.noaa.gov/hrd/Landsea/gw_hurricanes/
“The bottom line is that nearly all of the theoretical and computer modeling work suggest that hurricanes may be slightly stronger (by a few percent) by the end of the 21st Century, even presuming that a large global warming will occur9. ”
And:
“The climate models are also coming into agreement that the number of tropical storms and hurricanes will not go up and may perhaps even decrease (by around one-fourth fewer) because of the increased vertical wind shear. ”
As regards that wind speed increase:
“With such modest and mixed alterations anticipated several decades away, what does global warming imply for hurricane activity today? The ~1°F (~0.5°C) ocean temperature warming has likely made hurricanes stronger today by about 1%. Thus even for a Saffir-Simpson Hurricane Wind Scale Category 5 hurricane – like Hurricane Katrina over the Gulf of Mexico – the increase in hurricane winds are on the order of 1-2 mph (2-3 kph) today.”
1-2 mph. So not a lot. Due to the general variability of hurricanes and wind measurements, probably not a detectable change for decades, if at all.
The skin temperature of the water is a minor factor, however the temperature of the first 100 feet or so is much, MUCH more important.
Steve, inasmuch as storms don’t seem to be worse now than they were when the climate was colder, it is likely that the model-derived predictions that global warming will cause worsening storms is simply wrong. But even if it were correct, do you think that reasoning justifies the belief that global warming is bad?
If so, then by that logic the lower the temperatures the better. That would mean that the LIA was better than the Modern Warm Period and the Medieval Warm Period, which followed & preceded it, respectively, and that the Last Glacial Maximum was best of all climates in the last 100K years.
Obviously that’s absurd. What’s missing is the other side of the equation. To say that a change is “bad” or “good” requires cost/benefit analysis, and that means you cannot just ignore the benefits.
Those benefits are not negligible. They include things like global greening, and an improvement of at least 15% in agricultural productivity (probably closer to 20%) from CO2 fertilization, plus extended growing seasons at high latitudes. Even if anthropogenic climate change made hurricanes worse, it is hard to imagine that that cost could exceed the value of ~18% of all of the world’s agricultural production.
If you wish to predict the future reasonably well, you must first have a complete understanding of history.
…and, not the revisionist kind.
Or the revolutionist kind either, I guess.
I probably should have said “I hope” rather than “I guess”.
“Do not go there, my son! When you doubt your powers, you give power to your doubts.”
Thanks BCBill, that’s something to remember onstage as a musician.
I have watched hurricanes strengthen and weaken for decades and once talked to a meteorologist who had a graduate degree studying hurricanes not long after one fortunately weakened. While hurricanes sometimes seem to have a mind of their own and atmospheric effects are more obvious, could there be a more logical (than heat) “hidden cold” (upwelling of uncertain origin) sometimes at least a little at work? Storms traverse various depths with various widths of continental shelves with various thermocline positions suggesting various amounts of available heat.
The southern Texas coast with a more narrow continental shelf has more summer upwelling than the central and upper coasts with increasing shelf widths. It might be helpful to have an oceanographic ship able to do what the hurricane hunters do, but takers are hard to find, myself included.
And I know about the 50s drought, my name is on a paper about it. And I heard about the 30s when leaves fell off trees in the summer of 1936 in Oklahoma. My wife was around a minus 4 months old then and there.
In times past, the Hurricane that did seem to have a mind of “her” own was common. No one thought a thing about such descriptions then.
A very misogynistic view of a “woman’s” temperament, before it become quite un-PC to exclusively give hurricanes feminine names.
Today we not only have his-res satellite pictures every 90 seconds, we have very good “estimates” of winds speeds at all the various altitudes around the hurricane. Then we send in aircraft to verify those estimates and make there own direct measurements.
It is not that hurricanes have “minds” (that is anthropomorphic), but that they are controlled by the atmospheric properties and sea surface temps around them. Properties that we can now measure or closely estimate as they change.
We just need to understand what those measures mean to get the physics correct.
Providing an explanation of “Why” the Atlantic Hurricane switched on in Early August, and then petered-out (wind shear returned) as the month progressed as Florence bore-down on the Carolinas.
Florence, along with 3 other tropical cyclones (TC) in the Atlantic basin formed rapidly between 9/02 – 9/07; 3 of which became hurricanes. Hurricanes Florence, Isaac, and Helene and Tropical Storm Gordon (short-lived because it formed in the Gulf of Mexico near Florida) were a remarkable outburst after the entire month of August surprisingly saw NO tropical storms form (there were two August subtropical storms that the NWS’s NHC quickly named to prop their season’s numbers up).
Dr. Ryan Maue noted on 30 August, in both his personal twitter feed and in interviews that were carried in major media and newspapers, that the weather forecast models of the Atlantic basin had suddenly in the last 48 hours of model runs undergone a “switch” in states to one very favorable to TC development.
For example here:
https://www.sxm-talks.com/st-martin-news-network/weather-models-have-flipped-the-switch-hurricane-season-coming-to-life-in-the-atlantic/
Immediately preceding that TC development switch was an geomagnetic Ap spike on 26-27 August.
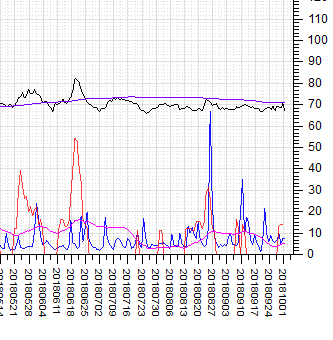
Viewable here on Jan Alvestad’s http://www.solen.info/solar/
or here as .png image.
The blue spike in that plot on 26-27 August 2018 is the Postdam Ap. That was the largest Ap spike in that previous 9 months.
Then there was another (smaller) Ap spike on 10 September (this was likely due to coronal hole CH 884) .
On 10 September, Hurricane Hurricane Florence was a Cat 1 at 0300 GMT. It was declared a Cat 2 at 0900 GMT, and then upgraded again to Cat 3 at 1500 GMT, but then 1 hour later at 1600 GMT 10 September, it was a Cat 4. Florence dropped her central low pressure by 39 millibars in less than 18 hours.
We saw a very similar Ap spikes – Hurricane strengthening switch in 2017 with Maria and Irma. And similar geomagnetic activity A-index spikes in the very active 2005 Atlantic TC season. And also in 2004.
My hypothesis is that that Ap spike (somehow) initiated a series of atmospheric shifts that create the “switch” in the Atlantic basin to one favorable to TC development and strengthening.
Unlike climate change hindcasting and post-hoc wiggle matching, this Ap-Atlantic Hurricane hypothesis is testable. This is because there is an Ap forecast.
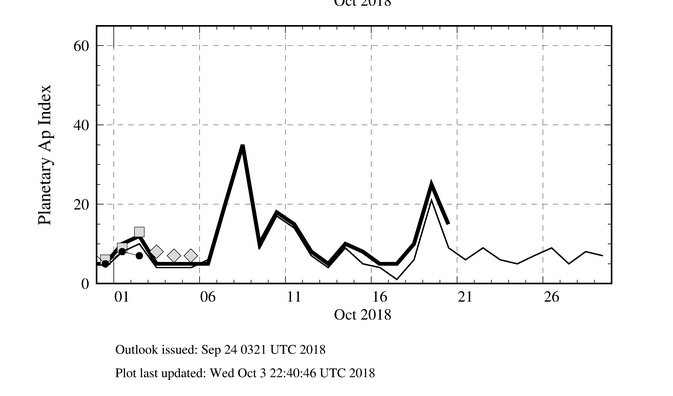
Available here:
https://spawx.nwra.com/spawx/27do.html
The current Ap forecast says there will be a geomagnetic Ap spike on 8 October (5 days from today), and then another smaller spike on 19 October.
The Ap-Atlantic Hurricane hypothesis predicts:
(from the Ap forecast) One or several Atlantic Basin TCs will form in the 96 hours following the 8 October Ap spike, and that those TCs still surviving will strengthen dramatically on or just after 19 October.
P.S. I love testable hypotheses. It allows actual science to move forward if they can be proven wrong.
When the storm spins down and gets tighter….like a skater bring their arms in…they measure that as “stronger” with lower pressure
..might be more interesting to look into why they are spinning down
An errata to above.
Top line should read:
“…Atlantic Hurricane Season switched on in Early
AugustSeptember.”I miss “edit.”
Joe Bastardi is showing some possible October tropical activity upcoming on weatherbell.com.
Right now ( @ Wednesday, 1730 MST), the Weather Underground Tropical Outlook says:
Leslie’s track will have it nearing Iceland as an extra-tropical depression by Saturday night. So that one is toast- fini.
The disturbance near Central America/West Carib is likely to strengthen some by Sunday. But a quick landfall would doom it to rapid extinction. Or it could get out into the Gulf and threaten Upper Mexico/Texas coast with an 8 Oct Ap atmospheric kick.
This hypothesis predicts that new TCs will form between 9 Oct – 12 Oct somewhere in the Atlantic Basin. And those still “alive” in/over favorable water temps will rapidly strengthen (diminished upper level wind shear???) coinciding with the forecast 19 October Ap spike.
upcoming Atlantic TC Names:
Michael,
Nadine,
Oscar,
Patty
Put those in your memory banks for recall on Oct 20th.
PS: Nadine sounds like a real B’wich for some unlucky coastal residents… for what its worth.
PPS: quite misogynistic on my part but hey, I exude toxic masculinity
A long comment of mine seems to have fallen off into the ether again.
Sigh.
[Nothing of yours in Spam folder. .mod]
Thanks Mr Mod, it showed up eventually. I guess I need to be more patient.
Note, a moment ago I responded that comments disappear regularly.
When I clicked on the “Post comment” box,
the screen flashed and when to the top.
There is no indication that I did anything.
It will happen with this one too.
Having to wait a minute or two to see your posts is bothersome, however popping all the way to the top of the page can get really irritating. Especially when either the article or the number of responses is large.
This happens so often for me that I no longer consider comments as interacting with someone.
I post a comment and move to something else.
Feels like I am a troll, but I don’t have time to follow along when nothing happens.
Bob, I get the idea that there was also nothing unusual about the high pressure ridge north of those SSTs that supported Florence in developing, or the wind shear that thankfully destroyed her. I think Florence was a good lesson in normally chaotic weather.
“The September 2018 anomaly was a not-so-alarming +0.26 deg C above the 1981 to 2010 average.”
Since it is well known that a hurricane cools the waters in its track, using the entire month of Sept will give the answer you want, which, of course, is wrong. You need the daily temps and I know that Stokes has told you how to do that.
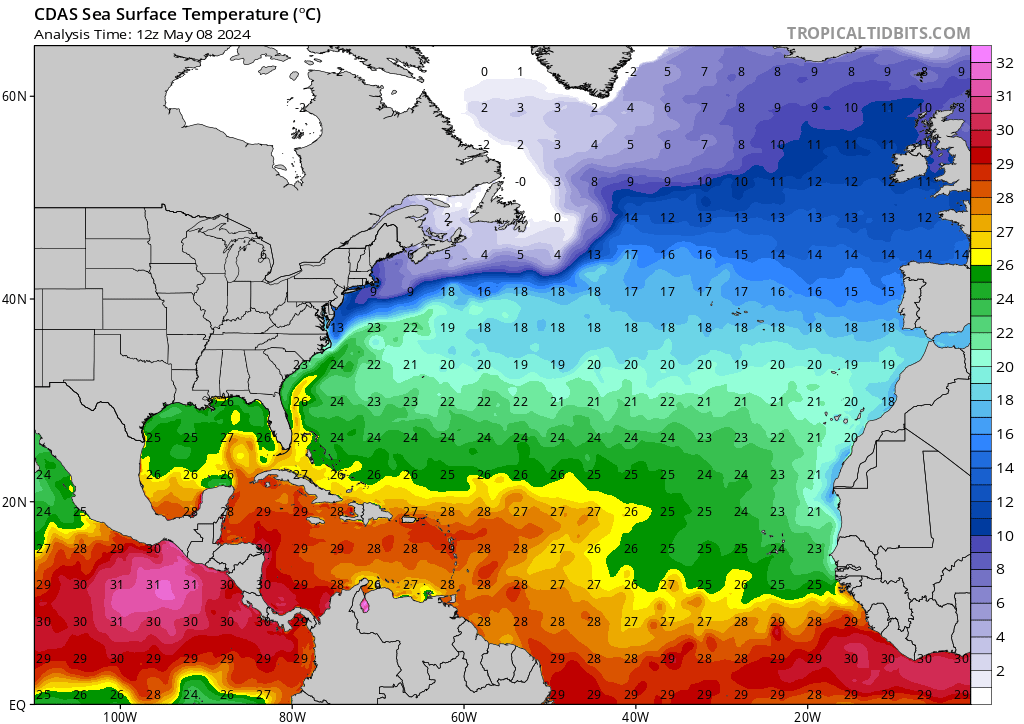
“Since it is well known that a hurricane cools the waters in its track”
As I noted above, Hurricane Flo showed a brilliant example of that. Here is the plot for 14 Sept:
Nick,
A Very nice photo.
Thanks for that data shot.
It very clearly it shows the evidence of a top 30 meter of warm SST (based on wave height mixing) the thermal energy that got transferred to the tropopause via convection and then radiated to space by Flo. (Q: Do Aussie’s know of US Progressive Insurance’s Flo?)
What I find it amazing that with all the major Typhoon activity this year out in the Western Pacific (w/2 Cat 5’s spinning yesterday), the GCMs can *not* capture any of this energy flow. None.
And here is the plot for 10 September. The anomaly base is 1971-2000. It really was quite warm ahead of the hurricane, and cool afterward.
Oops, sorry that was 14th again. Here is 10th
Looking at the reports and real time videos at the time of landfall show wind forces against palm trees, metal signs, people, etc. I saw no more than 50 knot sustained winds.
Photos of the wind damage around the area of landfall after Florence passed all show tropical storm force at best.
Offshore buoys in the direct path of landfall show sustained winds in the 50 knots range.
Florence passed directly over NDBC buoy JMPN7 and recorded maximum sustained winds of 56 knots. That buoy has anemometer height of 10 meters. Plots of winds at that time show both leading and trailing eyewall winds, and the calm eye.
Weather stations everywhere along the land path of Florence confirm that Florence never had sustained winds reaching hurricane threshold of 64 knots on the Saffir-Simpson scale.
The only reason people think Florence was a hurricane at US landfall is because the National Hurricane Center declared it. The evidence shows that Florence did not have sustained winds reaching that level.
I wonder if the barometric pressure was the determining factor?
If the scientists will be less involved in political/scientific deadly wrong games, they will long ago understand that only Properties of Water could really help reduce as weather as climate disasters and any damage from hurricanes like Florence and many times stronger could be easily prevented. Send me email – mioffe_2000@yahoo.com AND I WILL SEND TO YOU PROPOSALS HOW WE CAN DO THAT.
I am sure that Bob Tisdale – author of this article never read proposals in discussion of his articles.
I writing that, only to confirm for myself that author of politically motivated articles have another goals in their mind – fool the people with wrong sciences.
[Left in queue. Doesn’t sound right, but isn’t written like the usual spam either. .mod]
Send Michael an email at your own (spam-acious) peril.
And You might get the once-in-a-lifetime offer to be fantastically rich by sharing an inheritance with a Nigerian Prince. He just needs a little of your money to help you both get it.
Reads like English is not his primary language. I question why said proposals are not posted directly, or a link provided.
The trolls like to see an identity and an email address posted simultaneously here, It allows them to spoof that identity quite easily, from my experience. H/T to dbstealy for helping me resolve the problem. I enjoyed him as a mod and was sorry when he was expelled.
Dear Pop Piasa, English is my second language.
Don’t be so naive. I am not sending spam, but badly trying to inform the world that we have huge problems in the sciences of economy, climate change, foreign affairs, sociology.
If you will google climate change you will receive around 200 million of articles, which repeated the same mistakes millions time.
Trying to overcome this ocean of information I am sending through LinkedIn my proposal to 3,896 members in hope, that they will be more lucky than me in promotion these ideas.
I can send them directly to you – send me email and I will attach to you proposals mioffe_2000@yahoo.com
When I Google “climate change”: 1/1/2016 at 7:50 AM Chicago Time – I found 169,000,000 results; 9/21/2017, 10:19 AM -194 million results. And if you think that these millions provide real millions of new ideas, you are wrong. All information are repeating only three main ideas:
Idea #1. Al Gore in 1980th was a Chairman of Senate Committee, where under influence from James Hansen – scientist from NASA, name carbon dioxide and other greenhouse gasses, which trapped infrared radiation from the earth surface, as reason for global warming. They are using names of scientists – John Tyndall, Samuel Pierpont Langley, and Svante Arrhenius to promote their ideas. https://en.wikipedia.org/wiki/John Tyndall John Tyndall put the different gasses in the closed tubes and studied how they absorb different infrared radiation. His main reports of the 1860s were republished as a 450-page collection in 1872 “Contributions to Molecular Physics in the Domain of Radiant Heat.
https://en.wikipedia.org/wiki/History_of_climate_change_science By the late 1890s, American scientist Samuel Pierpont Langley had attempted to determine the surface temperature of the Moon by measuring infrared radiation leaving the Moon and reaching the Earth. The angle of the Moon in the sky when a scientist took a measurement determined how much CO2 and water vapor the Moon’s radiation had to pass through to reach the Earth’s surface, resulting in weaker measurements when the Moon was low in the sky. This result was unsurprising given that scientists had known about infrared radiation absorption for decades. A Swedish scientist, Svante Arrhenius, used Langley’s observations of increased infrared absorption where Moon rays pass through the atmosphere at a low angle, encountering more carbon dioxide (CO2), to estimate an atmospheric cooling effect from a future decrease of CO2. He realized that the cooler atmosphere would hold less water vapor (another greenhouse gas) and calculated the additional cooling effect. He also realized the cooling would increase snow and ice cover at high latitudes, making the planet reflect more sunlight and thus further cool down, as James Croll had hypothesized. Overall Arrhenius calculated that cutting CO2 in half would suffice to produce an ice age. He calculated that a doubling of atmospheric CO2 would give a total warming of 5-6 degrees Celsius. At the same time, John Tyndall, Samuel Pierpont Langley, and Svante Arrhenius did not pay attention on behavior of different greenhouse gasses in real atmosphere.
NO ONE OF THEM!
No surprise Arrhenius made huge mistake but these mistaken ideas of Svante Arrhenius became a dogma for today theory about greenhouse effect.
Idea #2. Some of their opponents, also, promote that greenhouse gasses are responsible for climate change and claim that not human activities, but an eruption of the volcanoes and other natural sources of greenhouse gasses are responsible for climate change.
Idea #3. The SCIENTISTS FROM Heartland Institute oppose the greenhouse gasses theories [please, read book: [Craig Idso and Fred Singer, Climate Change Reconsidered: (200 Report of the Nongovernmental International Panel on Climate Change NIPCC), Chicago, IL: The Heartland Institute, 2009]. In Chapter 5. Solar Variability and Climate Cycles they provide alternative theory of climate change: “variation in the sun’s output and magnetic fields, mediated by cosmic ray fluxes and changes in global clouds cover play a larger role in regulating the earth’s temperature, precipitation, droughts, monsoons, and other climate features, than any past or expected human activities, including projected increases in GHG (greenhouse gases) emissions.” Page 207. “…electrons released to the atmosphere by galactic cosmic rays act as catalysts that significantly accelerate the formation of ultra-small clusters of sulfuric acid and water molecules that constitute the building blocks of clouds condensation nuclei.” Page 208.
If changes of temperatures in different part of earth will depend on greenhouse gasses, WHY THESE CHANGES ARE SO DIFFERENT (IN 38 TIMES) in South Hemisphere and Arctic?
WHY ALL OF THESE SCIENTISTS ARE WRONG?
The earth is a lucky planet with two types of the greenhouse gasses:
1. Which are lighter than nitrogen and oxygen – methane, water vapor.
2. Which are heavier than nitrogen and oxygen – carbon dioxide, nitrogenous oxide, ozone, and many others even heavier greenhouse gasses. Please, compare their molecular weight: methane – CH4=16, water vapor – H2O=18, nitrogen – N2=28, oxygen – O2=32, carbon dioxide – CO2=44, nitrogenous oxide – N2O=44, ozone – O3=48…
The molecular weights of gasses are playing the crucial role in nature:
1. A smoke from a chimney of power plant in not windy condition is going up ~ 500 meters after that is a horizontal, despite a temperature in an oven ~1,000 degrees C. It is cooling with height and, as it full mostly with molecules of heavy gasses, forces of a buoyancy can’t lift it.
2. At the same time, the billions of molecules of water vapor are making any parcel of air lighter, than other parcels with lesser numbers of molecules of water vapor, and forces of the buoyancy are lifting it up. When with a height air in a parcel is cooling, part of a water vapor condensed, released energy, which heats air in this parcel and recreates the convection forces. Step by step all molecules of all gases in this parcel together with their kinetic, latent and trapped infrared radiation energy are coming to upper troposphere, where energy is going to space easy, than from ocean (land) level.
The properties of water:
– As water vapor is lighter than most molecules in air they help transport huge amount of energy of all gasses from an ocean (land) level to the upper troposphere and helps cool the atmosphere, despite water vapor is a greenhouse gas. (Methane is doing the same).
– These properties cover 1/3 of the earth by clouds, which reflect to space direct sun radiation. Properties of water cover all Antarctica, most of Arctic, most of the mounts on the earth, and huge territories in the winter time by ice and snow. These ice and snow also reflect to space huge energy of direct sun radiation.
PROPERTIES OF WATER HELP COOL THE ATMOSPHERE, DESPITE WATER VAPOR IS A GREENHOUSE GAS.
How after understanding roles of these properties of water we can agree with scientists about specific role of greenhouse gasses on the earth; about their claim that water vapor and methane even more powerful greenhouse gasses, than carbon dioxide?
Exactly opposite in South Hemisphere less continents and more evaporation of water vapor and it cool South Hemisphere more than North Hemisphere.
REASONS FOR CLIMATE CHANGE AFTER YEAR OF 1800 (Industrial Revolution):
1. A population of the earth in 1800 was 1 billion, today more than 7.3 billion. To feed the growing population mankind activities created around the world 4,000,000,000 acres of fields of potato, corn, wheat, etc. (area ~ equal of two areas of the USA). These fields were created instead of the former forests and the virgin steppes. It reduces evaporation of water from a soil over all continents with arable land, reduces the humidity in the air and the probabilities of rains – a real cooling mechanism in the nature.
2. As we use mostly a fossil fuel for our energy needs, a black carbon and a dust from it cover a fresh snow, which reduces a reflection back to the space of the direct sun radiation.
Human activities using mostly fossil fuel to create all changes in the world. Of course it increase amount of carbon dioxide and other greenhouse gasses in the atmosphere.
But they are only indicator of human activities in wrong directions: fields evaporated less water vapor, than what was before 1800 year – forests and steppes instead of fields.
SCIENTISTS FROM Heartland Institute the same as majority of scientists ignore changes on continents, which created by human activities. IN A DRYER AIR OVER ALL CONTINENTS additional electrons couldn’t create more “condensation nuclei”.
Response of the earth to any sun activities in our times will be different than in medieval times.
Only two gasses – water vapor and methane in reality could help people to influence the weather and the climate change, by accelerating or decelerating of movement of energy in the atmosphere to different places on the earth.
Solar cells, windmills are useless in our attempt to influence the climate.
Let look at graph, which illustrate Temperature anomaly in Global Temperatures from 1880 till today. (All pictures are taken from Wikipedia).
Despite it show global warming in result, it is not so important. Please, pay attention on really interesting – it showing sharp warming and the same sharp cooling, which occur one after another. Why is it? Is it influence of precession of earth orbit? Or, maybe so fast in both directions are changing amount of greenhouse gasses in the atmosphere? Or we have so fast and regular changes in core of the Earth, which some scientists trying to use for explanation of all changes of climate on the earth? Or, maybe it is close to changes of sun activities?
In a nonlinear, chaotic system “what would be the effect if the temperatures were slightly more than N?”
There, fixed it.
Sure seems like a question I want to endlessly agonize over.
What kind of mistake we have in science of climate change;
We are repeating in millions of articles that greenhouse gasses are responsible for climate change. It is wrong.
1. Molecule of water vapor is lighter than most gasses in air. Billions of these molecules are making any volume of air lighter, than any other, where less molecules of water vapor in the same atmospheric condition. In result this volume of air is going UP to clouds level. It happen around all surface of the earth: billions of water vapor molecules help transport to upper troposphere huge energy of all gasses.
2. In clouds molecules of water vapor condensed in water droplets. Clouds reflect back to space direct sun radiation. The same are doing snow and ice.
It means, that properties of water are cooling the atmosphere, despite water vapor is a greenhouse gas.
All theory that greenhouse gasses are responsible for climate change is deadly wrong.
If author of this article, the same as posters, which discuss it, will understand properties of water, they will easy fight any weather and climate disasters.
Please, ask me additional questions and I will show you how we can do it.
Publish.
collect your Nobel.
If you can help me to publish not posts after articles, but articles in newspapers like Chicago Tribune, The New York Times… I can easy to show that we have mistakes in the science of economy, climate change, foreign affairs, sociology… and deserve 4 Nobel.
But in Google like culture always will be promoted articles with wrong, but knowing by majorities ideas.
Suggestion:
Get a userID at Arxiv.org.
Use Arxiv.org to publish an initial draft manuscript *if you have a sound physics basis* with references to your ideas and with either observations or hard math simulations.
You’ll can get pre-print published there.
The timeline at Arxiv.com establishes author primacy for any real physics discoveries.
You will get real feedback, from real physicists/experts.
Be prepared for brutal comments though.
I am not so good in computer technology to publish according to their demand, but thank you for site.
Not much chance of getting 4 Nobles then.
You may ( or may not ) be right, but your bluster sounds as convincing as Trump’s claims of his successes at the UN.
El Nino is still not visible.

Sorry.
The surface temperature of the Pacific in the area of the Humboldt Current is low.
We can disperse water along Pacific shore by pumps to increase evaporation in cold water condition. It will increase humidity in air and possibilities of rains. Prevention of drought and wildfires are cheaper than damages from them.
Sea surface temperature indicates the operating range of the jet stream.
Wildfire Losses in the United States, 2007-2017:
2007 – $3.9 billion; 2008 – $2.4 billion; 2009 – $0.35 billion; 2010 – $0.4 billion; 2011 – $1.800 billion;
2012 – $1.1 billion; 2013 – $.7 billion; 2014 – $0.2 billion; 2015 – $2.2 billion; 2016 – $1.7 billion; 2017 – $4.5 billion
These losses are completely correlated with La Niña/El Niño
El Nino is (historically by definition) “The Little One”, the ‘Child who arrives at Christmas’, i.e. 12/25.
Be patient Ren.
A moderate El Nino will bring welcome rains to many parts of the Western Hemisphere.
The North Atlantic above the 45th parallel is very cold.
Another great article.
I noted with some sadness that the Institute Of Physics in this month’s Physics World page 44 mentioned of the 10 things that changed the world 30 years ago as:
‘NASA climate scientist James Hansen uses the term “Global Warming” in testimony to the US congress, sparking world wide interest.’
BUT forget to add that this was the start of the humongous waste of scientific brain power on the non-problem about the life giving photosynthesising gas possibly having a minute amount of warming. This has depleted much needed funding in other areas our brains could be used for IMO.
I watched land fall on the weather channel interactive and Florence never attained sustained winds over 50 mp, though gusts hit 75mph. This was Wilmington where the eye wall went through. Not even a cat 1 though plenty of damage and sorrow caused.
Why are you conflating “hurricane” and “storm”, don’t you know the difference, or are you deliberately intending to mislead? Seriously, what is up with that?
Mankind is mature enough to reduce any weather and climate disasters: drought, flooding, wildfires, tornadoes, thunderstorms. sall of that can be a history, if I can publish my ideas 14 years ago.
Tomorrow, snowstorms will hit the northwest US.
