It’s not the heat It’s the humidity
By Francis Tucker Manns, PhD


Abstract: The sun controls climate change. Not industry. Not you. Not me. It is the sun.
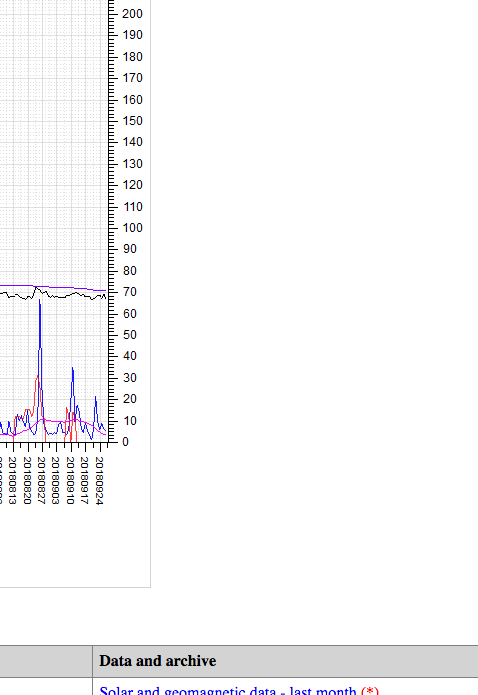
Solar cycle 24, the weakest in 100 years, is stumbling to an end. The sunspot cycle averages about 11 (± 1.5) years. There may not be any sunspots this week. In the spring of 2017 the sunspot number was low or zero and Canada was plagued with spring floods from melting snow and heavy rainfall.
Major floods have occurred in Quebec and caused a human tragedy in loss of habitation; the army was called in. The fire chief was lost at Cache Creek, BC. Canada is wet from the Pacific to the Atlantic.
Toronto Island is sandbagged and may be closed for several months. The Lake Ontario high water is the 22nd anniversary of the previous highest water levels recorded. This year’s Minden Ontario flood occurred on the 11th anniversary of the Peterborough flood. But not just that, worse calamities, Hurricane Hazel (1954) occurred during a solar minimum. Eighty-eight people died in Toronto and Toronto abandoned living in its beautiful wooded ravines. Toronto, if you will, is within a Great Lakes cloud chamber.
History supports this hypothesis – the horrible Johnstown flood occurred on 31 May 1889 with loss of 2,200 lives. The Johnstown Flood of 1936 and another Johnstown flood in 1977 occurred during solar minima. In 1977 nearly 12 inches of rain fell in 24 hours, when a thunderstorm stalled over the area.
But these phenomena are not restricted to North America or Canada. In early June, rescue workers battled to reach remote areas of Bangladesh hit by landslides and heavy rains that have killed at least 137 people, with dozens more missing. “Authorities say hundreds of hillside homes were buried by landslides in the southeast of the country as people slept. The landslides were triggered by heavy monsoon rains, with 343 millimetres (13.5 inches) of rain falling on the area.” In May, Sri Lanka has suffered 2,000 deaths due to landslides, and 200,000 displaced this spring. On 1 July 2017 China reported the highest rainfall in 60 years. The climate is changing globally, but it’s not caused by the heat. It’s the humidity.
The effect of the solar cycle is seriously misunderstood. There is no correlation with the number of sunspots, though we know that sunspots are a proxy for the sun’s electromagnetic behavior. Astrophysicists in Denmark, however, have teased out the relationship between sunspots and climate (Friis-Christensen and Lassen, 1991). It’s the frequency of the wave. A very tight correlation to climate is coupled to the frequency of the solar cycle. When solar cycles are shorter than 11 years over several cycles the planet warms; when cycles are longer than 11 year for a few cycles, the planet cools. There has been a strong (95%) correlation between the solar cycle and cooling and warming of the northern hemisphere over the past 150 years. Climate, moreover, is also tightly tied to what Zharkova et al. (2015) have called the heartbeat of the sun. Ironically, Lockyer in 1872 called sunspot observation the meteorology of the future. Ask your weather bureau if this is true. The emphasis has always been on the peaks, but the real story is in the troughs and the wavelength.
Here is how it works. When sunspot peaks are far apart, the electromagnetic shield is down for a long period of time, cosmic radiation seeds the clouds, and there is more rain and snow (with its albedo reflectivity) and the planet cools (Svensmark, J. et al., 2016). The rainfall makes sense in this context because cooling results in condensation. When the sunspot peaks are frequent the minima have less effect and earth warms (Svensmark, H. and Friis-Christensen, 1997; Svensmark H., et al. 2007).
This pattern is completely consistent with the extremes, the thundery hot summers and cold winters of the Little Ice Age which coincided with the Maunder Minimum when sunspots were few or completely absent for 60 years. Zharkova’s research group is predicting another Little Ice Age beginning right now, today, or at the end of Cycle 24. So think many others who study the sun and think it trumps carbon dioxide (Shaviv, 1998).
How does that happen? Here’s how. NASA says, as we enter the solar minimum, our wispy atmosphere shrinks. NASA has learned to juggle satellites that drop into lower orbits during the solar cycle. Lower down in our atmosphere the sun drives our winds and the most important winds of all, that rule all the others, are the jet streams that power around the planet at well over 160 kilometres an hour.
When the atmosphere contracts, the jets start to meander. The meandering happens because there is a space problem; the same jet stream is jammed into less volume within a shrunken atmosphere; hence the jet streams kink. The cloud levels are slightly but measurably lower as well.

Figure 1: The relationship between the weather and a jet stream Rossby wave.
The meanders with ridges and troughs (similar to those of a great river like the Mississippi but far more vast) typically carry the weather fronts with them with low pressure and a high pressure zones: a ridge and a trough. The jet streams maintain their velocity as in a solar maximum, but wander farther north and farther south taking colder air south and hotter air north. The meanders are called Rossby waves. Hence, wide temperature variations occur; most of North America had two temperature swings in May from the teens to the high twenties and back again. Kinking of the jet stream causes extreme weather. As the wandering is slow, the storms behave like broken lawn sprinklers. Under certain conditions, a normal weather front can cause dangerous flooding because, although the jet stream is moving rapidly (consistent with its name) the lateral course of the jet stream meander wanders slowly from west to east and occasionally stalls.

Figure 2: Condition of the Greenland Ice Sheet as of September 2018. Numerous papers were produced attributing Greenland’s icy decline in 2011-12 to arctic temperature amplification (Greenland Climate Research Centre and Danish Meteorological Institute). The Greenland Ice sheet has rebounded strongly since the summer of 2011-12.
The result is like a broken water sprinkler dumping rain or snow in one spot, a region out of equilibrium with local conditions on the ground. The result is flooding or a numbingly serious blizzard. Today the Gulf Coast is swamped by tropical storm Cindy caught in a slowly moving jet stream.
We are witness to the climate change we have been taught to fear, and it is not anthropogenic; it is extraterrestrial.
It has never been proven that carbon dioxide affects the climate. It is an interesting hypothesis, but not only is it not proven, I am unaware of any experimental support for the CO2 hypothesis. It stands equal to any other unsupported hypotheses – all the hypotheses of ghosts or special creation, but does not rise to the credibility of a theory without experimental support. Friis-Christensen and Lassen (op cit), however, estimated a 95% correlation with sunspot peak frequency, a remarkable correlation, rare in natural science; the editor of Science magazine at the time commented that the “ball [meaning Anthropogenic Global Warming] is now in the other court”. Only matching your right hand with your left might exceed 95%. Not meaning to be glib, but, 95% for solar leaves only 5% for any other cause (without considering the standard deviation).
The alarmist outcry was that “correlation is not causation”, yet the same alarmists, using the precautionary principle (which is not science) asked us to believe a correlation of temperature with CO2. Moreover, in recent years (the entire 21st century) there has been no correlation even as CO2 continues to nudge above 400 parts in 1,000,000 parts in the atmosphere over Hawaii.
The Danish laboratory now directed by Henrik Svensmark and sustained by his colleagues has produced experimental support over the interval since 1991 for cloud seeding by cosmic radiation from deep space a cycle modulated by an electromagnetic solar cycle. It’s a mouthful and a complex theory but it has been tested in cloud chambers in Copenhagen and also by an international team of astrophysicists in THE LARGE HADRON COLLIDER in Switzerland. Despite difficulties with introduction of extraneous experimental matter (organic aerosols were introduced to complicate the trial) there can be little doubt that cosmic radiation seeds the clouds whether the nuclei was sulphur or Great Smoky Mountain aerosols. Moreover, the Greenland Ice sheet is growing again and the California drought has broken. During the recent solar maximum of solar cycle 24 the melting of the Greenland Ice Cap was the foremost worry of the alarmists.
In Figure 3 one sees the big picture of the solar cycle wavelength or frequency. There is an empirical relationship between the cumulative length of several solar cycles and past climate. For brevity, the Maunder Minimum is not shown. It falls on the left of the chart and shows no cycles and few sunspots, hence the name minimum. It was a lengthy period of the Little Ice Age that was characterised by Alpine glacial advance, epidemics, and the potato famine. The Dalton Minimum was similar and the continuation of the Little Ice Age. Since then the frequency has stabilized around a half wavelength of 11.0 ± 1.5 years. I call this as the Goldilocks trend (obviously not too cold.

Figure 3: The Goldilocks Trend or the Big Picture. This is a plot of alternating elapsed time between Maxima and Minima of the solar cycle. Please refer to the cover page for the conventional views. Data from National Geophysical Data Center web site, Boulder, Colorado, USA.
and not too hot) we have enjoyed as the planet warmed. However, the Goldilocks trend may be about to end. There has been no statistical warming for the 21st century despite the rising CO2 and the corresponding solar cycles have been approximately 12 years long. If the current cycle 24 lasts much longer, expect Niagara Falls to freeze over as it did in 1912 and 2014.
Conclusions
The logical progression is for the rain to fall, the clouds to clear, the earth to cool and humidity to drop and warmth to not return until the sunspots return. Regardless whether or not this forecast is correct, we must understand the danger of Lysenkoism – synonym for flawed government science – is that public science policy can lead to disaster. For example mistakes like the cholesterol [statin] myth started in the 1950s by Eisenhower’s doctors or the denial of lead poisoned water in Flint Michigan by the EPA.
NGOs, Environmental Lobby Groups, industries and governments are creating policy for the warming forecast, but serious cooling could be coming. Keeping our environment healthy is paramount to our prosperity but free speech in science and not false consensus is part of the solution.
“…Yet, in holding scientific research and discovery in respect, as we should, we must also be alert to the equal and opposite danger that public policy could itself become the captive of a scientific technological elite.”– Dwight Eisenhower, 1961
References
Friis-Christensen, E. and K. Lassen, 1991: Length of the Solar Cycle: An Indicator of Solar Activity Closely Associated with Climate, Science 254 (5032):698-700, December 1991.
Lockyer, J. N., 1872: The Meteorology of the Future, Nature, 12 December 1872, pp 98 – 101.
Shaviv, N. J., 1998: Using the Oceans as a Calorimeter to Quantify the Solar Radiative Forcing, J. Geophys. Res., 113, A11101, doi:10.1029/2007JA012989.
Svensmark, H. and E. Friis-Christensen, 1997: Variation of Cosmic Ray Flux and Global Cloud Coverage—a Missing Link in Solar-Climate Relationships, Journal of Atmospheric and Solar-Terrestrial Physics, Volume 59, Issue 11, July 1997, Pages 1225-1232
Svensmark, H., J. O. Pedersen, N. D. Marsh, M. B. Enghoff and U. I. Uggerhøj, 2007: Experimental Evidence for the Role of Ions in Particle Nucleation Under Atmospheric Conditions, Proceedings of the Royal Society A: Mathematical, Physical and Engineering Sciences, 463 (2078): 385–396. Bibcode:2007RSPSA.463..385S. doi:10.1098/rspa.2006.1773.
Svensmark, J., M. B. Enghoff, N. J. Shaviv, H. Svensmark, 2016: The response of clouds and aerosols to cosmic ray decrease, Journal of Geophysical Research: Space Physics, Volume 121, Issue 9, pp 8152–8181, September 2016.
Zharkova, V. V., S. J. Shepherd, E. Popova and S. I. Zharkov, 2015: Heartbeat of the Sun from Principal Component Analysis and Prediction of Solar Activity on a Millennium Timescale, Scientific Reports 5, Article Number: 15689.
==============================================================
NOTE: I don’t necessarily agree with this article, but thought it was worth discussing – Anthony
Observations are also consistent with this different mechanism:
http://joannenova.com.au/2015/01/is-the-sun-driving-ozone-and-changing-the-climate/
To get the observed outcome it is necessary for variations in solar activity to change the gradient of tropopause height between equator and poles.
There is absolutely no reason why these essays are not parts of the same elephant. The Jainist story of the five blind men touching an elephant had a wise man who watched them deliver their findings. Contrarians to conventional climate consensus are analogous to the blind men. There is a holistic answer.
Like Svensmark you just point to a correlation and assume that the cloud increase is due to cosmic rays providing more condensation nuclei.
In reality, the more meridional jets will produce more clouds regardless of such nuclei and you can only get more meridional jets by shifting the gradient of tropopause height between equator and poles.
So, I think I see the whole elephant whereas you and Svensmark just see a trunk or a leg.
Perhaps the issue will clarify itself. I expect that the truth on climate change will obvious by 2025.
Stephen – I’m not sure that Svensmark just pointed to a correlation and assumed …..
My feeling on this – and I haven’t studied it enough to have more than just a feeling – is that you and Svensmark are both right but on different time scales. Your ideas about the jetstream seem reasonable to me, and operate on relatively short time scales, something like a year or so up to a decade or so. Svensmark’s ideas also seem reasonable to me, but operating on longer timescales, something like a few decades up to centuries.
As I see it, one reason for the difference is that the jetstream variations operate primarily on the atmosphere so take effect with little delay, whereas cosmic rays’ effects are felt primarily in the oceans and are therefore subject to a substantial time lag before they can show up noticeably in the climate.
I’m not at all certain about any of this, so I’m open to contra ideas.
Mike,
Svensmark does not say how more cloud condensation nuclei from more cosmic rays enables more meridional jet stream tracks whereas the ozone variations that I point to do.
As stated in my hypothesis the thermal effects of those jet stream changes and the cloudiness changes that ensue are spread over multiple solar cycles and show a multi-centennial cycling effect that follows changing solar variability but sometimes supplemented and sometimes offset by internal oceanic cycling.
But, but, but…I thought that the science was settled. After all, don’t 97% of Climate Scientists agree?
Settled in the same way the garbage in your compactor is “settled”.
And as the sun fades in intensity slightly some people observe and measure its effects on our atmosphere (so climate modelers pick the bones out of that.)
The obvious consequence is world IS getting colder!
https://spaceweatherarchive.com/2018/09/27/the-chill-of-solar-minimum/
In the future “children won’t even know what sunspots are”.
/sarc/
Whenever I see someone referencing “(Friis-Christensen and Lassen, 1991)” I know for a fact that they haven’t done their homework. That hoary old chestnut has been roundly falsified by more recent data.
I also don’t understand Figure 3. It shows sunspot cycle lengths of 17 years and 7 years, neither of which I can find in the record. It also disagrees with the record at various times. Finally, it starts with a number so large it is off the chart … say what?
Also, look at the period between about 1890 and 1910, where it has four data points in that interval … say what? That makes no sense at all.
It also shows Niagara freezing over when the length of the solar cycle is 13 years and 10 years, plus a third time in 2014 for which we don’t yet have data. SO WHAT?
Seriously, two data points? It gets worse. In fact, the solar cycle during those two freezeovers was 12 and 11 years …
Overall?
Doesn’t pass the laugh test.
w.
Internal ocean cycles tend to disrupt the solar influence from time to time.
Mind you, I do not agree with their hypothesis as regards causation. Much better to regard global cloudiness as changing with a solar induced change in the behaviour of the jets rather than anything to do with cosmic rays or electromagnetic fields.
More meridionality involves longer lines of air mass mixing thus more clouds and a cooling world.
One must focus on the role of ozone in the lower stratosphere in setting the height of the tropopause. Then all one needs is for the solar effect on that ozone to differ between equator and poles so as to change the gradient of tropopause height.
Measurements do seem to be throwing up such differences.
I do not understand why a lot more attention is not paid to ozone, which operates as a heat control valve. If you destroy ozone at high altitude, the area underneath cools rapidly. See Prof Lu in Waterloo’s works for details on the chemistry of this effect. He holds that ozone, which is controlled by the sun, can explain all temperature changes since 1960. So, it’s still the sun.
Prof Lu goes for the idea that cosmic rays affect ozone amounts in the upper atmosphere so as to vary the size of the Antarctic ozone hole but doesn’t make any connection with changes of the tropopause gradient between equator and poles so as to change global cloudiness via jet stream variability.
So, even if it is cosmic rays that are the culprit he does not provide a plausible mechanism for their effect on tropospheric air circulation.
In any event, my mechanism could accommodate a cosmic ray effect as well as variations in solar wavelengths and particles but I favour the latter as the more likely cause.
One way or another solar variations change global cloudiness and cause natural climate variability on a multi-centennial time scale subject to interference from internal ocean cycles and thus far I have the only complete chain of causation that fits all the observations.
Stephen, if ocean cycles disrupt your all powerful thesis, it begs the question then that do ocean cycles trump your thesis?
Argumentum ad hominem The alarmists picked Friis-Christensen and Lassen apart because it scared them. At the least, it is now supported by experiment because the Danes keep thinking. Pinatubo erupted in 1991 so that was easy pickings… I chose F-C and L(1991) because it made people think.
Dr. Francis said:
Nonsense. I said nothing about the men, only that their science had been falsified. Please do not misrepresent my claims.
Nope. Their claims fell apart because a) later data didn’t agree with their hypothesis, and b) errors were discovered in their data.
See inter alia Journal of Atmospheric and Terrestrial Physics, “Solar activity and terrestrial climate: an analysis of some purported correlations“, Peter Laut, and also:
Eos,Vol. 85, No. 39, 28 September 2004, “Pattern of Strange Errors Plagues Solar Activity.
and Terrestrial Climate Data”.
Best regards,
w.
Aha, Willis , who purports to disprove hypotheses by thought models. As if metal can (pun also) act like gas. Only with the help of wacky-baccy. Then, disputed, who accuses folk of the very behaviour he uses. Alinsky would be proud, if no one else.
[Criticize the analysis, or the rebuttal, not the person. .mod]
A correlation, a proposed causal mechanism and a promptly testable prediction based upon that hypothesis. Looks inconveniently a lot like real science to me.
The degradation of the publics respect for legitimate scientific endeavor will be the lasting legacy of this global warming farce. Once the Film Flam man is widely recognized credibility is forever compromised.
It is actually unfortunate that the public is largely unaware of the replication crisis in science or there would be hue and cry to cut funding. Deep, deep funding cuts would be a very good thing in climate science and wouldn’t hurt many other ares as well. The sciences have become populated with second rate opportunists and politicians.
Dwight Eisenhower said that in his final address but all we remember is the military industrial warning.
a) no single major weather event (hurricanes, droughts, floods, big snow falls, etc) can be linked directly to solar activity or to the CO2, methane, Mann’s trick or some other magic control knob.
b) there isn’t much new in the analysis provided that has not been discussed at great length here and elsewhere. Some of the ideas have been outright rejected and the rest have large degree uncertainty and lack of a convincing correlation.
c) the sun is by far the most likely cause of the climate change, but for time being I am to sorry to say ‘we simply don’t know how’
There is some observational data that supports a link between a rapid Ap index change (increase due to solar flaring/CMEs on solar wind environment around Earth) which can potentiate stronger tropical cyclone development patterns.
I’m not claiming I know what that physical linkage would be between Ap index and TC development/strengthening. Some thoughts might be a weakening of shearing winds aloft that inhibit cumulonimbus storm tops formations and cyclonic development in TC development regions. Or it could be a shifting of the tropopause downward to allow storm to better connect to the cold lower stratosphere.
For example Dr Ryan Maue this past August 30 noted that the Tropical Atlantic Hurricane basin forecast models had indicated a sudden switch in states to one strongly favorable for TC development had just occurred. While August was exceptional for its lack of Atlantic basin TC development.
https://twitter.com/RyanMaue/status/1035190269430431745
And indeed we saw this happen with a near simultaneous formation of 4 Atlantic Basin TC’s in a remarkable 5 day period between 9/2 to 9/7 (storm names: Florence, Gordon, Helene, Isaac). And we know what Florence unleashed on North Carolina.
Ad what did Ap index do late August to today?
Huge Ap index spike on August 26-27 and within 48 hours the models started showing strong TC development potential for the Atlantic basin.
Something very similar happened in 2017 with Ap index (the Ap Index hit it highest in 12 years due to some large X class flares and CME’s ringing the hell out of the Earth’s geomagnetic environment) and Maria just before it went Cat 5 and smoked the Lesser Antilles (Dominica and Guadeloupe).
Something similar happened in 2005 with Ap index surge and TC development in that infamous year of Atlantic basin hurricanes (see Katrina, Rita, Wilma). The Planetary A index was what was available then, different scale scale than Ap.
See here:
http://www.solen.info/solar/old_reports/2005/october/20051031.html
All in all, the data suggests there is a link between Geomagnetic Ap surges and Atlantic Basin TC development potential. Why that is, I do not know.
There is some link between fluctuations in ionosphere’s equatorial electro-jet ( region where the high-altitude winds of subtropical jet stream blow plasma across the Earth’s magnetic field) and the tropical thunderstorms.
http://www.nasa.gov/centers/goddard/images/content/154188main_plasma_bands_lgweb.jpg.
Strong solar flares or a CME can shift the earth’s magnetic field up to 2% over period of few hours.
here is link for the September 2017, note nearly 2% spike on 8/11, just few days later “On September 13, the NHC began monitoring a tropical wave southwest of Cape Verde” (wikipedia) which evolved into hurricane Maria reaching category 5 strength.
Was there cause and effect, or is it just a coincidence it is difficult to say.
spike on 8/9
Let’s make a prediction to test the hypothesis.
Hindcasting is what the IPCC and the Warmists do. Real scientists are informed by making predictions and testing those.
Here is the Ap index forecast for October.
https://spawx.nwra.com/spawx/27do.html
It forecasts an Ap spike on 8 October and another smaller one on 19 October.
Hypothesis would predict formation of an Atlantic basin hurricane 4-6 days after those spikes.
Prediction: 1 or more hurricanes will form 12-14 October, and at least 1 of those ill strengthen significantly on or about 19-20 October.
Thank you for this survey. Pat Frank noted that the CO2 models could either mimic temperature or humidity for a short time, both not both simultaneously. And his conclusion that the predictive value of CO2-based temperature forecasts of even a few years would be minimal for this reason has been borne out by the temperature record, Bill Nye, James Hansen, et al, not withstanding. The idea that the Svensmark mechanism is cumulative in its action would seem to motivate a theoretical analysis of Rossby Wave amplitude along the lines of von Karmen’s 2-D vortex street. Your comments that the thinning of the upper layer of the atmosphere amplifies the jet stream’s excursions suggests that such an analysis has been done. Do you have a reference?
It’s been out there from NASA for years but there is a refresher on WUWT or refer to the thermosphere argument on Space Weather website. I can supply it if you like. mannsfrancis[at] gmail.com
Moderators, please cover Dr. Manns’ butt. I don’t want others to make the same error I did and have their identity snatched. Login passwords would be nice.
Dr. Manns, I appreciate the offer, but as “Pop” mentions, making your email known might allow others to snatch your WUWT identity if that is the email you have used on this site. And for the same reason I am reluctant to contact you using my email, since I can’t be sure that you are truly you. And I don’t have that many email addresses, although this makes me think it might be useful to have one that I could use in such situations. As Pop mentioned, login passwords would provide another layer of protection. Presently, your email serves as that password.
Faugh! Who uses their ‘real no 1 email’ on any public site.
Get yourself a domain or 5 and create ‘disposable’ addresses like spam000001@mydomain.com
Then when the conversation is over, erase them.
Some banks will issue one-time, limited credit, card numbers for single transactions to un-trusted peers as well.
When a man cannot even publish his email address anymore, the terrorists have won.
My goal, if I have any goal, is to lower the level of dialogue so the rest of my family and friends can understand instead of rolling their eyes and saying they do not understand. Our issue, if I can include myself in the scientific community, is simple – we are unavailable to the media, politicians who follow them when it serves their purposes and the publish or perish community of the modern pay-wall community.
I was taught and mentored by a geologist who overlapped with Conan Doyle and Charles Darwin, i.e before isotopes and scanning electron microscopes, and when logic and argument prevailed. He had to tell me every day, ” Fran, the minute you begin to believe your own hypothesis, you are a dead duck as a scientist.” That advice is very difficult to live with but it matters to me. When I’m wrong, I will turn on a dime and admit it. I’ve turned on a dime before.
I think my little essay has exposed some of the prelates of the climate church. I’m not a True Believer (see Eric Hoffer) It looks very healthy to me when everyone speaks.
I would have reversed the order of the two phnomena in the headline.
“and also by an international team of astrophysicists in THE LARGE HADRON COLLIDER in Switzerland”
ROTFLMAO.
Thanks for the Friday Funny, on this not so funny week of watching US Democrats being Democrats, that is confabulate, cheat, and try to smear an honest person in their pursuit of power.
The director of Hadron would not permit the publication of the Svensmark conclusions of the experiment only their data. How bad is that for the unbiased science of climate change?
If you want to be taken seriously on scientific issues, then your language needs to be more carefully measured and precise when discussing scientific issues or presenting a technical argument for serious consideration.
CERN is a much bigger entity than just the LHC, or “Hadron” as you seem to call it. The mostly particle physicists at CERN/LHC would probably object to being labeled astrophysicists, an entirely separate field. The LHC is mostly in France, but it does have some of its ring in Switzerland (a quite minor point).
Your objection to the way CERN Director Rolf-Dieter Heuer cautioned the CLOUD team on how they should publish the results without interpretation. The Continental Europeans especially have a long (well-)earned reputation and history of over-interpretation in many areas of science. My PI (back in the day) used to warn me and everyone frequently at our group’s weekly lab meetings to not over-interpret results, because we all have internal biases where we want our hypothesis to be supported. Support for Svenmark’s Hypothesis is likely being over-interpreted IMO.
The CLOUD results were superficially covered in 2011 in the pulp press, such as here:
https://www.theregister.co.uk/2011/08/25/cern_cloud_cosmic_ray_first_results/
That article has a quote from CLOUD’s lead physicist Jasper Kirkby:
(my bold)
IOW, CLOUD results, and by extension Svenmark’s Hypothesis, can only account for a small fraction of observations for cloud formation.
If you really want to dig into what was being said and done, digging through all the Nature papers and any other online materials would be necessary to get past the pulp-fiction pablum of popular press reporting.
While GCM supercomputer modelling teams should (if they could) integrate more of the CLOUD findings into their models, much of this integration is done already via the tuning parameters. That is because there are no appropriate first principle cloud-droplet-nucleation microphysics, precipitation rates, or convective physics that can be added to models at run at the typical 25km x 25 km grid scales GCMs use. Further the water vapor-convection processes (aside from cloud droplet nucleation) are still hugely unconstrained by observations or similar experiments like CLOUD. This uncertainty in parameter values allows the modellers to effectively achieve whatever desired CO2 sensitivity output that meets their (biased) expectations.
Joel O
You will have to be more precise too:
IOW, CLOUD results, and by extension Svenmark’s Hypothesis, can only account for a small fraction of observations for cloud formation in the lower atmosphere.
His “lower atmosphere” is the troposphere, where >99% of weather and climate occurs. So it should go without saying.
Crispin, what about NLCs and persistent contrails? Are these lower stratospheric ice clouds showing GCR induced amplification? I’ve seen very few days without some sort of high clouds or haze passing through during the past couple of years now.
Don’t ice clouds produce more albedo than water vapor clouds?
In the original article of Svensmark & Lassen is a pretty good correlation between the sunspot number and temperature. This correlation does not pass the test of the solar cycle number 23, which was one of the longest ever measured, i.e. 13.5 years and the temperature was at the very high level. The last 20 years have also shown that the sunspot number is not a very good measure of the sun acitivity. During the solar cycle of 23 the sunspot number was very low but the TSI (Total Solar Irrandiance) was at almost the all-time high.
But that is not a problem because there are directly measured TSI values and estimates of the historical values. I want to show my own result about combining four factors affecting the temperature: TSI, GH gas forcing, astronomic harmonic resonance and the volcanic activity. Here is a figure about this model. Its coeffcient of correlation is 0.9 during the time period from 1630 to 2010. And by the same token. We have a GH effect in our atmosphere and CO2 has a role in it; that is a fact. The question is what is the correct forcing of CO2. According to my research studies the CS is only 0.6 C (compare 1.8 C by IPCC).
I am sorry tht the figure does appear directly on the page but you can click the link and it seems to work.
There seems to be a problem with image caching since the site crashed.
Antero Ollila says: September 28, 2018 at 11:38 am:
Yes, 0.6C would be a good maximum figure. But i still hold with james Clerk Maxwell that the very nature of gases means (Ideal Gas Law) that they all instantly move outwards and upwards, on average,with any energy input that exceeds by a quanta, what they already have. The comparitively vast c.12angstrom gap between molecules of c.2angstrom units as opposed to all solid phase matter, means gases just act differently. Those who miss such facts of physics also miss why it can be such fun when visuallised…. Pressure, not radiation, which is an effect not a cause. Brett
Is it still possible to subscribe to comments with the new setup? I can’t find anywhere to do it.
Thanks in advance,
w.
Willis,
Yes.
You have that option when you comment. At least I do.
Willis, like John said….before you “post comment” look right above it….you should have two blocks to check…..”Notify me of follow-up comments by email.”….and …..”Notify me of new posts by email.”
…you have to check them before you post the comment
Bizarre. I don’t have that option. Here’s a screenshot.
w.
Willis, try using the Chrome browser if you are not now.
and be prepared to recieve an email asking if you want to subscribe to comments every time you do.
Yes, I’m using Chrome and have both options available.
More annoying to me is the site doesn’t save my credentials anymore. I have to re-enter my name and e-mail address every time I post. Been happening since the crash to the comment system. I have no issue with any other web site.
DJ,
Try and left click twice on the ‘name block’ and see if the second click gives you a drop down box with your name. Then click on your name.
Same for the ’email box’
Works for me in Firefox.
@eyesonu
Thank you for your comment. However, the autofill options don’t include the abbreviated name I use here, nor the e-mail address associated with that handle. Previously, when I came to WUWT, the name and e-mail boxes would automatically fill in without my starting a post.
My Safari browser shows the options. I use them from time to time and they work fine. If I type the first letter of my name a pop up allows me to click on my name and autofill the rest. The edit after posting function was great. Hopefully, we will get it back.
The Johnstown Flood of 1936 was cause by a dam break.
“The Johnstown Flood of 1936 was cause by a dam break.”
True, but the one of the causes of the dam break was the 6 to 10 inches of rain in 24 hours that occurred a couple of days prior to the dam break.
The documentary I watched claimed Frick, Andrew Carnegie’s partner, ordered the dam lowered so a carriage way could be built on top of it (so he could save a few minutes driving to their private club). This made the dam unstable.
Frick had a most appropriate name.
I have not heard that claim (of the dam being lowered for carriage traffic.) The dam “fish trap gate” was out of service (clogged), and so the floodgates failed to drain enough to protect the top of the dam. The initial overflow happened at the trashgate low spot.
I’m wrong: Following from a later page of the reference above:
https://www.jaha.org/attractions/johnstown-flood-museum/flood-history/the-club-and-the-dam/
And the result?
Excuse me, I’m talking about the 1889 flood.
Yes, the most famous Johnstown flood was in 1889 (dam break of the Pittsburgh “country club” (resort). The publicity and horror of the flood began to several social changes and attitudes towards the newly rich that we still see today in many places. But there were several other floods almost as bad. (Yes, “climate” repeats its catastrophes, doesn’t it?)
From https://www.jaha.org/attractions/johnstown-flood-museum/flood-history/1936-1977-floods/
“There has been no statistical warming for the 21st century…”
Details…details…
There has been nearly no statistically significant warming in the 21st century…
“Statistical significance” has a standard definition. These words are not used randomly.
Readers: If the author doesn’t get it right, make sure you correct it when repeating his otherwise salient observations.
If the 21st century begins in January 2001, then *all* the surface temperature data sets show statistically significant warming in the 21st century.
GISS: 0.190 ±0.121 °C/decade (2σ)
Berkeley: 0.175 ±0.114 °C/decade (2σ)
HadCRUT4: 0.136 ±0.115 °C/decade (2σ)
NOAA: 0.178 ±0.122 °C/decade (2σ)
http://www.ysbl.york.ac.uk/~cowtan/applets/trend/trend.html
Of the satellite TLT data, both show ‘best estimate’ warming since 2001, though the rates differ noticeably. RSS TLT v4 shows a similar warming rate to the surface data sets, but its trend isn’t quite statistically significant yet due to the typically larger fluctuations in the satellite data compared to surface. At 0.168 ±0.184 °C/decade (2σ) since Jan 2001, RSS only just fails the 2σ significance test by 0.016 °C/decade.
UAH TLT v6 shows the slowest rate of warming since Jan 2001, at 0.115 ±0.181 °C/decade (2σ); a good way short of statistical significance and in pretty clear disagreement with RSS, despite using similar data. It’s fair to say that at least one of these two satellite data producers is mistaken.
(Same source as above.)
“There has been nearly no statistically significant warming in the 21st century…”
But this is also a meaningless argument. Absense of evidence is not evidence of absense.
There is statistically significant warming, by all datasests over the last 40 years or so. That includes the 21st century. If you want to say that the 21st century warming is different to that of end of the 20th century, you have to demonstrate a statistically significant change.
If you take UAH as the data set most likely to show a change in the 21st century, we find that there was no statistically significant warming up to 2001 and no statistically warming after 2001, yet join the two together and there is statistically significant warming.
The diference in the warming rates between the two periods is a couple of tenths of a degree per century (1.37 / century from 1979 – 2001, 1.15 C / century since 2001). This compares with a warming rate of 1.28 ± 0.58°C / century over the entire data set (using Skeptical Science’s confidence intervals). Neither the 20th or 21st century warmig rate is significantly different to the overall trend.
I’ll accept the possibility that it IS lack of sunspots, with observations that things seem to be out of whack. By that I mean simple observations that I can physically record indicating the ‘out of whack’ analogy.
For example
– geese migrating in the direction of the Mississippi much earlier than normal.
– violets now growing and blossoming in my lawn when they should be dormant. The violet generally stops blossoming by June, but in this area, June was not warm at all and July gave us a very brief, hot summer. Now we’re having cold nights and warmish days, and the violets are blossoming when they should NOT.
– sundogs further from the horizon than normal, shedding ice.
– temperatures in the 30s at night now, when they should be in the low 50s to mid-40s, and I have had the furnace running since Sept. 10.
– running the furnace in mid-June, with cold temps, blowing winds, and rain.
These things are not normal in this area. Colder air is expected to come down from a general northwest direction, i.e., Alberta province in Canada. Anecdotal? Yes, but I keep track consistently. Snow on my front steps in April, up to 12 measured inches, is NOT normal for this area, period. Three years of it means something is completely off kilter.
These things are real signs that something is off kilter. If you choose to ignore them, it’s your choice, but it is not a good idea to do so.
I’m just glad I have a gas-fired furnace instead of a windmill-powered deal.
Today? What year are we in? Are we referring to Tropical Storm Cindy of 1959, 1963, 1981, 1987, 1993, 1999, 2005, 2011, 2017, or 2023?
There seems to be so much confusion as to what factors cause cloud formation, so why not go back to the historical records. Apart from the known sources I am sure that records kept by churches and univeresties way back to at leasttt the 10 century would show a clear pattern of cloudiesness and the wether occuring at the time.
MJE
One of the best proxies fir summer rainfall is found in the Wisden’s cricket almanac. Drawn games are usually because rain stopped play.
Is it okay to shiver or do we need to have the full, perfect model in place before that’s acceptable?
Could this be an alternative explanation for cloud formation and precipitation?
” Extremely accurate satellite measurements spanning most of the globe revealed a distinct correlation between sea-surface temperatures and the eleven-year solar cycle. The effect was tiny, not even a tenth of a degree Celsius, but it was undeniable. ”
https://history.aip.org/climate/solar.htm
“Regardless whether or not this forecast is correct, we must understand the danger of Lysenkoism – synonym for flawed government science – is that public science policy can lead to disaster.”
I really despise any association between today’s climate science and Lysenko. That alone is enough to illustrate the bias under which this writer suffers.
If people are so certain that scientists are subject to the influence of their funding sources, it should also be taken into account when the fossil fuel industry, think tanks and the Koch brothers get involved in funding and promoting science. It’s also worth noting the current administration’s “public science policy” and the people and institutions that interact with and advise policy makers. The accusation of “Lysenkoism” cuts both ways.
Exactly what science is funded bu the Koch brothers? What papers, by which scientists, at which institutions?
David, your memory is deficient.
quote:
===============
Everyone’s Talking About The Koch Brothers-Funded Study That Proves Climate Change Is Real
Over the weekend, UC-Berkeley professor Richard Muller outed himself as a “converted” climate “sceptic” in the New York Times after his Berkeley Earth Surface Temperature project concluded the earth’s surface temperature had increased 2.5 degrees Fahrenheit in the past 250 years and one and a half degrees in the past 50 years, likely entirely because of human industrial activity.
What makes this newsworthy, according to The Guardian, is that BEST had received $150,000 from the Charles G. Koch Charitable Foundation, whose namesake also runs the climate [pseudo]sceptic research program The Heartland Institute.
https://www.businessinsider.com.au/koch-brothers-funded-study-proves-climate-change-2012-7?r=US&IR=T
====================
&
Koch brothers lead billionaire resistance against Donald Trump
You should get out more.
Khwarizmi,
Thread after thread I’ve been asking Kristi direct questions which she never answers. I was interested in how she would back up her accusation, not your response.
$150K is mice nuts btw in the grand scheme of climate science.
davidmhoffer,
Did you ever see my reply to our last interaction? I didn’t get back to you within 24 hours, and that means I never answer??? I don’t know about “thread after thread.” I didn’t know you had been keeping track. Sorry if I missed you. That happens.
Willie Soon received Koch funding.
https://climateinvestigations.org/willie-soon-scandal-corporate-funding-year-by-year/
Then there are all the organizations that received Koch funds that work to oppose the “consensus.” Do I need to find them for you? Cato, Heartland off the top of my head.
I see you are not in regular contact with academics subject to funding then…
At my Alma mater, one research student jokes with me about how spectacularly successful his professor was at getting funding, by biasing the inquiry with a spurious climate change angle.
You can see this in many research papers. The actual results have almost nothing to do with climate change, but the summary – which is all the paymasters read – has a paragraph about ‘climate change’
e.g. from my direct personal knowledge: Using metal oxides as the source of oxygen for coal combustion. This is not a new technique, but its finer details have yet to be established. The goal is more efficient combustion and easier cleansing of sulphurous components of the exhaust. The excuse? The flue gasses are almost pure CO2 ‘making it much easier to perform carbon capture’!
Plausible deniability …
The bias engendered by organisations directly funded by big business is MUCH easier to spot. Big Pharma is one of the worst offenders. Much of their so called ‘white papers’ are in fact carefully constructed marketing propaganda.
If you are so naive that you believe that there is ANY science that is not paid for my someone with some kind of skin in the game, then I fear for you.
Its been a long while since science was the province of gentlemen of leisure and private means and of letters, and country parsons with time on their hands to record the temperature and the rainfall and count the butterflies.
My borother in law is/was a research paeleogeologist. His son remarked to me ‘I had no idea we were so poor. I earn more than he ever did’ . But he has over a lifetime dutifully worked to calibrate and extend the techniques for rock dating as well as map the various rocks that comprise the earths crust.
He is a man who gnows his gneiss from schist to be sure. But that is because no large sums of money are involved,. There is no pressure,
(P.S, He says that paelegoelogy absolutely refutes the idea that CO2 drives temperature, in the way and with the feedback claimed. “It would make the climate so unstable the past simply would not have happened’).
This Kristi, is what happens when you let government be the agency by which research largesse is dispensed. When socialism is allowed to tax the idle rich and give the money to Good Causes.
The Goodness of the cause is of course interpreted by current government ideology.
In the case of directly funded research by large companies, you have to look at where the payback comes, In the case of e.g. Big Oil, payback is mostly about how to find new resources. Not about trying to get people to use it., They already do that far more perhaps than is wise.
Exxon undoubtedly knew, because they would have paid scientists and engineers to tell them the truth, that:
(a) Climate change due to CO2 was a crock of manure
(b) ‘Renewable’ energy wouldn’t work to reduce emissions anyway.
So of course they did the sensible thing, carried on as usual but created ‘green’ divisions to look into ‘hydrogen power’ ‘fuel cells’ and ‘renewable energy’ and the like so long as the glare of publicity was on them before closing it all down when the budget (which was of course part of ‘marketing’, not ‘research’) was no longer justified by the public’s boredom with ‘alternative technology’ that didn’t actually in the end, work.
I am sure you are a well meaning Socialist with a deeply self indulgent Social Conscience and really Care About Stuff and all, but beware of what you wish for. Handing over responsibility and public money to a government to implement Social Justice is a really cr@p idea.
In his autobiography (Slide Rule) the writer Neville Shute (Norway) remarks that his dealings with men in the Air Ministry and indeed men high up in the Air Force itself, were hampered by the fact that too few of them had private means. The Air chief marshal who didn’t need the salary could express his opinion freely.
Likewise his company – Airspeed – was funded almost entirely by private individuals of means. It was far easier to have a four hour meeting with a man who could then write a cheque for millions, than to jump through the hoops of a government bureaucracy whose members never got sacked for saying no, but who could for saying ‘yes, inadvisedly.
It has been fashionable for nearly a century to espouse the Neo Marxist concept that private capital is an obscenity, and that the rich should be taxed until they are as poor as everyone else, and then the government itself can Do Good with the money.
However all that has in fact happened is the creation of a vast bureaucracy in which Doing Good ceases to be the aim – and the retention of a secure job within that bureaucracy is all the counts for the decision makers. And that retention is assured not by making daring and successful investments, but by sticking to the rules.
So everyone pays lip service to teh social ideology of the time – what we call virtue signalling – whilst working hard to feather their own nests . Bill Gates warbles on about Climate Change, whilst taking a private plane all the time. Elon Musk champions renewable car juice, whilst being prosecuted by the SEC…
And this is what happens when you allow a culture that considers it correct to punish people for success and reward failure, because its ‘socially just’ , and that considers that individuals in a bureaucracy constrained by the need to preserve their positions can make better decisions than a lone man with a $10bn bank account who has acquired it BECAUSE he made astute decisions..
Kristi: Your worldview seems to me to be, pardon me, either incredibly disingenuous or incredibly naive.
You appear to espouse the broad principles of modern politically correct socialism, but are in denial as to the actual effects that socialism has when applied to using government and bureaucracy to dictate the course of civilisation, rather than demonstrably competent individuals. Or the people themselves.
If you want unbiased science. give scientists a salary irrespective of what they do. Give them private means, like the parsons of old who merely had to preach to their flock once a week, and the rest of the time could ponder the mysteries of God, as revealed through Natural Philosophy, by setting up rain gauges and counting the worms in the back garden.
Leo,
“I am sure you are a well meaning Socialist with a deeply self indulgent Social Conscience and really Care About Stuff and all”
I’M NOT A FRIGGING SOCIALIST! Your foolish assumption just shows how eager you are to indulge your own fantasies. You don’t know me, you don’t know my motivations, you are totally clueless and arrogant thinking you can characterize me based on your asinine biases.
“Exxon undoubtedly knew, because they would have paid scientists and engineers to tell them the truth, that:
(a) Climate change due to CO2 was a crock of manure”
Once again, a stupid assumption! Their own scientists were telling them back in the ’70s that there was a lot of evidence for AGW.
I don’t deny that climate change gets lots of funding, or that some scientists capitalize on that. That doesn’t mean their research results are influenced by it, even if they do interpret them in the climate change context.
“If you want unbiased science. give scientists a salary irrespective of what they do.”
Are you under the misguided impression that scientists get money from their grants? Scientists are salaried. Only if they do research during the summer do they get paid out of grants, and there are restrictions on how much – less than or equal to their salaries.
I’m not going to bother with the rest of your rambling post.
Once again, a stupid assumption! Their own scientists were telling them back in the ’70s that there was a lot of evidence for AGW.
No doubt they did, because there was. No doubt they also told them that there was no cause for alarm, because there wasn’t.
The same holds true today. Of course there is evidence for AGW. But there is no case for alarm. Sensitivity is clearly less than natural variability, and the remedies proposed to mitigate AGW do moe harm than good.
As usual, when I asked you a direct question you simply didn’t answer. This one I will repeat again.
What science have the Koch brothers funded? Authors, papers, journals, institutions? If you’re going to throw around the accusation that they have funded biased science, by all means, show the data that backs up your assertion.
The anecdotal stories are, frankly, distracting. It is a big planet, weather is highly variable, in any given year I can find multiple unusual weather events. A series of anecdotal stories is not data, does not demonstrate a trend, and has no place in a science discussion. Similarly the lecture about Lysenkoism. Present your data, math, logic and conclusions, everything else is a distraction.
As to your graph, it lists instances of Niagra Falls freezing over that seem to correlate with low spots on the graph. But there are no historical instances of same for the Dalton Minimum. You could argue that historical records were pretty thin before that, but given that the falls were so well known in various historical references going back to the 1600’s or even earlier, one would think that them freezing over would deserve some kind of mention. The lack thereof makes me rather suspicious that you’ve got a correlation that doesn’t extend well back into time.
Not to mention that the last time according to your graph was 2014. At which time global temps on every temperature record we have are well above those of the early 1900’s:
http://www.woodfortrees.org/plot/hadcrut4gl
Which implies that the falls can freeze over in a year where the earth as a whole is warmer than average. So you can draw no conclusions about this anecdotal evidence and your graph and global temps in my mind.
There is a lot less water going over Niagara Falls in the modern era than there was prior to 1882 and later years with additional water diversions and turbine/generators both sides of the border. So to freeze over now with less than a 1/3 to 1/2 of the flow there was in the 17th to 18th centuries is comparing apples to oranges. The water is ramped up and down from day to night now, as well as in tourist season there is a higher flow rate in the day and off tourist season has more water being diverted through the hydro. We need to differentiate when we say Niagara Falls just freezes over, or we aren’t being honest either.
Weather records are not “anecdotal reports”
An anecdotal report looks something like this….
“Better advice I could not give, and I speak from personal experience.”
– davidmhoffer promoting corporate amphetamines:
https://wattsupwiththat.com/2011/11/08/shame-and-witches-nature-climate-change/#comment-700374
1. The examples in the article above are not weather records, they are selective stories that are weather related and no evidence is given that they are part of an overall pattern. Thus they are in fact anecdotal, not data.
2. Your link to my comment shows that I provided a rather detailed response on diagnosing and treating a very complicated condition. At the very end, I noted advice that I had been given regarding a non-medicinal and very personal approach to dealing with the condition which I had personally used and widely recommended. It was not an anecdotal story, it was an endorsement of a technique that was documented in widely read literature and widely used.
3. Your out of context, of topic attack on me personally is not unusual. You had to go back nearly seven years to find a quote to use against me. Are you stalking me? Does your hatred of my people go to such depths that you keep references on hand with which to attack me (even though as usual a proper reading of them shows that they don’t represent the claim you make) so that they’re easily available to you? Are you stalking me? Seriously? An out of context, completely irrelevant quote on a completely different subject from seven years ago?
That’s all you got? Pathetic.
I post under my own name coward. If you want to attack me in this fashion, grow a pair and post under your own name.
People may be interested in my 2012 blog post that is based on this graph:
http://astroclimateconnection.blogspot.com/2012/06/singular-spectral-analysis-of-summer.html
http://2.bp.blogspot.com/-RsGVz_DLr2w/T-nHkBIbjjI/AAAAAAAAAOw/E0jKXoKp88E/s400/Adelaide_Sp.JPG
Singular Spectral Analysis (SSA)
Preliminary Results:
If you use SSA to investigate the de-trended maximum temperature time series (see figure 2), you find that there are spectral peaks at all sub-multiples of the 22.3 year Hale (H) cycle from H/2 to H/10. The most prominent sub-harmonics are those at H/3, H/6, H/9. and H/10.
This result strongly suggests that the long-term median summer-time maximum temperatures in Adelaide are primarily being driven by factors that are associated with the 22.3 year Solar Hale Cycle.
The presence of sub-harmonics in the temperature record is indicative of the fact that the ~ 22-year forcing term must have a broadened temporal structure that is triangular like in appearance.
This result is broad general agreement with the results of Thresher (2002) who finds that the variability in the strengthof the zonal west winds along their northern margins of High pressure cells broadly correlate with the 22-year sunspot cycle. Hence, the most likely causation sequence is:
22 Hale cycle —> strength of zonal west winds —> the median summer maximum temperatures in Adelaide
Sorry, here is a bigger image
http://2.bp.blogspot.com/-RsGVz_DLr2w/T-nHkBIbjjI/AAAAAAAAAOw/E0jKXoKp88E/s1600/Adelaide_Sp.JPG
INTERNATIONAL JOURNAL OF CLIMATOLOGY
Int. J. Climatol. 22: 901–915 (2002)
Royal Meteorological Society.
http://onlinelibrary.wiley.com/doi/10.1002/joc.768/pdf
SOLAR CORRELATES OF SOUTHERN HEMISPHERE
MID-LATITUDE CLIMATE VARIABILITY
RONALD E. THRESHER
ABSTRACT
Atmospheric circulation in the southern mid-latitudes is
dominated by strong circum-Antarctic zonal west winds
(ZWW) over the latitude range of 35 to 60 °S. These
winds exhibit coherent seasonal and interannual variability,
which has been related both to Antarctic (e.g. polar ice)
and low-latitude climate (e.g. El Ni˜no–southern oscillation)
parameters. Historical and recent studies suggest that,
at its northern margins, variability in the ZWW also has
a marked quasi-decadal component. Analysis of sea-level
pressure and rainfall data for the Australian region, South
Africa and South America confirms frequent indications
of quasi-decadal variability in parameters associated with
the ZWW, which appears to be in phase around the
hemisphere. This variation broadly correlates with the
sunspot cycle, and specifically appears to reflect
sunspot-correlated, seasonally modulated shifts in the
latitude range each year of the sub-tropical ridge over
eastern Australia. Sunspot-correlated variability in the
southern mid-latitudes is likely to have substantial effects
on temperate climate and ecology and is consistent with
recent models of solar effects on upper atmospheric climate,
though the mechanisms that link these to winds and rainfall
at sea level remain obscure.
Scientists, pseudo scientists, and dogmatists can pontificate, lie, and argue. But anybody can read their thermometer. Anybody can feel cold in the homes and neighborhoods. You can tell them they’re warm but they know when they’re cold.
The polar jet stream and subtropical jet are in the tropopause (7 to 12 km altitude). The atmospheric contraction is in the thermosphere (80 to 1000 km altitude). The jet stream in thermosphere has no effect on weather.
“When solar cycles are shorter than 11 years over several cycles the planet warms; when cycles are longer than 11 year for a few cycles, the planet cools.”
That is a fallacy, there were a couple of very short sunspot cycles in the Maunder Minimum, all because the Venus-Earth-Jupiter synods return faster to Neptune than to Uranus.
The Zarkhova model is hopeless at hindcasting previous solar minima, it has no value.
The essay is a little disjointed and selective in its evidence, rather than thorough. You end up with a hypothesis and a prediction. So we’ll see how it turns out.
Your selectivity is my critical wading through the swamp of climate science. I’ve been on this since 1990.
The head post says:
I gotta say, you cannot get much further from science than those claims. They are ANECDOTES about rainfall, and the plural of “anecdote” is not “data”. Those claims are as meaningless as the “Niagara Freezes” nonsense in Figure 3 that I discussed above.
You cannot show that something is related to the sunspot cycles by a few carefully selected anecdotes. You need to do an actual analysis of some kind.
So I went and got the longest rainfall dataset that I could find. This turned out to be the record since 1852 of the rainfall of Durham, England. I did a CEEMD analysis of the data to determine the underlying frequencies. If the rainfall were related to the solar cycles, we would expect to see a strong cycle in the data centered somewhere around 11 years. Here is the result of that analysis:
As you can see, there is absolutely NO strong cycle anywhere near 11 years. So we can conclude that there is no visible or significant solar-related affect on the data.
Anthony said at the end of the head post:
I would say:
Best to all,
w.
I’ve simply collected some of the recent history of the natural world and documented it. The Great Lakes region is a natural cloud chamber. Lake Ontario was at a 22 year high when I wrote the essay. It was simply the additive effect of a snowy winter and a rainy spring. 22 years is the full sunspot cycle of the reversal of magnetic polarity. The other Ontario and Canadian Floods are coincidental documented history. There are many other examples but none more dramatic than those I’ve collected for the essay. I challenge you to repeat the exercise. and find larger Johnstown floods during sunspot peaks.
No one says the cloud cover changes by very much. I’ve seen estimates of 4% cloud fluctuation so there is no wonder we do not notice it or find it impossible to measure. What we do notice is the broken water sprinkler of standing Rossby waves. What I find astonishing is the obsession with solar peaks and sunspot numbers in solar science and the nearly absolute lack of interest in solar minima when the shields are down.
Our planet has had a few billion years to sort out its goldilocks space. Earth’s a pretty stable platform but as our lifespan lengthens and we see changes we should say so. All the measurements are regionalized variables and we need to start with a fresh hypothesis. Moreover, it was only an essay.
Willis Eschenbach,
You are to be commended for countering Dr. Francis Mann’s assertions with real-life observational evidence. Clearly, there does not seem to be an 11-year periodicity in the Durham U.K. rainfall data between 1852 and 2004. However, I believe that you have picked up an approximate 13/26, 15.5/31, 18 and 22-year cycles in the C4 and C5 components in your periodogram. What you have elucidated is the complex nature of the real world climate. In other words, it is most likely a complex mix of both solar and lunar influences that is masked by the fact that many natural cycles often appear in the spectra of climate time series at multiples (or sub-multiples) of the fundamental period.
The first three periods that you have detected at 13/26, 15.5/31 and 18-years could (an I emphasis the could here) associated with the 18 and 15.5/31-year cycles of the Perigean Full/New Moon tidal cycle. In this case, the 13/26-year cycles would be a pseudo-period created by the other two cycles i.e. 31 – 18 years = 13 years.
This leaves the (approximate) 22 year cycle that is clearly seen in your data. I am of the belief that you are convinced that the 22-year solar magnetic cycle can have little or no influence upon the Earth’s climate [please correct me if I am wrong], however, in complex systems like that associated with the climate, I believe that it is possible for most of the spectral power of the 11-year cycle to be transposed into its sub-harmonic (at 22 years).
I have presented a paper by Ronald Thresher of the Australian CSIRO above:
INTERNATIONAL JOURNAL OF CLIMATOLOGY
Int. J. Climatol. 22: 901–915 (2002)
Royal Meteorological Society.
http://onlinelibrary.wiley.com/doi/10.1002/joc.768/pdf
SOLAR CORRELATES OF SOUTHERN HEMISPHERE
MID-LATITUDE CLIMATE VARIABILITY
RONALD E. THRESHER
that clearly shows a 22-year cycle in the northern reaches of the zonal winds in high temperate latitudes of the Southern Hemisphere. I have also shown that the super-harmonics (2 through to 10) of the 22-year solar cycle are clearly evident in the median maximum temperatures for Adelaide (South Australia) between 1888 and 2010. You have to comment on this observational evidence that, in part, supports Dr. Mann’s assertions.
I believe that rather than looking for a pure signal at the 11-year period of the solar sunspot cycle, you should open your self to the idea that it may be present in the observational climate data at sub- and super-multiples of the fundamental 11-year period. In addition, I respectfully request that you consider the possibility that it could be (masked?) mixed with a long-term lunar tidal signal that most likely matches the 31/62 year Perigean New/Full Moon tidal cycle.
I believe that you are a brilliant man who has the ability to follow the evidence wherever it leads, despite your biases (of which we are all afflicted, one way or another).
Excellent article, thank you!