Guest essay by Leland Park
Given the impending global warming crisis declared by scientists, it should be easy to unambiguously demonstrate the crisis from the instrumental record. Unfortunately, when looking at the high temperature record for the US, it does not show any warming.
Figure 1 illustrates the incremental changes in surface air temperatures based on year to year differences in station average Tmax. The data is from all active stations in the US Historical Climatology Network (USHCN) from 1895 to 2014.
The classic heat equation defines changes in heat content as being proportional to changes in temperature (ΔQ = ƒ{ΔT} ).
Thus, Figure 1 amounts to a depiction of incremental changes in heat content, without scaling in energy units. The overall net temperature change is 0, which means the net change in heat content is also zero (ΔQ = ƒ{ΔT} = ƒ{0} = 0).

Figure 1 Year to Year Heat Changes (ΔT) for the USHCN
Despite substantial differences in prevailing temperatures across the network, the differencing method (use of ΔT) effectively normalizes them to variations about its trend. According to the USHCN Tmax records, that trend amounts to a norm of 0 deg F change, for all stations in the network.
According to the instrumental history, the average year to year differences in station Tmax values is relatively small, amounting to about +/- 2 deg F. This long-term pattern means;
A. There is no persistent warming or cooling trend across the US,
B. Heat changes are small across the entire network,
C. Climate behavior is resilient in maintaining norms – despite perturbations,
D. There is no net long-term change in the energy balance.
Interpretation notes;
1) Variations in values are the result of climate thermodynamics – not “noise”,
2) Heat changes are the result of all contributory sources, and 3) conclusions are for the US only – though thermodynamics would seem to rule out a global warming that left out the continental US.
The observational data shows no signs of an impending global warming crisis – not even in the “adjusted” versions. Conclusion are the same, whether all stations or any subset are aggregated for the analysis.
There are further clues to climate temperature stability awaiting discovery in the unadjusted USHCN data – for astute researchers willing to explore it. These discoveries include insights into climate thermodynamics as well as clues as to why the climate is resilient to change. Interested researchers should not delay, as maintenance of the datasets was abandoned after 2014, with no guarantee of future preservation.
If you control for the Urban Heat Island Effect and Water Vapor there is no warming. There is no evidence CO2 is causing warming if the measurements are done correctly.
Isolating the Impact of CO2 on Atmospheric Temperatures; Conclusion is CO2 has No Measurable Impact
https://co2islife.wordpress.com/2018/08/01/isolating-the-impact-of-co2-on-atmospheric-temperatures-conclusion-is-co2-has-no-measurable-impact/
“>>> CO2 has No Measurable Impact <<<"
Indeed. This is in full agreement with [1] that finds human contribution to the alleged warming to be a puny 0.02 degree Celsius. It's too little to be measurable against natural variability.
[1] https://doi.org/10.1088/1361-6463/aabac6
Somebody help me out here, please.
I just encountered someone who insists that the hurricane count is UP (not to my knowledge, and I track those numbers) because the ocean/sea surface temperature is 50 degrees warmer than normal. He is very insistent about it.
Where would this come from, and what sources can I use to rebut what he has said? I want to keep it as simple as possible, because this guy is a pseudo-intellectual snob who is so sure that he’s right about everything, he even thinks the price of gas at the pump is over $4.00/gallon and I have yet to see it go near that this year, or any time in the last 4 years. (Maybe Ultra, but not regular.) I told him that raw data temperature charts have been altered, and he dismissed it as gossip.
Thanks in advance!
Sara, if he truly insists that the ocean/sea surface temperature is 50 degrees warmer than normal then you are dealing with someone who is insane, and there is no point pursuing the argument with him any further.
Possibly ment to say 5 degrees ( even in F that sounds too high) while 0 could have been misinterpreted the superscript 0 which is normally associated with degree. Google Dr Judith Curry who is an expert on the matters.
He posted it as 50 with what appears to be a degree symbol following.
What he doesn’t realize is that even at the surface, a rise in temperature that much would result in massive fish kills, among other things.
Thanks for the advice. I think I will just let it go, but I will also do a search for Dr. Curry.
See Bookmarks on right side of page …below Recent Comments .
Good luck !
Hurricane count is DOWN. Hope this helps.
I heard today on tv that the average strength of hurricanes hitting the U.S. is down significantly over the past few decades. I didn’t catch the exact numbers.
That’s the point. I know the number per season is down. You know it’s down. This Person insists that the count is up.
In the Pacific, maybe, but not really any higher than the average count, and certainly not in the Atlantic.
Some of this may be relevant: https://www.theguardian.com/weather/ng-interactive/2018/sep/11/atlantic-hurricanes-are-storms-getting-worse
Sara, re gasoline prices — try http://www.gasbuddy.com. I haven’t actually used the site for a good many years, but it’s still there and a quick look seems OK. It has several sets of tools that should be useful. It looks like the current average gas price in the US is around $2.86.
Thanks, and I’ve used Gas Buddy myself, but I think this guy I’m talking about is in his own little cloistered world of denial.
Sea surface temperature records are a hopeless mess in the 19th and 20th centuries. British Navy started taking daily records in 1851, each ship had a sailor who would throw a bucket on a rope over the side, haul it up, and stick a thermometer in. Claiming accuracy even within two or three degrees from this method is ludicrous. So, we simply do not know how warm the water used to be.
Starting around WWII engine cooling water temps were recorded on thousands of ships. The intake could be anywhere from one meter depth to over 10 meter depths. Take a dip in the ocean, notice how the water gets colder the deeper you go…
There are none so blind as those who won’t look. Been down that rabbit hole, it is of little benefit to argue with those of such misplaced zealous conviction, it will just annoy you and you’ll gain very little satisfaction when you can finally say ‘I told you so’. Save your energy for those who are sufficiently open minded and able to debate.
If your US landall hurricane count started in 2006, you could easily argue it is up, very substantially. But the open minded will see straight through such crass subterfuge
If I recall the conclusions various writers have made, the “warming” is due to an increase in the low temperatures, which is consistent with the Urban Heat Island effect.
but the adjustments make it cooler….. LOL
caveat: When UHI adds 10 degrees….and you adjust down 1 degree….you can claim that
Tom,
That’s consistent with my understanding. The reported data also indicates that the bulk of the warming occurs in the Arctic region where there is little data.
Has the Arctic sea ice reached bottom per this plot which is different than others?
Sorry omitted from earlier post
T-max is not the same as increased average temperature. In principle, both night average temperature and daily average temperature could have risen with no increase in T-max.
Nighttime warming is beneficial. It prevents plants from freezing during colder weather, increasing crop yields. So T-max makes sense to use.
Using averages confuses the issue. What actually happened? What happened if it changes? Can’t tell because an average is reported.
Highly sampled temperature data is desired. Reporting the average is a method of purposely clouding the issue. Averages should only be used in analysis, not as raw data. This is a major problem in climate science. Raw data should be reported periodically or, even better, whenever the data changes. This is well understood in embedded computing systems and should be applied to climate science but would probably reveal problems with the alarmist position so I don’t expect it to happen. Obfuscation is the mantra.
yes but if there really was global warming by CO2 the max temp would be higher as CO2 is always present both day and night. The simplest proof that CO2 does very little is that in a desert at night it is cold without clouds and warm with clouds. Clouds are water vapour NOT CO2.
Try applying meteorology to your reactive inference that deserts are cold so CO2 is not in play there as a GHG.
Deserts are dry. They have descending air and clear skies with minimal WV. They produce a subsidence invertion that inhibits convection (a cap). This allows v high temps beneath without that air being able to rise. Conversely at night the bottom few hundred feet of the atmos cools easily due that clear/dry air, calm winds, and also sandy soils that insulate from the ground heat-flux. The overall cooling is confined to a small volume of air, unlike tropical zones that have a neutral/conditional LR.
The greatest effect of AGW comes from rising nightime minima, as that narrow zone of air under a nocturnal inversion maximises the trend, whereas daytime maxima have their surface reflection carried (and spread out) through a large depth of atmos (due convetion).
Vis this is the US minima trend …
If you look, Tmin is following dew point, the amount of warm humid air blowing over the low/mid latitudes in the Northern Hemisphere increased in 2000 (PDO, then AMO), Tmin just follows. Deserts in the SW US have a daily range of ~22F, Global avg is 18F, tropics is 14F.
The rh response to cooling causes atm temps to slow or stop falling. I think it’s the amount of wv in the atm condensing/reevaporating increases, and the latent heat released as IR counters cooling.
This cancels any increase in Co2 forcing, as it will just produce slightly less latent heat because it is temperature controlled, and doesn’t slow cooling until after it’s cooled to dew point.
That’s a regulator.
donb,
Your statement is true. However, if there is no increase in T-max, then there is little reason to be concerned about excess deaths or the myriad other extreme scenarios resulting from organisms being exposed to temperatures they are not adapted to. That is to say, if the average daily August temperature in Hawaii changes from 82° F to 83° F, with no increase in T-max, people aren’t going to start dying from hyperthermia. Indeed, any place people have adapted to physiologically and culturally, a small increase in the average temperature, with no increase in T-max, will not be stressful.
The article argues that the overall heat energy change can be inferred from delta Tmax, which exposes a basic misunderstanding of physics. Your “death from hyperthermia” argument is a straw-man that is irrelevent to the discussion of whether or not warming is occurring.
megathor,
It is not a strawman argument. The concern about warming is not academic — the concern is about the claimed effects resulting from “warming.” Just 13 hours ago, Anthony summarized an article claiming excess deaths will result from warming:
https://wattsupwiththat.com/2018/09/13/another-modeling-claim-heat-related-deaths-likely-to-increase-significantly-as-global-temperatures-rise/
And, humans don’t die from “heat energy.” They die from an inability to moderate their internal temperatures by sweating. The best measure of coping ability is the Heat Index, which takes into account temperature and humidity. If the average temperature increases (either from increases in T-min OR T-max), the energy content of the air will increase. However, if the maximum temperatures do not increase, there is not going to be sufficient stress on individuals to put them at risk of dying.
Keep in mind that the discussion isn’t really about whether warming is occurring, but rather about whether the alarming scenarios have validity.
That’s not what I take from it at all. The Change in Energy he is talking about is the maximum energy in the system at Tmax. If CO2 were the big boogaboo that they say it is, pushing us towards a boiling point, we should be seeing an increase in energy at Tmax. We aren’t, at least according to his article. The energy at Tmin is a measure of energy at the bottom of the sine wave, thus is irrelevant with regards to the maximum energy change in the system.
As it stands, we are not seeing an “increase” in temperature, we are just seeing an increase in the low temperature … which is not relevant to anything but permafrost and other frozen media. Hence .. you may see the ice line move, but you won’t see a slew of record high temps at low and mid latitudes due to increasing CO2.
…. and given that the earths feedbacks work like all others, working to return the system where it was before the change ….. we aren’t very likely to see Mnt Everest covered in water any time soon. The whole system will reverse on its own as it always has.
donb
in principle if it doesn’t than what’s the big f deal?
Interesting. Your analysis of the Climate Reference Network results (presumably un-fudged) would also be interesting.
The results of this article are the whole reason that the USHCN was abandoned by the government authorities after 2014. When it refused to show warming, they switched to other data sets including combining SST with land temps!!!!!!!!!!!!!!!!!!!!!!!!!!!!!
There has never been AGW all the warming was due to natural climatic factors being in an extreme warm mode up to year 2005. The transition of natural climatic factors to a colder mode started in year 2006 and is now just completed.
Let’s see how much AGW comes about moving forward from here.
This year is the transitional year to a definite cooling trend and the evidence is all over the place.
You’ve been saying the same thing since 2010. You were wrong then, and you are wrong now.
Yabut, (insert appropriate Warmunist arm-waving here).
Global warming seems to be mostly increased Tmin during the winter.
And at night a few degrees, especially in the land based northern hemisphere.
That graph !looks a !ot like a classic “beat”pattern of interacting frequencies. And coupled oscillations.
Yep. I’m away from my usual computer so I can’t easily find the link. Climate waveforms look a lot like the waveforms that result when you excite a sphere. It’s not surprising but you get a lot of quasi and pseudo cycles. When you try Fourier analysis, the result is usually disappointing. Even so, it’s hard to ignore the similarities.
It should be obvious… But when you have a data set for a country as big as the USA that shows no increase in warming for over 100 years… That Globally there can be no Warming either, as it would affect the USA temperatures.
What have you got for rainfall trends if any for that period?
Not many details given. But it looks like one of those primitive analyses that just take monthly averages of absolute temperature of whatever stations report in that month and compare them. No area weighting either. Two big problems:
1. You aren’t measuring heat content of the space without area weighting. For example, the western half of the country has about half the stations of the eastern. So the numerical average result reflects that and other biases. But worse
2. Each month, you are comparing two different groups of stations, and the difference in averages reflects mainly whether the stations in one month are a warmer group of places, rather than whether the weather was warmer. Over the years many USHCN stations, which are mostly run by volunteers, stopped reporting, which is why a new process was introduced in 2014. And it is just a fact that more warm than cold places dropped out.
>>
And it is just a fact that more warm than cold places dropped out.
<<
So which stations are selected affect the results? Amazing how that works, isn’t it?
Jim
“Amazing how that works”
No, it’s very simple. First, no-one “selects” the stations that will report, except the volunteers. But secondly there is a well-known, universally applied remedy, which is the use of anomalies.
>>
. . . the use of anomalies.
<<
Yeah, well if it wasn’t for anomalies, you’d have nothing to believe. Anomalies are temperatures, and by standard thermodynamics cannot be averaged. Temperatures are intensive properties. Averaging intensive properties is an oxymoron. There is no physical process that allows you to average temperatures.
Mathematically you can average any set of numbers. What you get when you do is a mathematical average. There’s no physical meaning in that average.
Of course you might gain some traction by using kinetic theory. Kinetic theory doesn’t require equilibrium for temperature as does thermodynamics (but at equilibrium kinetic temperature must equal thermodynamic temperature). Unfortunately, all of the temperatures regarding weather and climate are using the thermodynamic definition for temperature.
Jim
Jim
” Averaging intensive properties is an oxymoron.”
On the contrary, most intensive properties are expressed in ways that require integration (averaging) to make physical sense. kg per cu m, lb per sq inch (psi), etc. Temperature, too, is basically J/kg for a material of uniform specific heat capacity. And to get the heat content, you integrate ρcₚT over volume. A proper weighted average.
Well great, and you have an accurate map of surface heat capacities to then add yet another layer of adjustments into the equation?
Why don’t you convert the temp into the radiated flux, which can be averaged, average those, and then convert that back to a temp?
>>
. . . that require integration (averaging) to make physical sense.
<<
I have to admit, Nick, you are committed to your viewpoint. This old engineer has done many integrals in his lifetime. I know they are the inverse of the derivative. If you want to check that an integral is correct, you take the derivative to see if you get your original function. It’s also a summing process. That’s why they use the old English ess as the symbol. However, I’ve never done an integral that gives you the average directly. (Maybe you know some esoteric function that when integrated does exactly that.) Things like centriods and center-of-mass require something like an average, but you must do the division/averaging as a separate step.
In thermodynamics, temperature is always measured at points of equilibrium. I’ve never seen a problem in thermodynamics where the temperature is averaged (but that doesn’t mean they might not exist).
But I’m game. Show me how you use specific heat capacity to compute anomalies and temperature averages.
Jim
“And it is just a fact that more warm than cold places dropped out.”
Wrong, as usual. Just the opposite in fact.
Not true. But either way, you get a spurious trend. It’s just a nonsense method.
Nick
is the fact that there were more days over 100 degrees in the 30’s then there are now meaningful in any way or is that just more nonsense? Either something is wrong with the temperature trends that we use today or the actual temperature records from the 30’s are wrong. You defend the approach used today but time and time again it doesn’t match with real evidence from the past.
Bob, the question is why, in the face of all that information does Nick continue to hold that opinion?
The other thing I’m interested is to see what Nick actually intends for mitigation strategies.
Nick, what is your stance on man made global climate change? Would you be specific?
Also, what actions would you like to see manifest to attempt to mitigate it, if possible?
I think knowing your response to these may not have me be so combative, depending on your response of course.
He’s paid to hold that opinion.
Honest, I believe Nick’s problem is that anytime the data hasn’t been run through an “approved and certified” computer model he rejects it. He refuses to even accept the data but instead believes only the computer model outputs and interpretations.
We had this problem with a federal agency and their computer models. Even though we had the best data set, which they admitted and the data clearly demonstrated their models were wrong, when asked in testimony which they would use for final decision making, they stated “the model.”
Nick is a former government wonk (CSIRO)…so that’s why he’s so biased towards those.
That’s an interesting revelation, some how it does not surprise.
“is the fact that there were more days over 100 degrees in the 30’s then there are now meaningful in any way or is that just more nonsense?”
I’d say it could have some meaning, but isn’t a particularly useful measure of global warming.
First, it limits you to looking at maximum summer temperatures, it tells you nothing about what is happening at night or during other seasons.
Secondly, it emphasizes parts of the country more than others. I expect some places in the USA never reach 100°F.
Third, it puts a lot more emphasis on the exact reading of a thermometer. A small adjustment that would have little effect on the average temperature could have a big impact on whether a day reaches the magic number or not. (I do wonder how tempted someone might be to “misread” a scale slightly if it means a 99.9°F reading becomes 100°C).
Fourth , if the days aren’t hotter who cares?
Nick All of this doesnt matter. Global warming is simply that; global warming. If there is even 1 station not showing warming , then there is no global warming. Weather is as we know a local phenomena. CO2 is well mixed therefore CAGW would affect everywhere on the planet. If you are going to argue that local conditions predominate over CO2 then you are right. The poles are colder duhhhhhhhh. However CO2 would affect even them because CO2 is well mixed. If you have even 1 place on earth that doesnt show any warming for a 100 years then there cant be global warming. How can you have CAGW in the rest of the planet and have protected areas that are safe from global warming? And dont give me the BS of rising seas. The poles arent melting.
http://polarportal.dk/fileadmin/polarportal/sea/CICE_combine_thick_SM_EN_20180912.png
I am an exasperated skeptic because arguing against a religion is almost impossible.
it ain’t easy to break the spell either. it took me my full 20’s of questioning the dogma to finally sleep easy not believing in a virgin birth.
damn it was a scary ten years and I feel for the women in my life then, because I was intolerable as I attempted to break free from that bondage.
But if someone is in their 60’s and unwilling to challenge their faith, or recognize it as such…I have difficulty respecting such folk. My own mother disappoints me with her fervent Catholicism
So if the year to year change in temperature, delta T, was 0.01, and stayed 0.01 for 100 years, the red line would look like zero because 0.01 is so close to zero and it stays flat. But 0.01 times 100 years produces 1 degree of warming. Correct?
“Correct?”
Undoubtedly.
According to St Gavin +/- 0.5C
I’m something of a Nube here, and sorry for being a bit thick, but is delta T a vector?
[Usually, Delta T is a “change in Temperature”.
Unlike a physical force “vector” (force at a direction), a temperature “change” can only “go” up or down.
Note that, in matrix algebra multiplication/division, “vector operations” have a different construct. /mod]
Nick you are off the mark once again. Heat content requires moisture plus temperature. And gridding is a poor way to sample temperature because it removes the assumption of randomness on which all statistics relies.
The method used in this article preserves randomness and as a result I expect the results will conform to the central limit theorem.
“Nick you are off the mark once again. Heat content requires moisture plus temperature”
It was the author, Leland Park, who claimed to be calculating heat content. I simply noted that you can’t claim that from an average of arbitrarily distributed points. You have to take account of location – ie area weighting. That is necessary but not sufficient.
Gridding is not a way to sample temperature. It was a (not very good IMO)way to integrate (area-weight) the results.
“I expect the results will conform to the central limit theorem”
How would that help, if true?
I really can’t believe you think one can average an intensive property like temperature. An extensive property like heat content (enthalpy) CAN be averaged.
If I have two pieces of iron on my desk, one of which has a mass of 1Kg and is at 293 K, and one of mass 0.1g at 1000K, what is the average temperature? The question is completely meaningless. However, the average enthalpy of the two pieces does have meaning, and is simply the weighted mean.
Richard Feynman discussed this error in his book “Surely You’re Joking, Mr Feynman”.
“However, the average enthalpy of the two pieces does have meaning, and is simply the weighted mean.”
No, that is what makes no sense. How would you weight the mean? In fact what I think you mean is the mass-weighted temperature
T_avg=(1*293+0.1*1000)/(1+0.1)
That makes sense, because if you multiply T_avg by 1.1, you get the total enthalpy. This is exactly how the intensive T should be averaged, with a useful result.
You don’t average extensive properties. You sum them.
>>
You don’t average extensive properties.
<<
In kinetic theory of gases, when they say that temperature is proportional to the average kinetic energy (and energy is an extensive property), they don’t know what they are talking about?
I think you’re getting intensive and extensive properties backwards.
Jim
“when they say that temperature is proportional to the average kinetic energy”
They say the temperature is proportional to the average kinetic energy per molecule. Continuum theory is not really working here, but that is an intensive property, provided you have local thermodynamic equilibrium so you can relate it to a continuum.
>>
They say the temperature is proportional to the average kinetic energy per molecule.
<<
Your magical tricks are very good–you’re trying to distract us from what is going on. First you have an extensive property: kinetic energy. Then you sum it for all the molecules in the gas. Then you average it over all the molecules. At that point, it becomes an intensive property–after you average an extensive property. That’s good, because intensive property “average kinetic energy per molecule” now relates to another intensive property: temperature.
Jim
But people FEEL hotter.
That counts for science these days.
True, people do feel hotter!
Even I feel the difference, but of course that has more to do with my access to AC then to any climate change. i actually think this is a real issue, lots of people say “i don’t remember it being this hot when I was a kid” but when most of us were kids we didn’t have AC units at all and we got used to the heat so it didn’t bother us nearly as much as it does now, just another example of how weak and stupid we are becoming as a nation.
Leland Park writes: “Figure 1 illustrates the incremental changes in surface air temperatures based on year to year differences in station average Tmax. The data is from all active stations in the US Historical Climatology Network (USHCN) from 1895 to 2014.”
Unfortunately, the number and location of USHCN stations has changed over the past 120 years.
Furthermore, you’ve plotted the year-to-year changes – the noise in the data. If the average rate of warming were 0.02 degF for these 120 years, the total change would be 2.4 degF (1.3 degC). An average year to year change of 0.02 degF is indistinguishable from zero on this graph.
To put it politely, you lack the experience to write about this subject or are deliberately trying to mislead people.
Agree with Frank. Would also like to add that if you are attempting to provide data analytics on a publicly available data set please publish your methodology so that others might reproduce the results. Otherwise what you are presenting is not to be taken with any degree of seriousness. If you are serious about data analytics a running avg is not the way to go… If you are serious please read the following study on the homogenization of the NOAA data using a reference network and again publish your methodology so that other can recreate (although it really looks like an average.)
Two studies to help you understand the data that you are using
http://www-users.york.ac.uk/~kdc3/papers/crn2016/background.html
Methodology used and code – http://www-users.york.ac.uk/~kdc3/papers/crn2016/
– and –
https://agupubs.onlinelibrary.wiley.com/doi/full/10.1002/2015GL067640
Or you could just ignore actual science…
“An average year to year change of 0.02 degF is indistinguishable from zero on this graph.”
He never mentioned any difference of 0.02 F. That is a figure you dreamed up. If he had taken only those stations that had continuous reporting over those 100 years, the results would have been the same. In any case if even 1 station shows no warming; that is proof that CAGW is impossible. CO2 is well mixed; therefore any new increased back radiation would increase the temperature in any locality.
An exasperated skeptic who finds arguing against a religion almost impossible.
Alan Tomalty
“If he had taken only those stations that had continuous reporting over those 100 years, the results would have been the same.”
Could you show that?
When I average raw USHCN station data for those continuously active since 1895, (there are only 29), I get a definite warming trend.
Not proof, just evidence. You would have to verify that all other possible contributors were accounted for, and in the real world that is extremely difficult. See data from 100 stations (or more) is far better evidence, but again, not proof.
Leland,
Frank has a point about the graph and the vertical scale. What is the actual trend of that line?
You people forget that global warming or climate change or whatever they end up calling it is not about climate or weather or science, it’s about money, power and politjcs. If we could successfully get rid of AGW news and disinformation the left will come up with another gambit to pursue, like their other favorite, it’s the rich people (undefined) who are the problem. Take more of their money to solve the problem. I have argued with lefties and it is a waste of breath and time.
Whenever a leftie complains about a CEO making 1000’s of times what the cleaner makes, I point out : Okay let us go back to the year 1400 when there wasnt any capitalism and no CEOs. Even the lowly cleaner lives a much higher standard of living now than the richest man in 1400. The richest man in 1400 couldnt travel very fast or very far and died of diseases that modern medicine cures even for the lowest cleaner. No televisuion, no internet no radio, no movies. no recorded music. All the advances of modern civilization were because of capitalism. IT SURE WASNT BECAUSE OF COMMUNISM. The differences in income dont matter. It is your individual well being that matters. If you want to go back to the year 1400 by banning the 85% of the world’s energy of fossil fuels, then you are a fool.
Needs a correction:
“
UnfFortunately, when looking at the high temperature record for the US, it does not show any warming.”All this talk of data and temperature records. What nonsense. It’s obvious that the globe is warming due to anthropogenic CO2 and that the effects will be catastrophic and if you don’t believe that, well, well you are a denier and a terrible person and our children’s children will die a horrible death because of you. So don’t come here with your “evidence”, I won’t be changing my mind until hell freezes over.
Well, the US is not the world, Tmax is just one set of figures, this year is 2018, not ’14.
Francois, Yet the overwhelming majority of the terrestrial temperature data, especially since 1850, comes from the USA, primarily the eastern half, and Western Europe. There is very little historical data for most of South America, Africa, and places like Siberia. To be clear I am not talking about proxy data.
Yes, the unmodified data from around the world is a bit few and far between, but most of this unmodified data from around the world agrees with the U.S. temperature chart, i.e. the 1930’s was as warm or warmer than subsequent years.
Here’s Hansen 1999:
Unmodified temperature charts from around the world resemble this U.S. temperature chart.
Here’s an unmodified chart from Finland, halfway around the world from the U.S.
And there are charts from the Southern Hemisphere that look just like these two.
Over this long a period of time (since 1850), it is not possible for the rest of the world to be warming up and not the US. Normally average daily temperatures are reported, however living systems don’t care much about average temperatures. It’s the mins and the maxes that can cause problems. So looking at just Tmax is actually the correct way to determine if there really is a threat from rising temperatures. If the max is not going up, then we are safe from being “fried”. Rising mins are not a threat, and are probably a benefit. And 4 additional years is not likely to make much, if any, difference over the time period we are talking about.
sure it is if you screw with the charts enough
Any farmer is a lot more concerned with Tmin than Tmax. A degree or two at the top usually won’t make any difference at all, but if it’s two degrees colder it can cause crop failures.
I thought the only data that everyone trusted was UAH.
That shows warming over the USA at a rate of 1.8°C / century since 1979.
Going from the coldest period since the LIA to the peak of a really big El Nino.
Going from the start of satellite data.
I’m not sure how much of an effect El Niños / La Niñas have on US temperature, but even ignoring the last few very hot years and ending at 2014, with two unusually cool years the trend is still 1.3°C / century, pretty similar to global trends.
1979 was the coldest period for the entire world, that it’s warmed up since then is not surprising, nor is it the result of more CO2.
Without the El Nino, the warming trend drops tremendously.
Tremendous arm-waving.
“1979 was the coldest period for the entire world”
Based on what evidence? I assume you won’t allow surface data, and satellite data only goes back to 1979. Also what do you mean by 1979 as a period? Do you mean that specific year, or the years following it, or what?
“Without the El Nino, the warming trend drops tremendously.”
No, sorry.
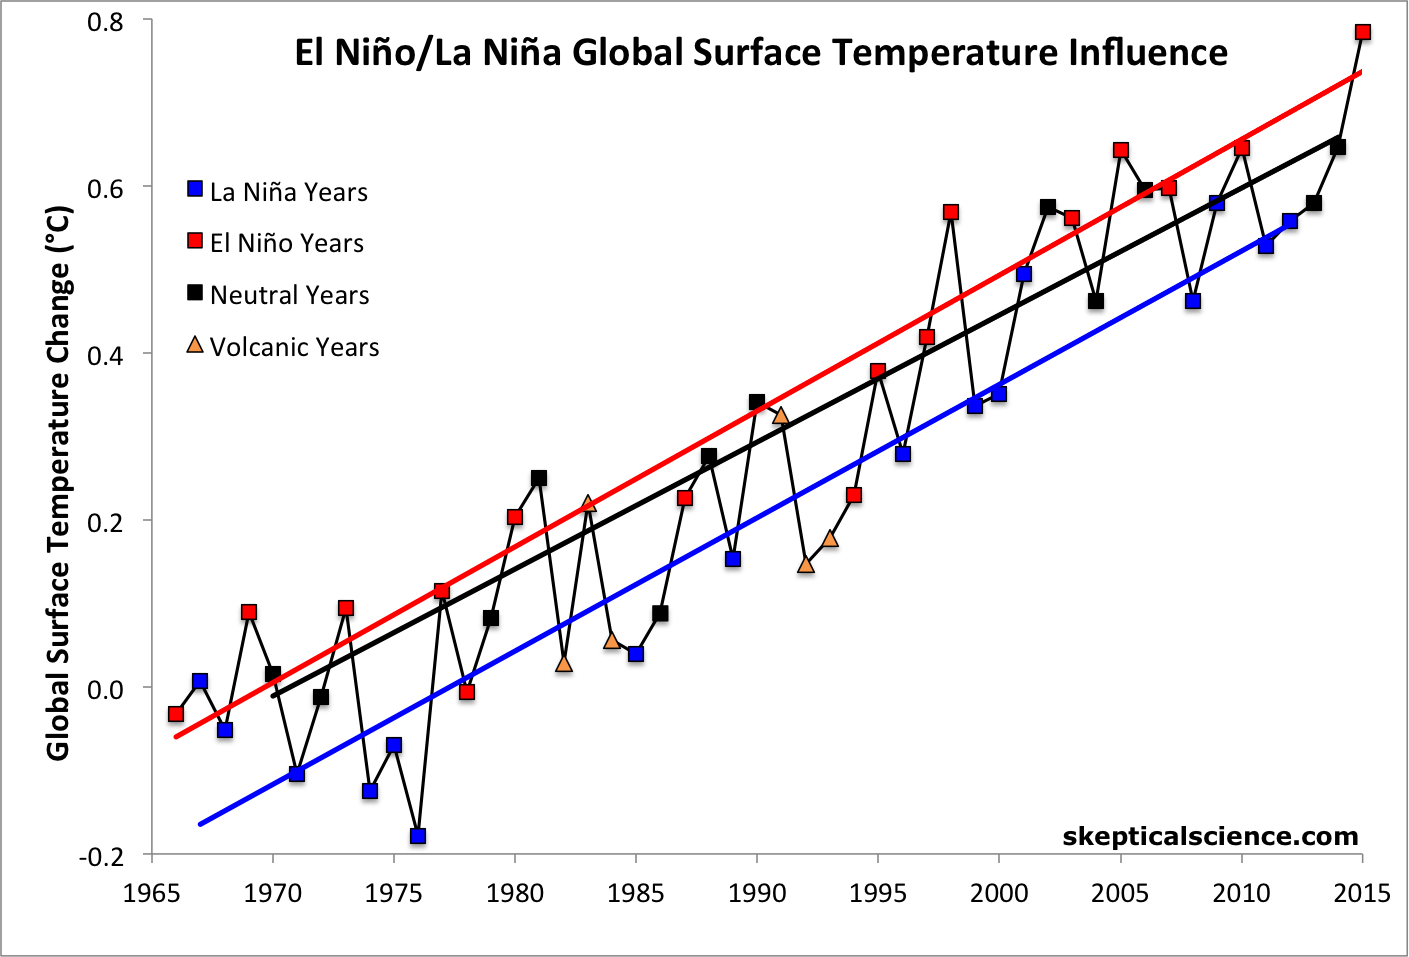
ENSO is just a NV on top of a general warming trend.
Draw a line through EN, LN or neutral ENSO and you end up with that trend – which on the follow graph is ~ 1.6C/cent….
The OP is talking about Tmax, and over a much longer time period. Your “whatabout” objection is overruled.
The claim was that the US is not seeing increased warming.
Either UAH is wrong or there has been warming over the last 40 years. If you accept UAH as in any way accurate it suggests the OP’s conclusions that “There is no persistent warming or cooling trend across the US” is dubious, especially if the OP is cherry-picking maximum temperatures and ignoring minimums to get this result.
The initial claim was for the period 1895 to the present.
Looking at the chart, it’s easy to find periods of a few decades where temperatures were increasing or decreasing.
“The initial claim was for the period 1895 to the present.”
Which is a problem as the US had a very warm period during the 30s , not seen globally.
“Looking at the chart, it’s easy to find periods of a few decades where temperatures were increasing or decreasing.”
But I think using the method I assume this post makes (that is using only maximum temperatures, and making no allowance for any changes in the distribution of stations), there was no warming between 1979 and 2014.
By contrast UAH shows warming at the rate of 1.3°C / century over the same period – hence my suggestion that either UAH is wrong or there’s something wrong with this post’s method.
Even using average USHCN data only shows half as much warming as UAH.
“Which is a problem as the US had a very warm period during the 30s , not seen globally.’
Got a reference for that? Or just arm-waving?
lee
“Got a reference for that? Or just arm-waving?”
_______________________
It’s not arm waving; there’s a clear distinction between US and global mean temperatures during the 1930s.
Using NOAA cUS and global data for 1931-1940, the cUS was +0.34 C warmer than average over that period, while global temperatures were -0.07C cooler than average (1901-2000 is the anomaly base used in both cases).
NOAA contiguous US data: https://www.ncdc.noaa.gov/cag/national/time-series/110/tavg/all/12/1931-1939?base_prd=true&firstbaseyear=1901&lastbaseyear=2000
Note: you need to convert cUS absolute monthly data from F to C: =(F-32)*(5/9), then calculate the anomaly for each month based on the 1901-2000 cUS average for that particular month. (Be a lot handier if NOAA published its tabulated cUS data in C!)
NOAA global data: https://www.ncdc.noaa.gov/cag/global/time-series/globe/land_ocean/p12/12/1880-2018.csv
Mercifully already published in C.
But the “not seen globally”?
“But the “not seen globally”?”
Difficult to prove a negative if you won’t accept any evidence of global temperatures.
But using CET which some think is a good proxy of global temperatures, the 1930s had an average maximum temperature of 13.2°C, slightly cooler than the 1940s at 13.4°C, only 0.1°C warmer than the 20th century average, and about 0.8°C cooler than the 21st century average.
40 years ? Try 119 years .
In 1936 , where I live (Ks) we had 12 days in a row with daily highs above 110 F.
Never even close since …. I call that cooler …
Tulsa, Oklahoma had 65 days at, or over, 100 degrees in the summer of 1936, with about 30 of those days consecutively at, or over, 100 degrees and four of those days were 120 degrees.
This summer Tulsa had four days over 100 degrees.
There is NO comparison between now and the very hot 1930’s. Today is a cakewalk compared to then.
I very strongly object to the continued use of gridding in climate science to determine temperatures. Gridding over values remote locations and under values highly sampled locations. The exact opposite of what the underlying data is telling you.
1 sample from the north pole does not have the same reliability as 100 samples from Arizona. But climate science would have you believe the polar sample is more reliable because it covers a greater area.
Gridding is a statistical disaster. It completely masks the crap data within the good data to arrive at a nonsense answer.
If you want a reliable average then randomly sample the stations to achieve equal weighting. This will preserve the underlying statistics.
If you grid the data you end up with the same problem as tree ring science. One over weighted sample from the arctic determines the average temperature change (anomaly) of the earth.
Garbage method = garbage result.
“1 sample from the north pole does not have the same reliability as 100 samples from Arizona. But climate science would have you believe the polar sample is more reliable because it covers a greater area.”
But it does tell you about the N Pole. The Arizona examples don’t.
No-one says the N Pole sample is more reliable. They say that there is a large area there, and the N Pole is the information you have. The sparse data there adds to the uncertainty of the global average. You can’t correct that by packing in more stations in Arizona.
” then randomly sample the stations”
I actually did a random subsampling of the USHCN data used here – explained here. It was mainly to explain how anomalies really do make a big difference to error outcome. I took 1000 randomly chosen subsamples of 500 stations and averaged. The results were
Taking anomalies reduces the sd by a factor of 8.
This is a remarkably sloppy post. It’s the kind of thing just gives ammunition to those who label the denizens of this website “deniers”. I’ve read it twice, and it’s impossible to figure out what was actually analyzed. In no particular order:
– The graph shows year to year change, but the conclusion states a flat long term trend. That may or may not be true, but nothing in the post directly supports that conclusion. You’d have to estimate the value of each point in the graph and then sum the series if you wanted to reach a conclusion with just the information presented.
– Heat content change is proportional to temperature change, but that doesn’t mean heat content change is proportional to the change in the monthly mean maximum temperature, which is what the USHCN data contains.
– The graph is labeled “Y/Y difference in Tmax – deg F”, but the USHCN data is monthly. Is the graph picking a single month to compare year over year? Is it comparing the average of 12 months of Tmax from one year to 12 months of Tmax from another year? There’s no clue in the post.
– There are multiple USHCN data series, and there’s no mention of which one is being used.
– Given the critique of the “mainstream” climate science community being resistant to sharing their data, we really ought to hold ourselves to a high standard, and blog posts like this should link to a spreadsheet or similar data source.
I know this isn’t a refereed journal or anything, but this post is junk science, and doesn’t belong here.
GH gasses always were going to affect Tmin much more. Why? Incoming solar radiation is ~55% IR. GH gasses reduce solar radiation at the surface, and reduce Tmax.
It is just plain silly to use the raw data in your analysis. You have to use adjusted data to get a true sense of how bad the runaway warming is. /s
Reading through the comments… It seems some people believe that the “increase in global temperature” could all be accounted for in raising nighttime temperatures without impacting daytime ones. I simply fail to see how that is possible – CO2 would have to sensitive to some upper limit temperature where it stops contributing and that just happens to be the daytime temperatures… Weak. I realize it should impact nighttime temperatures more than daytime (all other contributors being equal), but it still would have to impact day time temperatures – that or it turns out that CO2 is no threat AT ALL.
Someone mentions that an increase in yearly average of “0.02” is too small to show up on the graph – I guess I mistook the graph to show TMAX plotted over time (using a baseline to get the zero line), but after rereading the post, I am no longer sure what it is showing… I find that sharp drop near 2014 to be really suspicious… I guess it could be showing a slightly cooler current year versus a really hot previous year?
I agree that this post needs some clarification, but I disagree with the science-snobs out there that it should not be published at all. This is how people LEARN. You produce something, you get critiqued, and you either make it better or give up on it. Once upon a time this behavior was encouraged. Now I guess the High Priests of “I’ve got a degree and you don’t” protect their religion against would-be heretics. Get off your high-horses.
I think it is important to note that Mosh’s comment about the uneven distribution of the temperature stations that comprise the network is not relevant.
The whole point about ‘global warming’ is that the globe is supposed to warm from GHG’s and there is no concept of GHG function that provides for heating some continents and not others. It is in fact a fairly instantaneous response.
Whether or not the sample of stations is random, regional, national or any other selection criterion, the ‘proof’ of global warming will be the ability to show that no matter what sample is taken, there will be a trend that is reflective of the total forcing of the GHG concentration at the time.
Obviously when it was clear there is no Hot Spot and that all detectable warming was in the Arctic (there is no meaningful warming on the continent of Antarctica) the message was changed from hotter hots and for some reason drier drys, to ‘polar amplification’. Suddenly models were showing ‘polar amplification’. Before this change of tack, they didn’t. The ‘fear’ was about hotter tropics and deadly expansion of deserts which fears have now disappeared.
What a crock. Mosh says if the spatial coverage of the USA by the historical network was better, with area weighted numbers and so on, it would show the warming. But there is no way to sample a country unevenly but consistently for a century, and not show the trend up if it is there.
If 50 countries are not warming, the global mechanism proposed is not there. How can one of the largest countries on Earth not show any warming at all in 100 years if GHG increases cause global warming? The high temperatures, which is what the article is about, should be higher, because the overnight lows would be higher, and the same insolation would produce proportionally higher day time maxima. The higher lows are there, but those highs are absent across the board. In fact they are decreasing. WUWT? The facts undermine the claimed mechanism and the bulk of claimed catastrophe.
There is something fundamentally wrong with the GHG quantification, most likely an exaggeration of the actual heating power. If there is any classic GHG additional warming, it is still undetectable with modern instruments. We can suppose it is there, but we cannot suppose it has a strong warming (ECS) value.
Crispin in Waterloo
“How can one of the largest countries on Earth not show any warming at all in 100 years if GHG increases cause global warming?”
_________________________
As several posters have pointed out here, every temperature data set we have of the contiguous US as a whole shows strong warming over the past 40 years at least. The only way the above article smudges it out is by concentrating on high temperatures only and ignoring spatial distribution.
According to NOAA the average warming rate across the continental US since 1979 is 3 deg C per century. The satellite lower troposphere data disagree somewhat (as usual), but RSS also shows warming of 3 deg C per century for continental US since 1979. UAH shows about 2.2 C per century for US48 since 1979.
One of the largest countries on earth *is* showing warming.
But if you look at US measured daily temperatures from 1935-1940 to 2018 (instead of 1979-2018), you’ll calculate an actual near-zero “increase” per 3/4 century in temperatures!
(Well, until NASA-GISS-NOAA lowered the original temperature records. )
“What a crock. Mosh says if the spatial coverage of the USA by the historical network was better, with area weighted numbers and so on, it would show the warming. But there is no way to sample a country unevenly but consistently for a century, and not show the trend up if it is there. ”
I think you are missing the point that Nick Stokes and others are saying. The problem is that the country has not been sampled consistently for a century. Sations come and go and if stations go from a warm part of the country then simply averaging all available stations will produce a spurious change in the average. This is a problem even if every station shows warming.
20 years of flatlining ie no temperature rise with CO2 having no effect. This conclusion is not surprising as it is impossible for CO2 emissions from fossil fuels to cause global warming.