By Dr. John Christy, Alabama State Climatologist
Meteorological summer (June, July and August) is now over and it’s time to check how the summer temperatures compare with other years. For a research project a few years ago we developed a statewide summer temperature index for four 100-mile diameter regions centered on the major cities of the state, Mobile, Montgomery, Birmingham and Huntsville going back to 1883. This summer will go down in that database and in NOAA’s official records as being slightly cooler than average.
Somewhat related to this, a reader sent me a link to a New York Times interactive website that claims to provide the number of days above 90°F each year for cities across the country. The results are produced for the Times by an outfit (some might call it an environmental pressure group) called the Climate Impacts Lab.
Since I build numerous datasets of this type, I took a look. The website asks you for the town and year in which you were born, then provides a time series purportedly showing the number of 90°F days per year since your birth and how that has increased.
Though a native of California, I have lived in Huntsville more years than any other place, so I put in my birth year and Huntsville as my hometown. Immediately I became suspicious when their dataset started only recently in 1960 (and a few years after my birth!) Evidently the Times and the Climate Impacts Lab don’t want to deal with folks older than 58.
For Huntsville and Montgomery, here are their results – kind of scary. It appears that the number of 90°F days has risen to their highest levels ever. I’m told that in 1960 Huntsville had about 45 days above 90°F but by 2017 it was 57 days and rising.


Then, to make matters even scarier, they use climate model projections to 2090 to tell me that when I’m “80” in 2040, there will be 73 such hot days in Huntsville as seen below. Yikes!

Before you sell your house and move to Canada, let’s take a look at the real story. Having built many climate datasets of Alabama, some starting as early as 1850, I knew the Times story was designed to create alarm and promote the claim that humans who use carbon-based energy (gasoline, natural gas, coal) to help them live better lives are making our summers ever more miserable. Be aware reader, this webtool is not designed to provide accurate information.
First of all, climate data for Alabama began in the 19th century, not 1960. In 2016 Dr. Richard McNider (Alabama’s former State Climatologist) and I published a carefully constructed time series of summer temperatures for the state starting from 1883 that utilized numerous station records, some that even the federal government had not archived into its databases (which is the most common source for outfits like the Climate Impacts Lab.) I’ve updated that work to include summer temperatures through 2018 – the result is below. Not only are summer daytime temperatures not rising, they have actually fallen over the last 136 years. Hmmm … after looking at the graph, why do you suppose the Climate Impacts Lab decided to start their charts in 1960?

We went a step further in that paper and demonstrated that climate models failed completely to replicate the downward temperature trend in Alabama over the past 120 years – 76 different models with a 100% failure rate. Would you trust these same models to tell you about the future as the Times does? Why did they not check the models for validity?
Now, what about the number of “hot” (or in Alabama we would say “typical”) 90°F days? For Alabama and the nation, I’ve calculated the average value per station each year since 1895. The results below speak for themselves (there is no increase of days hotter than 90°F) and expose the misinformation provided through the Times.


Providing accurate information on Alabama’s climate is what we do in our office. In fact, using real data, I can’t even come close to reproducing the images that the Climate Impacts Lab did which show 2010’s as having the most 90°F days in Alabama – I’m guessing they are using some theoretical output rather than sticking with observations. Notice how smooth their graph is compared to real data – it doesn’t look real to me. I’ll check and follow-up as I can, but something is fishy.
This is a great state in which people can enjoy life and in which businesses can operate – and our climate resources are one of the reasons we are doing so well in recruitment. Occasionally though the time comes when I must address claims made by those whose intention is not to inform but to promote false alarm – this usually happens when an environmental pressure group generates a press release whose dramatic statements are published by a willing media (without any fact-checking.) This is one of those times, and I’m sure it will not be the last.
Citation:
Christy, J.R. and R.T. McNider, 2016: Time series construction of summer surface temperatures for Alabama, 1883-2014, and comparisons with tropospheric temperature and climate model simulations. J. Applied Meteor. Climatology, DOI: 10.1175/JAMC-D-15-0287.1.
Data from the New York Times website accessed on 5 and 6 September, 2018.
– John Christy
The Alabama State Climatologist
NYT? ‘Nuff said.
the moNkeYs wriTe.
probably using Modeled Data
More like “molested” data
The NYT lies? There’s a shocker…
credibility? long gone.
officially dead with the hiring and then doubling down by not firing, Sarah Jeong:
http://www.foxnews.com/entertainment/2018/08/02/new-york-times-stands-by-new-tech-writer-sarah-jeong-after-racist-tweets-surface.html
Well, there are some things you just can’t make up. Fox News reports today that the editorial board of the Washington Post is blaming Trump for complicity in the generation of Hurricane Florence.
I kid you not. Get some eye bleach handy, and find a bag to put your damaged brain cells in, but please read the Fox article.
http://www.foxnews.com/politics/2018/09/12/hurricane-florence-washington-post-declares-trump-is-complicit-for-dangerous-storm.html
After reading that, (NOT the WaPo original stuff – I wanted to retain my lunch) , whether or not you can steel yourself to read the original complaint/whine at WaPo is yours to decide. I can go no further. Be warned!
These people are beyond nuts. I’m sure they’ll try to pin Katrina and Camille and Andrew and numerous others on Trump, if they can think back that far. They are, in my view, full-blown bull goose looneys who badly need therapy. Best to be aware of them, because the WaPo people are not the only people who think this way. And this story will be picked up soon, if not already, by other news services and the echo chamber will vibrate with weeping, wailing, howling and gnashing of teeth, all coming from the Outer Darkness.
Mods, the story was forwarded to me by a friend.
If there is any “control knob” here, it’s Trump… He controls “Trump Derangement Syndrome.”
Disclaimer: I did not vote for Trump but like *most* of what’s he done so far. Really like Scott Pruitt, wish he’d re-instate him as head of the EPA. I haven’t come across any MSM teeth gnashing over the current head of the EPA and that worries me.
oh they are worried about acting Administrator Andrew Wheeler. He’s a former coal industry executive. They just don’t have any ethics issues on him like Pruitt did with lobbyists.
“the editorial board of the Washington Post is blaming Trump for complicity in the generation of Hurricane Florence.”
I guess Trump got his hands on Bush’s hurricane machine.
Let’s just pray they don’t find Grover Cleveland’s!
Can you imagine the frothing if we had TWENTY landfalling hurricanes?
Hmmmm
The Greenies seem to be missing a trick or two. [Again.]
The short-faced bear is extinct.
Surely Trump’s fault!?
The dinosaurs are extinct – again, surely, Trump’s fault.
Where is the blamestorm for either?
Astonishing.
Auto
Mods – a little bit sarc.
I’m pretty sure it was one of the Bushes who made the dinosaurs go extinct.
Wikipedia
Corporate Knights, Canada
Re: Corporate Knights Magazine and the Washington Post.
Scroll down to: CK Media and Events sections.
https://en.wikipedia.org/wiki/Corporate_Knights
Not lies, just “statistics”.
As soon as I read they wanted the date of birth I thought : what has that got to do with climate?
But it is a clever, and ingenuous, way to introduce selection bias into the result is a seemingly innocent way. It’s an illusionist’s “pick a card, any card” while he forces one on you.
Just like the IPCC’s “latter half of the 20th century” which sounds like a purely fair, round number, it pre-selects a certain period which fits their narrative whereas a wider range , or full data-set does not .
Ignore the earlier hot periods, ignore the post-war cooling, just pre-select a period of fairly steady warming which can be compare to a fairly steady increase in CO2.
Thanks to John Christy for casting some purifying light on this deception.
NYT = Not Yet Truthful
NYT = Never Yearning (for) Truth
NYTimes motto: All the News that Fits (the Agenda).
Thank you Dr. Christy.
Dr Christy,
I thought, initially, that maybe you were using raw data and the Climate Impact Labs were using homogenized, adjusted, corrected data. But then, in your last chart, I see that you used USHCN data. Wonder where the Labs folks got their data. And even their data shows the cooling through the 60’s and early 70’s.
Thanks for writing this article. Now, how can it be gotten out to all the folks who read and believe the NYT?
A pdf of the Christy paper is here: https://journals.ametsoc.org/doi/pdf/10.1175/JAMC-D-15-0287.1
They homogenized by pairwise comparison.
NOAA-NCDC claims that since 1900s most of US has been warming, but the southeast has cooled, with the cooling centered on Alabama-Mississippi.
Good luck on getting the NYT to retract the tool or even consider they may be using incorrect data.
Maybe someone can come up with an interactive tool that calculates how many NYT articles were non factual since you were born. I’m guessing that trend would match their 90 deg day trend.
That’s good! that is a creative way to counter this garbage–I wish I had the time.
Lies of omission are perhaps the most important tool of all to the corrupt mainstream media in furthering their agenda.
Yup, it’s become very popular! Reason being it’s tricky to sue someone for something they *didn’t* say, even though that silence may have materially shifted the balance of the debate. UK’s BBC are now using this technique almost every week. Very naughty.
That, and it’s manifest in their rank hypocrisy – calling out actions or behavior when it suits their agenda or narrative despite completely ignoring the same when not.
Don’t forget limited Hangouts. Critical tactic employed to feign credibility while they never get to any of the meat of the scandals, well, because they wouldn’t pay the bills by taking to task the hand that feeds them
Nothing stimulates like a good scary story. Children sleep under covers to fortify against the monster in the closet then grow up and buy electric cars.
I suggest the kids put up a Bob Marley poster, grab a dope brownie … and just mellow out. That’ll make their bedroom in mommy’s basement into a super safe-space.
And voluntarily give up their constitutional liberties and money via more taxes so the government can save them from the imaginary monsters.
Another good article demonstrating the nefariousness of tuning data to expectations.
I don’t understand why alarmists consistently expect insignificant trends to continue forever at the same, or even an accelerated, rate. The evidence is overwhelming that the climate has many explained and unexplained periodic and quasi-periodic influences that manifest as short term trends (short term being less than about a century). The nonsense applied is fundamentally no different than extrapolating the rise in N hemisphere temperatures between March and June to determine the expected temperature in December or extrapolating the temperature change from 9AM to noon in order to establish what the temperature at midnight will be.
“Alarmists consistently expect insignificant trends to continue forever” because it improves their job prospects. If doomsday is unlikely, who needs doomsayers? If doomsday is not in the offing, who needs absolution from climate sin, or remediation from something unlikely?
This is not necessarily conscious on doomsayers’ part. It’s more like, “If your only tool is a hammer, everything looks like a nail.” If you’re good at soccer but lousy at baseball, of course soccer seems like a better game.
Nobody, even the smartest among us, is capable of taking enough facts into account to maintain a broad perspective on every issue.
Tom, when one’s putative work is in a particular field and one purposefully ignores extant data or makes up data in that field, you get fraud.
“alarmists consistently expect insignificant trends to continue forever ” …
Speaking of insignificant trends, I noticed the other day that I had seen two dead squirrels in the road one day, and four the next. I knew this doubling everyday meant that I could expect to see a million dead squirrels in the road by the end of the month if I extended this trend. (Soon, children wouldn’t know what a squirrel was.)
The next day I saw four again, so this broke the doubling trend. Except when I looked back and realized that perhaps I only saw one the first day, and may have miscounted the second day so I could only verify two. I adjusted the previous numbers down, and the doubling trend was back (1, 2, 4 …).
It’s a squirrelpocolypse I tells ya, send money so we can study the problem. Radically alter your economic system so we can fix the problem. Hurry before it’s too late, the point of no return is nigh!
Classic example of how to use cut-off graphs.
why do you suppose the Climate Impacts Lab decided to start their charts in 1960?…..
because it catches the full rise of the AMO
Had to look up AMO … and got this …
https://youtu.be/aSiT8VbDhBk
LOL…that’s it Kenji!
I ran Eugene, Oregon (close to my hometown). It gets hot in Eugene in the summer. I remember many days in the 60s that were well above 100 deg. The NYT database is obviously FUBAR as it shows fewer than 10 days above 90 deg
If the past cools down any faster, I fear our grandparents will perish in an Ice Age.
Dr. Christy, just so we’re comparing Red Delicious to Red Delicious, could you graph the results for just Montgomery and Huntsville? Before Nick Stokes or Steve Mosher get on your case.
Dr. Christy
Montana has created a climate prediction site (http://montanaclimate.org/) that uses one of the numerous models available. They break Montana into several regions and, using the model info, predict every aspect of the changing climate so we can plan our towns, forests, and agriculture. My comments to them about the lack of skill in the model they chose for continental scale changes should be enough to prove the unreliability of these predictions. In my opinion this production is worse than a waste of taxpayer money as it gives the impression that it is an accurate prediction.
Do you have any way to influence other states to act reasonably on this sort of activity?
Like so many, they utterly misunderstand averages and what the models are actually telling them – even if the models had any skill!
One of my favourites is how AVERAGE higher temperatures will kill off insects that live for a few days or weeks. The people producing this nonsense don;t seem to comprehend that not every day will be warmer!
But … isn’t that overcome by the increased number of breeding phases of insects … induced by a hotter climate? I read that we were going to be so overrun by bugs … that we would have to start eating them … which would also cool the planet
We will be overrun by non-existent bugs, Kenji – just like the newsroom at the Washington Post. Just ask Bob Woodward.
Actually, they have a certified psychic making the predictions. The models just make it look like science.
Much of the problem is not what the NYT doesn’t know. Rather, it is the much that they know that ain’t so.
Thanks, Reagan.
PS. When Reagan was elected I was young and wondering why Reagan won though media clearly told he was inferior. Learning my mistake took a long time.
I too was young when Reagan won, but I didn’t need to wonder why he won. For one, I didn’t listen to the media even back then and for another I could see what James Carville would eventually quip during another Presidential election: It’s the economy stupid. Under Carter, the economy was a mess (IE stagflation) with long lines for gas (on alternate days depending on your license plate number being odd or even). Given the poor economy, it’s no wonder people wanted someone else in charge.
Am I reading that projection right, that there will be more 90 degree summer days in the future than there are days in the summer?
Please tell me how CO2 can cause a record high temperature? Incoming radiation is needed for record high temperatures. CO2 only traps outgoing LWIR, which is irrelevant during the day where incoming warming visible radiation dominates. Record high daytime temperatures is evidence more warming radiation is reaching the earth’s surface, and rules out CO2 as the cause. Once again, how could the GHG Effect, that thermalizes outgoing radiation, even cause a record high temperature? Can the GHG Effect ever warm the atmosphere higher than the radiating body? Once again, record high temperatures by definition require additional radiation to be added to the system. CO2 doesn’t add additional energy. It simply converts LWIR into thermal radiation.
Quantum Physics 101; Why CO2 Can’t be Melting the Glaciers and Sea Ice
https://co2islife.wordpress.com/2018/09/10/quantum-physics-101-why-co2-cant-be-melting-the-glaciers-and-sea-ice/
Excellent point, thank you.
In a desert without clouds at night it is cold. With clouds which are not frequent ( by definition it is a desert after all) the desert is warm at night. The water vapour absorbs the LWIR. CO2 is a bit player as witnessed by the inability to warm the air directly in a room by an infrared heater. The infrared heater warms objects in the room including the walls (not the air). The air temperature eventually goes up because of conduction, not because of IR directly. NASA energy balance graphs have ridiculous downward back radiation without a corresponding upward radiation. CO2 is isotropic meaning it radiates in all directions. NASA would have you believe that the downward backward radiation which has to be constant 24 hours a day (because the earth and atmosphere are always radiating) is greater than the incoming initial solar (even before 30% is reflected and 20% is absorbed by atmosphere). Everyone has experienced walking outside during the midday and feeling the heat on the back of ones neck. HAS ANYONE EXPERIENCED ANY WARMTH ON THE BACK OF ONES NECK AT MIDNIGHT OR EVEN AT MIDDAY IN THE SHADE?
“HAS ANYONE EXPERIENCED ANY WARMTH ON THE BACK OF ONES NECK AT MIDNIGHT OR EVEN AT MIDDAY IN THE SHADE?”
When the wife is frisky, yes. 🙂
“HAS ANYONE EXPERIENCED ANY WARMTH ON THE BACK OF ONES NECK AT MIDNIGHT OR EVEN AT MIDDAY IN THE SHADE?”
Solar SW at the Earth’s surface is ~160 W/m^2 – that is a global average (24/7).
However your “back of ones neck” can only be when in full sun … obviously NOT 24/7 – so considerably more than 160.
At the summer solstice at ~34deg N there is around 900 W/m^2 “hitting the back of ones neck” at midday.

That’ll feel a tad hot.
“CO2 is a bit player as witnessed by the inability to warm the air directly in a room by an infrared heater. The infrared heater warms objects in the room including the walls (not the air).”
Correct – however a “room” is not the atmosphere.
You are obviously unfamiliar with the Beer-Lambert principle…..
https://en.wikipedia.org/wiki/Beer%E2%80%93Lambert_law
Which has the astounding concept of appreciating that the depth of the atmosphere is a shade longer than than your “room” height.
Like ~ 100,000 times longer.
That is the path-length a photon takes to reach space and cool Earth.
It will find infinitely more CO2 molecules and for than matter other GHG molecules, on that journey than through your “room”.
That is how an impedance works- not just on concentration but on path-length.
Also whilst those photons are being “intercepted” and redirected, some back to Earth, others are entering the system (should it be daylight).
In other words the impedance to photon flow causes a back-up of more energy incoming behind that accounts for the ~320 W/m^2 back-radiated LWIR at the surface (remember some will “bounce” multiple times).
“HAS ANYONE EXPERIENCED ANY WARMTH ON THE BACK OF ONES NECK AT MIDNIGHT OR EVEN AT MIDDAY IN THE SHADE?” Yes actually…It was a Cold Heat
Anthony Banton: Yet another sneering misdirection. EMF must be vector force or it does not flow, while the sun on my neck is real. Having c.6000C to back it. The twisting of photonics that claims they do not know or care where they come from or go to, is a meaningless ducking of the point. Which is that we are dealing with Quantum vector forces.
What does happen is thermalisation which immediately removed expanded gases by buoant uplift. This is the real dominant transfering mechanism, magnified by water vapour latent heat transfer. These are the equipartition principles in action, bypassing radiation until Beer-Lambert can let it through.
We’re not really talking about ‘warmth’ in this case, but rather a small positive change in temperature. Much of the greenhouse effect is about very cold becoming less cold. And yes, it is most apparent during midnight/little hours, and it is due to water vapour.
CO2isLife, you ask:
“Once again, how could the GHG Effect, that thermalizes outgoing radiation, even cause a record high temperature? Can the GHG Effect ever warm the atmosphere higher than the radiating body?”
Q. 1 answer: Less heat radiating away at night starts the mornings at a warmer temp, so higher daytime temps are reached without increasing heat input. That’s the theory, anyhow. Suppose your town currently has average overnight cooling of 25 degrees F. Suppose GHG levels in your area rise enough to reduce nighttime cooling to only 24 degrees F. Then, when a fairly cloudless day drives daytime temp up to 89, your town only cools overnight to 65 degrees F instead of 64 like it used to. If next day has same amount of solar heating as previous day, temp then rises to 90 degrees, when there would have only been a 2nd 89 degree day currently.
Whether CO2 will cause this to happen is the question.
Q. 2 answer: Instead of an answer, your 2nd question gets a counter question: By radiating body, do you mean the surface of the Earth? On a sunny afternoon when the air 6′ above ground is 90 degrees F the ground is much warmer. That is why eggs can be fried on the sidewalk on a hot sunny day even though the air isn’t hot enough to cook the egg. Do you think GHG Effect requires atmosphere to be warmed to higher temp than the ground?
If the radiating body you speak of is the atmosphere, nobody is claiming the atmosphere is HEATING the surface (which then warms air in contact). The claim is that the surface, which was heated by the sun during the previous day, will cool less overnight if receives more IR photons during the night than it used to.
I don’t think this will actually be a problem, I just think stating that a radiating body cannot warm anything to a higher temp than the radiating body will not dent warmist’s thinking.
SR
Steve Reddish: Excepting UHI, the extra heat does not exist by 4am, if it ever did. But I suspect you are hinting at that…..
Brett,
Not quite. CO2isLife was asking how GHG effect could cause daytime high to increase. I gave the theory, but questioned whether CO2 was the GHG that could do it.
I think a GHG does hold temps up overnight, because temp drops only 20 something degrees F in humid places, but drops 35+ degrees F in arid places. The GHG making the difference is WV, of course. I also think a large part of the delay in cooling is due to the high specific heat value of H2O and the heat of condensation released by dew and cloud formation. Since CO2 lacks both of these characteristics, and the relevant IR band is saturated, more CO2 won’t slow overnight cooling.
The proof of this is that deserts cool off at night just as fast as they ever did. Extra CO2 in the air is not having any measurable effect on deserts. (Irrigation in deserts in the US southwest is reducing overnight cooling, though.)
I don’t disagree with CO2isLife’s conclusion that more CO2 will not warm the climate in any harmful way, I just think his explanation of the 2nd Law of Thermodynamics will not sway any warmists or their useful idiots.
SR
For Alabama, it’s more than just the meteorological summer, the trend for the warm six months of the year May through October, according to NOAA’s Climate at a Glance, shows cooling:
That’s true for quite a few of the states east of the Rockies:
Impossible! NOAA and NASA have certified 3 of the last 5 years as the HOTTEST on record … EVER in the HISTORY of the planet!!!!! Ohhhhhh mammmmma.
Well sure, but they accomplished that by using city stations’ abnormal night-time lows to smear UHI across all the surrounding rural stations, then reporting the “average” as being higher despite the fact that all us commoners out here noticed slight decreases in winter heating with consistent summer air conditioning. i.e. summer highs not higher!
Sorry if this is too far off topic, but can anybody explain to me why it seems that nobody is accusing the NY Times of fabricating the anonymous op ed that was supposed to have been written by a senior Trump administration official?
The NY Times has so little credibility with me that I immediately assumed that it was a hoax and will only believe otherwise when an actual senior administration official admits to being the author.
Accusations without evidence are surely the wrong way to go . . . . . If someone has evidence that it’s a hoax, it’s likely to come out.
Maybe I was too open about my suspicions. A more discreet way to ask this is why everyone seems to accept the claim without evidence. You would think that we would at least see some admin spokesmen saying “alleged” or “supposedly” instead of accepting it as fact, given the proven dishonesty of the lamestream media.
I asked the same question, Rich. President Trump himself answered it for me. When he didn’t call it a lie, but rather accepted the premise, then so did I.
Many have accused them of making it up, but as expected, it’s just not widely reported in the press. I don’t think the NYT made it up, but none the less, the article definitely seemed to be ‘trumped’ up.
To many, the language seems like it came from a never Trump Republican, moreover; for some reason, people think the NYT is a reliable source. To me, the op-ed seemed like it was written by a progressive who was trying to sound like a never Trump conservative. The problem is that never Trump conservatives are a dying breed as they are all coming around to like the results he’s getting.
It also seems like the article was written by someone familiar with either economics or science which is where the term ‘steady state’ often appears. Steady state politics is an oxymoron.
https://www.reuters.com/article/us-usa-trump-woodward/watergates-woodward-says-times-trump-op-ed-not-up-to-his-standards-idUSKCN1LP0LZ
Even Woodward himself said the NYT article was Trumped-up …
Rich, I had the exact same thought from the beginning. How do we know that this anonymous senior aid even exists? I don’t trust the New York Times. I wouldn’t put it past them to fabricate the whole thing. For a story of this magnitude they need to produce a name. Or at least some hard evidence that can be confirmed.
There are hundreds if not thousands of people in the administration who can be considered senior administration officials and the press has an even looser set of the necessary qualifications. Many of these officials are career bureaucrats, spread around the country across all agencies including many who were hired during the Obama administration.
The risk to the NYT of exposure to fabricating something like this is far too great, but printing a fabrication written by someone else has no risk and significant benefit if it fits the editorial narrative, regardless of whether or not the author is exposed. They probably did a similar risk assessment regarding concealing the author and came to the same conclusion.
Quite a good exposure over here:
Pleased to see Tony Heller getting some credit for exposing this in the first place, whilst I may not always totally agree with his politics his work on climate data and exposing the attenuated claims of “unprecedented” is tireless.
I’m not concerned with his politics at the moment, but his work seems to be quite accurate and well researched.
I’m an anarchist but I often find myself agreeing with Republicans, sometimes Democrats (although increasingly unlikely), and police/military depending on circumstance. The point I try to drive home to my coworkers and acquaintances is that even a liar tells the truth on occasion, it is up to the listener to decipher what is accurate.
not calling Tony Heller/ Steve Goddard a liar, and I can see how that may have been misconstrued.
Basically, regardless of the source, sometimes they will let a bit of truth out.
Conway NH had one 90° day in 1960 and one in 2017. From this they project 7 days by 2089.
Well done for speaking up for Alabama, Dr Christy.
A bit of perspective: Though born in the NE USA I mostly grew up in the UK. When studying for my PhD in Seattle WA, my supervisor changed locations to South Carolina. I was too close to graduation for it to make sense in following him there. But I recall the reaction of my fellow (American) students who were not from the South East: They were horrified at the prospect. Disgusted, and almost frightened, it seemed.
Some years later I rejoined my supervisor again for a while in SC. Sure, it was unpleasantly hot and insecty in summer by British standards, but I failed to see why other ‘Northern’ Americans thought of it and the people as being barbaric. I suspect Alabama is regarded the same way, or worse.
Whilst I was at Univ of Florida someone from “The North” came for a job interview, but was reluctant to accept the job because of slavery.
climanrecon,
mental defectives like you describe need to stay where they are. I’m worried about my home state of Texas becoming blue because of all the fleeing Californians bringing their political leanings with them.
The original out-migration from California’s high property taxes in the 1960-1970’s built Phoenix and Las Vegas as conservative bastions (that high taxation led to California’s famous Prop 13). Now even the fed-up middle class liberals are leaving California, turning Las Vegas blue and threatening to do the same to Phoenix.
You must be really, REALLY old Mr. Climanrecon
“Why did they not check the models for validity?”
Because that’s how science works, always checking at least twice to remove any likelihood of major errors! 😉
As an engineer I use analysis software all the time, but I only know it’s correct because I can do the calculations by hand in the first instance, & I always tell graduates not to wholly rely upon computer output unless you can check it by hand at some point! Believe it or not, some well known analysis packages contain fundamental errors!!!!! Great post anyway!
Don’t worry, I’m not thinking of moving to Canada. I’ve read the family history of a family member that was promised farm land in Canada in return for providing service as a Loyalist during the American Revolution. That family member went on to claim the land only to find out it was a rock outcrop surrounded by bog.
Don’t move to Canada, we have Trudeau 2.0!
In this article I post a link to, there is a tool that can be used for detecting health scams.
Hum seems it can be useful for not just health scams
https://www.cbc.ca/news/canada/british-columbia/miracle-cure-or-major-con-ubc-researchers-break-down-329-likely-health-scams-1.4819225?cmp=rss
I noted a cool summer this year with winter-like fronts in the central U.S. much like the cool summer of 2009 during that solar minimum.
Statistical ju jitsu. That explains MOST of the climate change hysteria. Don’t fall for it. RESIST the opponents leverage.
I found a very interesting climate data sheet on the website of my local National Weather Service office in St. Louis:
https://www.weather.gov/media/lsx/climate/uin/temp/temp_uin_ranked_90_100_occurrence.pdf
The data is for Quincy, Il. Here the list the actual number of days at or above 90 degrees recorded, and rank the top 50 years with the most, and the 50 years with the least. They also do the same for just the summer months. The top 10 years with the most 90 degree or hotter days all occurred before 1938! Of the 10 years with the least amount of 90 degrees or more, all of them happened after 1950, and 3 of the top 10 in the last 10 years!
Still, when i typed Quincy, IL into the New York Times calculator, it showed data that didn’t match the actual numbers recorded at Quincy at all!
Curious, I typed in Troy, MO in the New York Times Calculator, knowing full well that there are no reliable temperature records for Troy, MO. This didn’t phase the TImes in the least. The very precise graph came up in an instant showing very precise numbers for Troy, MO.
I have a new advertising branding scheme for the Grey Lady: “At the New York Times, We Make it UP!
“All the news that’s fit to print” used to be the NYT’s moniker.
Now with Krugman writing Economy porn, and Brad Plumer (a former senior editor at the hyper-Leftist Vox) writing climate science porn, their moniker is:
“All the propaganda we want you to believe.”
“At the New York Times, We Make it UP!” They are a wing of the game show “Whose Line is it Anyway?”.
Maybe the NYT’s is trying to atone to its base of environmental whacko’s for the sin of hiring Brett Stephens (someone they call a denier) as an op-ed writer?
You’d think they would just replace him.
Thanks Dr. Christy, I spent a few minutes checking Conroe, Texas, a small city in SE Texas. It has a long temperature history in the NCDC climate database. I checked it against the New York Times plot, which is calculated from the Berkeley Earth 1×1 grid and the Princeton Meteorological Forcing dataset, then smoothed apparently. To emphasize the difference between the real measurements versus the New York Times garbage I overlaid the two plots. The blue dots are actual measured data and the orange curve is from the NY Times.
Here is all of the Conroe data to 1900, if anyone can find a trend, let me know:
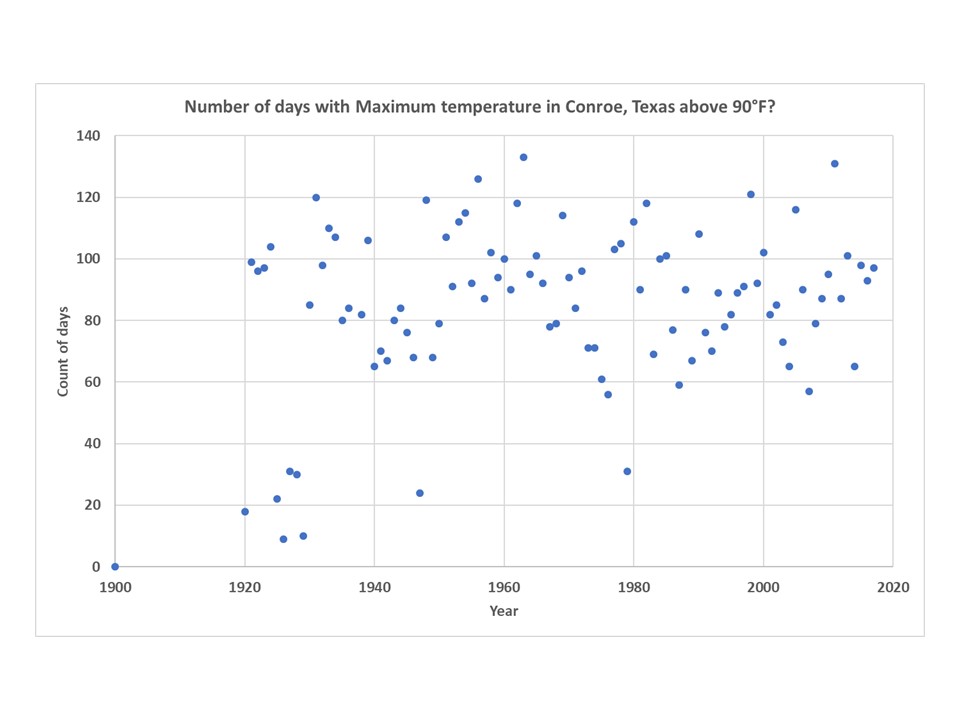
Perhaps a slight decline since 1960? In any case this is one station, in a grassy and forested area. It has been relocated three times, 1947, 1952, and 1963. The only major relocation was in 1947 (6 miles).
It MUST be warmer, because Harvey!
These are the sort of shell games I’ve found in almost every alarmist story I’ve ever read. You dig long enough it’s always there… and usually you don’t have to dig far.
Yeah… if you tell people there were more hot days in the 1930s that might give them the idea all these lurid AGW fears are a bit exaggerated.
Check the FAQ at the bottom of that page. It sheds some light on this. It’s like reading the fine print. I don’t agree with the assertion that there were not good measurements before 1950.
Entered my town, Ann Arbor, into the NYT app and found we’ve been on a cooling trend, well, except for the future!
Dr. Christy ==> Thanks for exposing another total hash of reality by the New York Times’ Climate Team. They have a special team of propagandists churning out all kinds of nonsense to match the papers editorial Narrative on Climate Change. Real world reality is not involved.
I tried the interactive propaganda mill. Initially, I put San Jose (CA) in, which was where I spent most of my teenage and adult years. It said that there was no database available. Then, just for kicks, because I had lived in Phoenix briefly as a child, I entered Phoenix as my birthplace. It came back telling me that it only had data since 1960. It looks suspiciously like their database has been truncated to start after the post-war cooling trend in order to accentuate the recent warming.
Climate warmists call that “cherry-picking”. Oh, wait, they did it, so never mind……
Thanks John Good post!
Its very disturbing of how often climate data is being manipulated. The cooling in Alabama is not restricted to the Heart of Dixie. For the most part, the southeast USA has experienced what several papers have labeled a “warming hole” where temperatures have cooled for the past 100 years. Of course if all the data is presented then the public must realize that natural variability exerts a huge influence on climate.
http://landscapesandcycles.net/image/126096406_scaled_612x190.png
Figure from Mascioli et. Al. (2017) Mascioli et al (2017) Timing and Seasonality of the United States ‘Warming Hole’; Environ. Res. Lett. 12
It gets worse, and it is not just the NYT.
Today, the Washington Post went so far as to blame Trump for a storm which has not even hit yet, and other have blamed him for not responding to the aftermath appropriately…even though the storm is still days away from land!
https://www.washingtonpost.com/opinions/another-hurricane-is-about-to-batter-our-coast-trump-is-complicit/2018/09/11/ccaed766-b5fb-11e8-a7b5-adaaa5b2a57f_story.html?utm_term=.5ad1e4735b10
TDS runs rampant in the media. Not that derangement wasn’t rampant before, of course. It’s just now named and has a target that is clear and simple.
I think they attempted to lie by ommission by using the end of a thirty to 40 year cooling trend in 1960, but the results still weren’t scary enough, so they decided to just lie by lying…
Saw the same article and checked my hometown. The NYT claims Albuquerque had 37 summer days over 90 when I was a kid versus 56 now. That is horsepucky. Way more over 90 days when I was young, like all of June, Juky and August.
I don’t know about others, but I never considered days over 90 to be a heat wave. Only if the temperature exceeded 100F did I think it was truly a heat wave. I grew up in southern Iowa, so there was both heat and humidity. The bar for “heat wave” gets lower and lower. Soon, over 65F will be a heat wave.
It’s also interesting that people in very warm climates, like southern Arizona, will put on coats when it’s 45F out and those of us from cold climates are running around in shorts still. “Heat wave” really has ZERO meaning.
That’s because of acclimation. I am a born and raised Southerner. We, who have lived here for a long time, are used to high temps and humidity (absolute humidity). As such, we are geared to limit heat gain from the environment and maximize heat loss to the environment. We put on jackets when it is cool because we are adapted to warm. I am an old man now and I don’t tolerate cold nearly as well as I did when I was a young whippersnapper. I’ll put on a jacket if it is cooler than 60F. Why? That’s cool enough to make me feel cold, and if I don’t do it and persist, I’ll reach the point where I show signs of and have symptoms of hypothermia.
Isn’t the real story … who stole the NYT credibility ?
Biased , tabloid garbage from a paper that is peeing all over it’s heritage .
Who buys it ? Not me that’s for sure .
Evergreen college grads are going to be holding a piece of wall paper
now that their PC white racism is taking their attendance off a cliff .
New enrollment down 30 % , layoffs , trashed budgets for what?
To feed a hate the white people mob .
Why would anyone send their kids to a shit show like that ?
Trump may be easy to dislike by many but he got it right on the climate con game .
I wonder if the NYT climate reporter, Hiroko Tabuchi, had anything to do with this? I caught her red-handed just yesterday:
https://twitter.com/scute1133/status/1039341398238093314?s=21
She was manipulating plain, honest facts to further her agenda that Kansai Airport in Japan, a man-made island, is sinking way more rapidly than engineers had predicted back in 1987 at the commencement of construction. She did this by trawling a Kansai Airport technical page for cherries to pick. The highly informative page she found made it very clear that the subsidence was entirely in keeping with the engineers’ projections.
The several data points she surgically removed from the page served her alarmist purpose very well and when woven in between two different and irrelevant links (both to a single page) it made it appear that her spurious additional statements were valid. And the ultimate goal was of course to show how the alarming airport subsidence exacerbated the alarming sea level rise from global warming.
This was really intricately planned. That’s why I call it a Black Art in the tweet above.
Firstly, she excised the info she wanted without the copious, well-written context and then DIDN’T link the page she’d used. That way, the reader couldn’t see that context.
Secondly, she chose a link that appeared at first blush to look relevant because it was another Kansai Airport technical page about the subsidence. But it was only about subsidence in general and made no reference to the alarmist claims in the NYT paragraph in which it was linked.
Thirdly, it was linked twice, right next to two of the alarmist claims as if to show us that Tabuchi had done her reasearch (that’s if anyone cared to click on it).
And finally, the actual words in the hyperlink are innocuously referring to what the page actually says (subsidence). But this is secondary to the main thrust of the sentence in which the link is placed. The main thrust is that the subsidence was unexpectedly fast and that it’s continuing to sink (presumably still unexpectedly fast).
Of course, the Kansai Airport technical page was long and very helpfully technical! This page, from which Tabuchi got her data, said that the fast initial subsidence was expected because it was *desirable and engineered in*. She also neglected to say her “last measurement” of 43 feet subsidence was at a rate of 6cm/year thus showing that the subsidence was tending towards an asymptote of less than the 50 foot projection .
A Black Art indeed.
You can tell Tabuchi used the longer, unlinked page because her “over 30 feet” and “43 feet” correlate with the subsidence table values (given in metres) on that page. And her “first seven years” correlates exactly to the time frame in that table for the “over 30 feet”.
And how did I smell a rat? I know the exponential behaviour of subsidence. Fast subsidence in early years would never be a surprise to a competent engineer.
The mainstream media and the left (but I repeat myself) are always dishonest, and often maliciously and malignantly so. I appreciate the record being set straight. Why oh why can’t they just tell the truth instead of lying to push an agenda?
If the Radical Left doesn’t lie, they lose.
Dr. Christy-san:
NOAA deleted the following graph from their website in June 2017 (after Trump announced US pulling out of Paris agreement) showing the huge amount of heat they’ve added to USHCN’s raw temperature data between 1900~2000:
Has anyone calculated how much additional heat NOAA added to the USHCN raw temp data between 2000~2017, especially the huge adjustments made after the KARL2015 paper?
I wouldn’t be at all surprised if total adjustments to raw temperature data now exceeds +1.0F.
TIA.
Tony Heller keeps a very good accounting of all of the fake adjustments on his blog site.
I put my hometown in Smithtown NY….so in 1960 they show 5 days….in 2017 they show 4 days….the climate models zoom to 15 days by 2089….hmmmm…odd thing about the graph is that it showed decimal days…..has to be integer value. Therfore it has to be fake
Mmmm, something seems to be missing here?
Where’s Nick and Mosher?
Hmm,…John, I can see why you are a sceptic! One manipulation that BEST climate folk do is remove such big step changes as the drop in 1960. They would have slid the curve vertically upwards at 1960 to “even” the record out, thereby having the recent decades the highest. Boy there is a lot of rehab of datasets needed when climate wroughters retire.
Yet the manipulators yell “cherry-picking” every chance they get. Projection, anyone?
Put a pin in the map; Alabama is protected.
John-can your data be used on another blog if it is attributed to you?
Methinks this is a random number generator. Picking the places I have lived:
Missouri Valley, Ia 23 past 25 future
Rock Rapids, Ia 16 past 12 future
Casper, Wy 16 past 24 future (guess it’s punishment for oil industries…..)
I also put Council Bluff, Ia in since that’s very close to Missouri Valley 30 past 27 future
Somehow, a town just a few miles away cools 3 degrees and another warms 2 degrees. How can that be?
For fun, I checked Jackson, WY. Present is 0, future is 4 with a range from 1 to 8. Really? A chimpanzee with a dart board can do that well. And they call this garbage science????
I also checked temperature records for 2001, an exceptionally hot year in Casper. There were 49 days above or equal to 90F in June through August. Fun with statistics and illustrating the magic of homogenization (great for milk, not so much other things).
Thank you, Dr. Christy. Though I was not born in AL, I have lived in AL since January 1962. Question for the audience (no peeking and don’t call Dr. Christy 😉 ): “What is the average daily high temperature in most of AL from May 15th through September 15th?”, and again, no peeking and don’t call Dr. Christy.
Okay, I’ll relent. The answer is a number between 85F and 95F. 😛 Where I am in AL, the average high temperature reaches 90F near the end of May and runs though the early part of September. Indeed, in an average year, I can expect to see 90F or higher about 100 times.
As Dr. Christy says, it has been getting a bit cooler here over the last 120 years or so; and especially so away from the bigger urban areas.
A bit of history, for you. Mobile has been one of the larger areas for most of the state’s history. Birmingham didn’t even exist when the state was admitted into the Union. Huntsville was smaller than Tuscaloosa 60 years ago. Now, Tuscaloosa is about 2x its size then and Huntsville is about 4x its size then, and is the fastest growing city now. Birmingham was founded just after the end of that nasty war, and almost didn’t survive a cholera outbreak. Around the turn of the century (19th to 20th), Birmingham boomed and was dubbed “The Magic City” because of its rapid growth from the 1890s to about 1920. Birmingham’s population peaked in the 1950s and early 60s, at about the same population as Oakland, CA, then. It has steadily declined since then, while the metro population has continued to grow to about 1.2 million today. Montgomery was not always the state’s capital, too.
I know this is bunk as I specifically remember the summer of 1988, marked by breaking a record for the number of days about 90. I remember the TV station in Kirksville, MO, reporting on that record. The number of days was in the 60’s. So I put Kirksville into the NYT site and see that the highest number of days above 90 in Kirksville happened in 1981, at 25 and a half. I don’t know where they get the half, either. But nowhere, even when I’m 80, will it get anywhere near the 1988 record.
I’m shocked, shocked to find that
gambling is going on in herethe NYT lies! (with apologies to Captain Louis Renault).It would be great if this post could appear in condensed form in the Wall Street Journal as an op-ed. NYT presenting materially false/incorrect climate data seems a significant issue on which it should face correction and pushback.
The New York Times lies about nearly everything.
Read this post on Reddit about this interactive page on NYT. Quite funny because none of them are deniers…
https://www.reddit.com/r/dataisbeautiful/comments/9egubr/how_much_hotter_is_your_hometown_than_when_you/
Read this post on Reddit about the NYT graphs. Quite hilarious because none of the people are deniers..
https://www.reddit.com/r/dataisbeautiful/comments/9egubr/how_much_hotter_is_your_hometown_than_when_you/
Quite sone time back, I was investigating household heating and cooling requirements and ran across the concept of “degree days”… estimates of how many days required how much heating or cooling.
Working in the same building and regularly encountering meteorology professors & grad students, I asked whether they had such data…at least locally. Some had never heard of the concept, others just did not know whether they had such data. One suggested that maybe the department’s data hoarder might have such info; he might not be too bright, but was very conscientious in keeping their data organized and backed up.
But the prof eagerly offered to give me the current weather report from the Viking Mars lander (since I’m still quite young, I must’ve been holding a sippy cup & teddy-bear when I toddled down the hall to ask).
Whatever the fad of the day, that is the data they collect and preserve (unless they have a dogged James of their own). Other info is often dropped by the way-side.