August 2018 Hurricane Region Sea Surface Temperatures, in Advance of the Peak Hurricane Month and Florence Making Landfall, Assuming She Does
Guest essay by Bob Tisdale
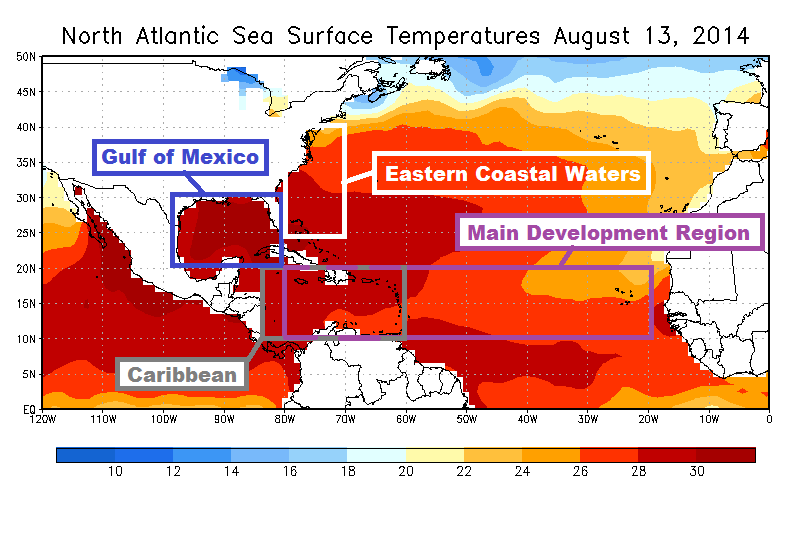
September is upon us, and September is the peak month for hurricane activity in the North Atlantic. (See the NOAA Hurricane Climatology graph via Wikipedia.) So, to check the temperature conditions leading up to the peak month, let’s take a look at the August 2018 sea surface temperatures anomalies and sea surface temperatures for the hurricane development regions—Main Development Region (10N-20N, 80W-20W), Caribbean (10N-20N, 86W-60W), and Gulf of Mexico (21N-31N, 98W-81W)—along with those of the waters along the east coast of the United States (24N-40N, 80W-70W). For the geographically impaired, see the map here for the locations of those regions.
Note: This is simply a data presentation, so don’t be looking for conclusions at the end of the post. [End note.]
Sea surface temperature is one of the factors contributing to the development and sustainability of hurricanes. Joe Bastardi has recently been discussing other factors during his daily and Saturday updates at WeatherBELL, and I suspect he’ll continue to do so for a good while, so visit WeatherBELL and tell Joe I sent ya. (Hi, Joe!)
SEA SURFACE TEMPERATURE ANOMALY MAP
Figure 1 is a map of August 2018 sea surface temperature anomalies for the entire North Atlantic, plus a small portion of the East Pacific. It was created at the KNMI Climate Explorer using NOAA’s Reynolds OI.v2 sea surface temperature data available there. Reynolds OI.v2 is also the dataset used for the graphs that follow. August was still showing lower-than-normal temperature anomalies in the North Atlantic at high latitudes and in the tropics, along with a region of elevated anomalies at mid latitudes. That spatial pattern is known as a tripole.

Figure 1
There are of course some knuckleheads out there who will focus on the warm water at mid latitudes of the North Atlantic, claiming that Florence was made worse by it, and I suspect they’ll use the word unprecedented lots of times. To combat that alarmist trash, I posted the sea surface temperatures for the warmer-than-normal pool in the North Atlantic in a post on Sunday. See the post Sea Surface Temperature Anomalies of the Patch of Warmer-Than-Normal Waters in the North Atlantic. The cross post at WattsUpWithThat is here. The overly adjusted NOAA ERSST.v5 data show that the sea surfaces in that warmer-than-normal spot were comparably warm, if not warmer in the 1860s, 1930s and 1950s.
And for those interested, Figure 2 presents a graph of the sea surface temperature anomalies for the entire North Atlantic (0-70N, 80W-0) from November 1981 to August 2018, which is the full term of the Reynolds OI.v2 sea surface temperature data. As you can see, while the sea surface temperature anomalies are slightly higher than normal (+0.09 deg C) with reference to the base years of 1981 to 2010, there’s nothing unusual about those values. Positive anomalies of that minor magnitude, and anomalies that are much greater, are achieved regularly.
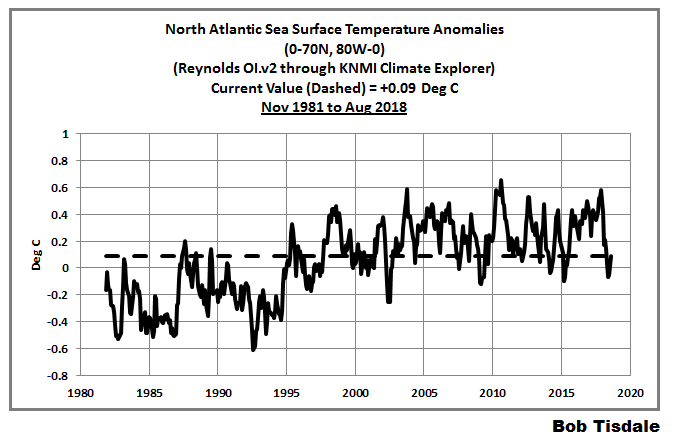
Figure 2
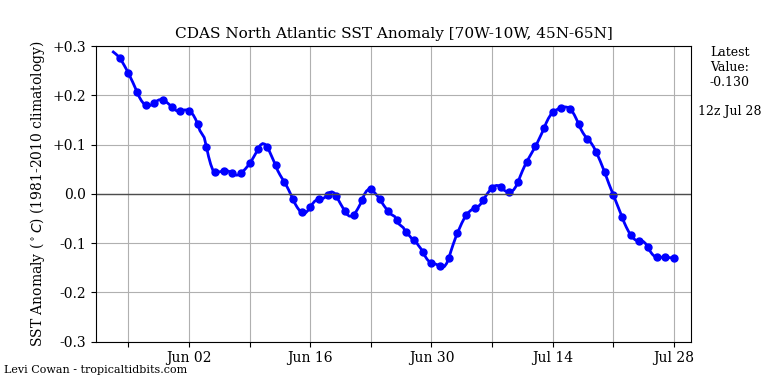
NOTE: To head off a misinforming comment from a troll, the sea surface temperature anomalies above differ from those of the “North Atlantic” at Levi Cowan’s TropicalTidbits. See example of the graph here. Notice the coordinates on the TropicalTidbits graph for the North Atlantic. They’re 45N-65N, 70W-10W. In other words, the TropicalTidbits graph is of the Northern North Atlantic, NOT the entire North Atlantic like I’ve presented in Figure 2. I use 0-70N, 80W-0 for my presentation because those are the coordinates NOAA AOML use for their Atlantic Multidecadal Oscillation data. [End note.]
SEA SURFACE TEMPERATURE DATASET
The sea surface temperature data used in this post is the original (weekly/monthly, 1-deg spatial resolution) version of NOAA’s Optimum Interpolation (OI) Sea Surface Temperature (SST) v2 (aka Reynolds OI.v2). It is available through the KNMI Climate Explorer via their Monthly Observations webpage (Thanks, Geert Jan!).
SEA SURFACE TEMPERATURE ANOMALIES FOR THE HURRICANE DEVELOPMENT REGIONS
Figure 3 shows the sea surface temperature anomaly data for the Main Development Region, a.k.a. MDR, (10N-20N, 80W-20W). The August 2018 MDR sea surface temperature anomaly was -0.23 deg C, slightly lower than normal. Sea surface temperature anomalies of that level occur fairly regularly there.

Figure 3
For the western portion of that region, the sea surface temperature anomalies of the Caribbean (10N-20N, 86W-60W) were slightly elevated for August (+0.08 deg C), as shown in Figure 4, but that’s nothing unusual, considering the volatility there.

Figure 4
A little farther north and closer to U.S. shores, Figure 5 shows that the sea surface temperature anomalies of +0.28 deg C for the Gulf of Mexico (21N-31N, 98W-81W) were also slightly higher than average (the average for 1981 to 2010) in August 2018, which is also not unusual.

Figure 5
And for those interested in the sea surface temperature anomalies along the east coast of the U.S. (24N-40N, 80W-70W), which captures the extratropical portion of Hurricane/Post Tropical Storm Sandy’s track, Figure 6 shows that temperature anomalies for August were elevated there as well (+0.39 deg C), and once again, there’s nothing unusually high about them. In other words, they definitely are NOT unprecedented.

Figure 6
DAILY VALUES
For those looking for more detail—that is, daily sea surface temperature anomaly graphs for the MDR, the Caribbean and the Gulf of Mexico—see Levi Cowan’s Ocean Analysis webpage at TropicalTidbits. There’s a drop-down menu toward the bottom of the page so you can select the graph of daily sea surface temperature anomalies for the region of your choice over what appears to be the last 3 months or so.
ABSOLUTE SEA SURFACE TEMPERATURES
Sea surface temperatures of 26 deg C or higher are considered necessary for the development and sustainability of hurricanes. Unfortunately, the temperature anomalygraphs above don’t tell us what the actual temperatures are. Anomalies are simply the deviation from the normal, where normal is the average for the month in question for a 30-year (or longer) period. I used 1981 to 2010 as the base years for anomalies in the graphs above, which is consistent with NOAA practices for many datasets (other than global temperatures).
Figure 7 is a map of the North Atlantic sea surface temperatures (not anomalies) for August 2018. As illustrated, with the exception of the northeast portion of the Main Development Region (MDR = 10N-20N, 80W-20W), the sea surface temperatures in all of the hurricane development regions are above the 26 deg C threshold. No surprise there.

Figure 7
Figures 8 through 11 are graphs that show (dashed grey lines) the average annual cycles in the sea surface temperatures for the 4 hurricane development regions based on the average monthly sea surface temperatures for the base years of 1981 to 2010. Also shown are the respective 2018 sea surface temperatures (solid lines), and the 26 deg C threshold (dotted horizontal lines). As shown, the sea surface temperatures are well above the 26 deg C threshold in all regions. Whether they stay there will depend on the weather, of course.
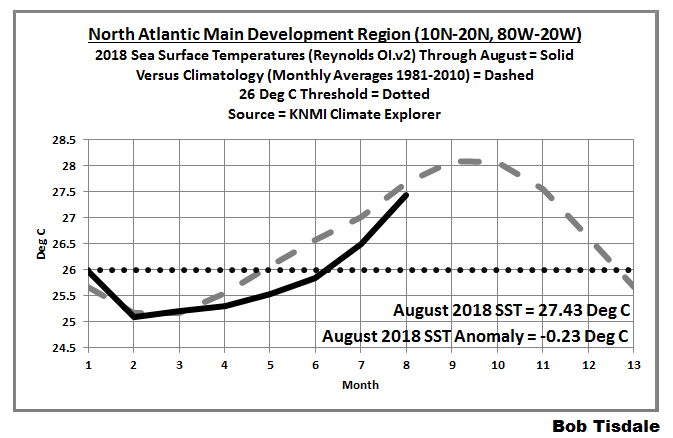
Figure 8
# # #

Figure 9
# # #
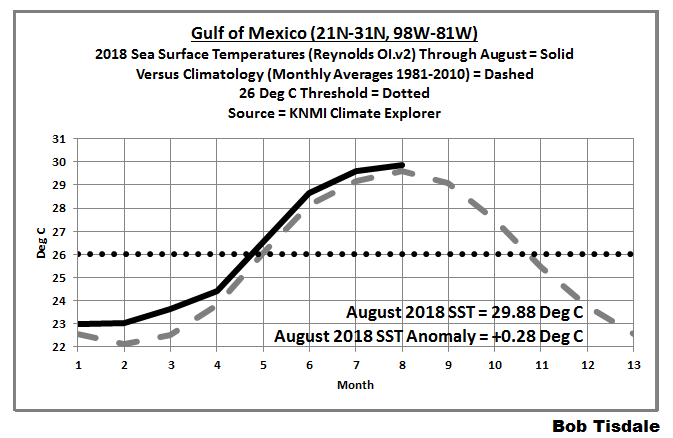
Figure 10
# # #

Figure 11
# # #
Something should be real obvious when looking at the annual cycle of the sea surface temperatures for the Caribbean, where the sea surface temperatures are above the 26 deg C threshold temperature for hurricane development all year long. And that thing that should be really obvious is, conditions other than warm sea surfaces are also required for hurricanes to develop. Otherwise hurricanes would be forming in the Caribbean all year round.
PLEASE BUY MY EBOOKS
As many of you know, this year I’ve published 2 ebooks that are available through Amazon in Kindle format:
To those of you who have purchased them, thank you. For those of you who haven’t, please do.
ANOTHER USE OF THE GRAPHS OF THE ANNUAL CYCLES IN SEA SURFACE TEMPERATURES FOR THE HURRICANE DEVELOPMENT REGIONS
Speaking of Dad, Is Climate Getting Worse in the United States?, in it, I presented graphs of the annual cycles in sea surface temperatures for the hurricane development regions (Main Development Region, Caribbean and Gulf of Mexico) for model-data comparisons. That way we could see that the sea surface temperatures were too cool in the average of the climate models used by the IPCC for their propaganda-necessary projections, and because they were too cool (by as much as 1 deg C), any modeled hurricane seasons would be too short. This was another way to show why climate models need to properly simulate Earth’s absolute temperatures, which we know they do not do. To make things even worse, the temperature differences between models and data were not consistent from region to region, which was yet another way to show that ocean circulation in the models is flawed. These are likely a few of the reasons why specially programmed climate models, NOT the CMIP5 models used for doom-and-gloom projections, are used to study hurricanes in the future.
The primary intent of Dad, Is Climate Getting Worse in the United States? was to present U.S. government-furnished data (readily available online to the public) that show that weather events—hurricanes making landfall on the continental U.S., tornados, drought conditions, floods, wildfire acreage, and heatwaves and cold spells—have NOT become more frequent or extreme for the United States. And to further confirm that climate models are not simulating Earth’s climate, that ebook also includes sea surface temperature (not anomalies) model-data comparisons (for the period of 1982 to 2017) globally and for the Northern and Southern Hemispheres, and for the individual ocean basins (full basin and for their Northern and Southern hemisphere portions). Those graphs are basically updates (through 2017) of many of the graphs shown in the 2016 blog post Climate Models Are Not Simulating Earth’s Climate – Part 2 (WattsUpWithThat cross post is here), excluding the breakdowns of tropics versus extratropics.
CLOSING
That’s it for now.
If Florence or another hurricane makes landfall on the U.S. this season, I suspect I’ll provide a post showing actual sea surface temperature data for the storm track to combat the normal global warming/climate change alarmist bullshite. But for Florence that would have to wait until the September sea surface temperature data are published early in October.
Ciao.
The climate hustlers are already saying Florence might be as bad as 1989 Hurricane Hugo was 29 years ago. Hugo came ashore in South Carolina as a Cat4.
Problem for the Climate hustlers is the “as bad as” part. In September 1989 the MLO CO2 reading was 62 ppm lower at 348 ppm.
Ten minutes ago Weather Nation showed in their video the wind speeds to be 140 mph, while the most I could get on earth.nullschool.net was a high of 80 mph and that was for just 14 minutes ago!
I just looked at Ventusky at the max I could find was 104kph/65mph. Still a powerful storm.
This was yesterday from NOAA’s satellite link:
BULLETIN
Hurricane Florence Advisory Number 45
NWS National Hurricane Center Miami FL AL062018
1100 AM AST Mon Sep 10 2018
…FLORENCE RAPIDLY STRENGTHENS INTO A MAJOR HURRICANE…
SUMMARY OF 1100 AM AST…1500 UTC…INFORMATION
———————————————–
LOCATION…25.0N 60.0W
ABOUT 580 MI…935 KM SSE OF BERMUDA
ABOUT 1240 MI…2000 KM ESE OF CAPE FEAR NORTH CAROLINA
MAXIMUM SUSTAINED WINDS…115 MPH…185 KM/H
PRESENT MOVEMENT…W OR 280 DEGREES AT 13 MPH…20 KM/H
MINIMUM CENTRAL PRESSURE…962 MB…28.41 INCHES
Max winds: 115MPH – try NOAA’s link instead of the amateurs.
Are we going to have a discussion of the winds not being at roughly 140 mph? There is no wind speed conspiracy.
What you see on earth.nullschool.net is snapshot data that is then processed by supercomputers. Don’t mistake it for live, real time data.
I don’t mistake it, but I believe they update the site every four (4) hours.
What was the CO2 level back in 1954?
https://en.wikipedia.org/wiki/Hurricane_Hazel
Probably around 308 ppm in 1954 because it was, to wit:
Mauna Loa Record
1958 3 1958.208 315.71 315.71 314.62
Glad to see you back posting here again Bob. Great work as usual.
Thanks for taking the time and effort to put this up Bob. Interesting and informative as are all your posts. Cheers.
Thank you for the very informative post Bob.
If nullschool.net is correct it will stay on the coastline in more or less the same position for more than 2 day.
http://www.foxnews.com/us/2018/09/11/hurricane-florence-could-strengthen-to-life-threatening-category-5-as-about-1-5m-people-evacuate.html
Thanks for the link Rob. I read this amusing nugget in the article:
Does the AP have the data for SLR in that region? I looked it up for Carolina – it averages out at about 3mm/year. I challenge them to notice that miniscule change. Alarmist nonsense.
https://deq.nc.gov/about/divisions/coastal-management/coastal-management-hot-topics/sea-level-rise
It also doesn’t matter how much SLR has gone up, or down, “due to climate change” when evaluating vulnerability to storm surge. Hugo had storm surge up to 20 feet, and that happened in minutes, not centuries.
That is why God gave us legs (and Hummers). (And plywood, and duct tape…)
Latest ECMWF ensemble suggests it may linger no more than about 12 hours before heading inland
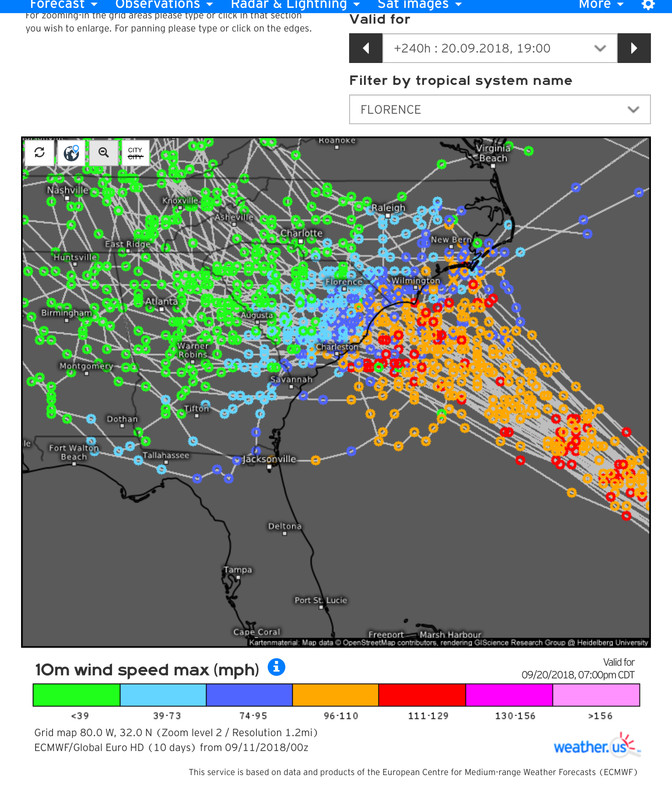
Huge rainfall totals.
The orange indicates forecasted Cat2 at landfall. The Weather channel and the climate hustlers at NOAA no doubt will claim a Cat 4. The key to knowing if they are fudging wind speed and strength will be central pressure. They can’t really fudge that.
NOAAs NHC GFS model is projecting a more northerly track, landing falling square on North Carolina. The Euro ECMWF historically has always performed better at 4 days out than GFS. The ECMWF ensemble (above) suggests a higher probability landfall right on the North-South Carolina stateline. The further south it hits, the faster it will track inland.
Wow, that’s a blind man with darts if i ever saw one.
Bob,
The hurricane is over September waters, not August. SST has increased a lot. Here is an image of SST anomaly (base 1971-2000) on Aug 15 and Sept 6. Sept 6 is a lot warmer. The images come from the facility here which gives daily global maps up to Sept 6, from NOAA’s 1/4 degree AVHRR satellite scans. The nonlinear color scale is shown in the middle.
You can see the last 50 days as a movie here.
Nick, it looks like your up-dated data shows Florence will now be struggling to get through cooler/less-warm water, presuming the two shades of blue are cooler. So let’s see if she gets stronger or weakens, that should be a good proxy. Bob, CNN is already saying Florence is “record-setting”, which sounds like like “unprecedented”. Good luck to the persons living on the east coast, but I will be watching late Thursday to see records being broken, or not.
Good eye, Ron. As of 5AM AST, Florence was at 26N, 64W, well within the blue area. And according to the temperature anomaly scale here…
https://moyhu.blogspot.com/p/blog-page.html
…those blues are negative anomalies.
Thanks again, Ron.
The hurricane may well be responsible for at least some of the blue. It rapidly cools the surface. There are movies showing this here. And here are stills of the cooling induced by Hurricane Harvey:
As I noted in the closing to the post, Nick,
“If Florence or another hurricane makes landfall on the U.S. this season, I suspect I’ll provide a post showing actual sea surface temperature data for the storm track to combat the normal global warming/climate change alarmist bullshite. But for Florence that would have to wait until the September sea surface temperature data are published early in October.”
Bob,
I’m just noting that you don’t need to wait. Daily data is available now.
ps Typo in figure above; the date on the right is Sept 6th, as stated in the text, not 9th.
Thanks, Nick.
PS, Nick. The problem with maps is that you can’t see whether those anomalies are unusual, which is why I present time-series graphs in addition to maps.
Cheers.
I’m back, Nick
Nick, the KNMI Climate Explorer also has NOAA NCEP ¼ deg resolution SST data which is available through September 2018 month to date.
Here’s the current map of North Atlantic SSTa:
And here’s a time series graph of Florence’s track assuming the projections are correct and using the simplistic total coordinates of 15N-35N, 80W-25W:
There’s nothing unusual about the SSTa for the entire storm track.
Why didn’t I use that dataset for the post, you might ask? It’s preliminary monthly data based on daily data, and therefore questionable!
Cheers,
Bob
Bob,
“It’s preliminary monthly data based on daily data, and therefore questionable!”
I’ve been following and plotting the NOAA daily data for over five years now. They post a final version about two weeks after the initial. I’ve never known the final version to differ noticeably.
Thanks for that insight, Nick.
The other 3 solar minimum cycles also show lowered sst temps for the region. Note how sst temps for the other 3 solar minimum periods have steadily gained over the time period of the graph. I wonder if this current downward period will change that trend? That would be a useful clue.
Nick, your charts do not show that the sea temps have increased, just that the anomalies have increased.
Regardless, the areas where the anomalies have increased are not under the current track of Florence.
It is not about SST’s as much as it is about TCHP when it comes to hurricanes. Lack of water temperature to depth is what degraded Irma last year as the shallow Florida bay and made Irma half a cane as the back side had no fuel to sustain its strength.
Start here for TCHP. http://www.aoml.noaa.gov/phod/cyclone/data/intro.html
Irma (half a cane) at 2nd landfall after the Keys.
TCHP from yesterday.
http://www.aoml.noaa.gov/phod/dataphod1/work/HHP/NEW/2018253at.jpg
Please note the methodology for calculating these metrics has changed over time, so historical comparisons should be done carefully.
http://www.aoml.noaa.gov/phod/cyclone/data/method.html
Nick,
Your text says September 6, but the graph says Sept 9. Which is it?
Jim,
As I noted in a following comment, it is Sep 6th.
This looks more like potential record setting to me. Note the surface winds at around 108 mph. The Phillippines are going to get swamped. …https://earth.nullschool.net/#current/wind/surface/level/orthographic=-228.36,14.50,3000/loc=132.522,14.321
Thank you, Anthony.
Cheers,
Bob
As l warned on the weekend open thread on September 1st 12.23pm this storm would move into the western Atlantic and be likely to turn nasty and so would be one to watch.
Am now near 100% certain that it will hit the USA coast and will be near or at its peak when it does so. As it will be fueled by those warm waters and there is very little jet stream activity to take the sting out of the storm. lt did look at one point that the main jet stream further to the north would quickly weaken this storm as it moved north. That is now looking less likely and to make matters worse this storm will be slow moving along the USA coast.
“Sea surface temperature is one of the factors contributing to the development and sustainability of hurricanes.”
1. Yes.
So, imagine if we saw an increase in TSI and the ocean warmed slightly as a result of increasing TSI,
if the ocean warmed slighly, and if SST is one of the factors contributing to the development
and sustainability of hurricanes, then No one would argue againts the notion that the increased warmth caused by the sun
had contributed somewhat to the sustainability of hurricanes. If warmer SST is one of the factors that contributes, then Anything that contributes to SST being warmer contributes in some fashion
to hurrican sustainability.
So if the sun warmed SST a Little…… what would we say to someone who argued that
“there’s nothing unusually high about them. In other words, they definitely are NOT unprecedented.”
Why we would tell the person the the warming doesnt have to be unprecedented for the sun to contribute somewhat to the sustainablity of hurricanes. Unprecedented HAS NOTHING TO WITH the fact that\warmer SSTs contribute. So if the sun warmed SST a little and the slightly warmer SST contributed
somewhat to more sustainable hurricanes, then we would laugh at the person who thought the warming had to be unprecedented for the causal analysis to make sense. If warmer SSTs are a factor, then whatever causes the SST excess warmth (, the sun, GHGs, random variability) is Also a factor.
For the excess warmth to be a factor , it doesnt have to be unprecented it just has to be excessive.
Its pretty simple. Put the cause of the excess warming aside. Regardless of the cause, warmer SSTS, regardless of the level, are A FACTOR. remember……
“”Sea surface temperature is one of the factors contributing to the development and sustainability of hurricanes.”
So whatever causes warmer SSTs is also a factor. There is no requirement that the warmer SST be UNprecedented. any warming, from any cause will do.
“So whatever causes warmer SSTs is also a factor. There is no requirement that the warmer SST be UNprecedented. any warming, from any cause will do.”
Are you suggesting that CO2 warmed SST this year but overlooked warming SST the preceding decade, or that random variability rules the weather?
Mosher
“remember”Sea surface temperature is one of the factors contributing to the development and sustainability of hurricanes.”
You seem to have this interpreted this the wrong, warmist, way.
“Specifically, Elsner and Kang projected that over the past 30 years, storm speeds have increased on average by 1.3 meters per second—or 3 miles per hour—and there were 6.1 fewer storms than there would have been if land and water temperatures had remained constant.”
In other words the more hurricanes that occur the less likely it is that they are due to a warming ocean.
Remember, warmer oceans/ warmer SST cause…….. less hurricanes.
Good try.
fake news.
Worse coming from someone like you and Nick who both know better.
There is no requirement that the warmer SST be UNprecedented. any warming, from any cause will do.
I don’t know who would argue with that. I think Bob’s point is to anticipate the claim that the event is unprecedented, a claim that will be accepted by many in the absence of evidence to the contrary, particularly if the claim is picked up by the major media.
If 26C is sufficiently warm for the development and sustaining of hurricanes, it doesn’t necessarily follow that making water *already that warm* even warmer has any effect, whatever the cause of the “excessive” warmth.
Mosh, how much stronger does a warming of 0.02C make a hurricane?
The real question is what, if anything does co2 have to do with hurricanes. The answer is it reduces the likelihood of tropical storms per https://www.jstage.jst.go.jp/article/sola/1/0/1_0_133/_article/-char/ja/
Mosh, after wading thru that mess, maybe you should just go back to the one/two-line drive-bys.
Mosher, you seem to be grasping at straws so you’ll have something (anything) to argue about. Apparently you have no grasp of what’s gone on so far. The KNMI Climate Explorer also has NOAA NCEP ¼ deg resolution SST data which is available through September 2018 month to date, and the September 2018 SSTa for Florence’s storm track so far is -0.43 deg C.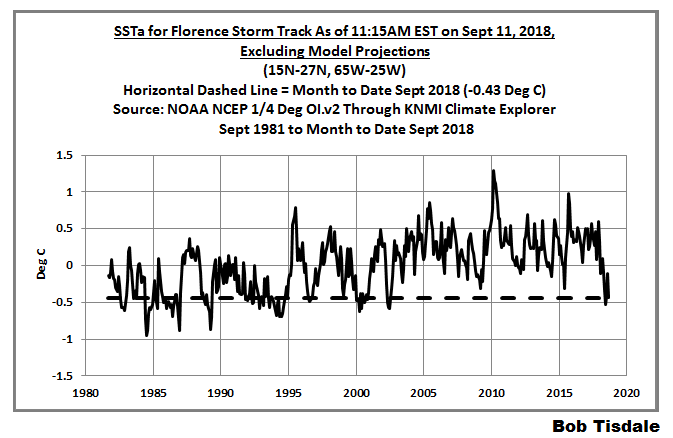
There’s nothing unusual about a negative SSTa of -0.43 deg C either.
You waste my time, Mosher.
Adios
It’s the warm water in the development region in general, not the temperature anomaly. I’m pretty sure someone posted last year showing how strong hurricane seasons and positive temperature anomalies in the development region do not correlate. Upper level windsheer (or lack of) and West African Monsoon are much more influential.
I don’t understand the obsession with anomalies for this purpose. Just as a -95 temperature in the Antarctic does not allow for much ice melt even though it is 5 degrees warmer than normal, a 1degree above normal sst tells us nothing about whether it’s warm enough to sustain a hurricane.
I suggest a scale with 26C as the zero line. It is either warmer than 26C and therefore capable of sustaining a tropical cyclone or it isn’t. If it’s 2C above normal but still below the necessary level to support a hurricane, tell us that…or the opposite.
I think that this is even more important since anomalies vary according to month but a base of 26C does not.
This is something I’d also really like to see. I guess that the “super hot” anomaly off Newfoundland would be extremely unexciting if we looked at a chart of straight-up SST.
Found this page that somewhat confirms my point.
https://www.seatemperature.org/north-america/
btw today’s SSTs:
14C at St John’s NL
17C Portland ME
29C Myrtle Beach SC
“… suspect they’ll use the word unprecedented lots of times….”
Accuweather started using that word on Sunday evening in its headline about the development and approach of Florence.
How a hurricane’s wind speed, which is always high, can be “unprecedented” is beyond me, but the diingbat newsie media have to find a way to get your attention.
Just consider it click bait. Nothing new to see here. Move along.
Something similar happened 60 years ago when Hurricane Hazel hit. So, not unprecedented, despite what the enviro-loons might say.
http://www.foxnews.com/us/2018/09/11/florence-could-hit-with-punch-not-seen-in-more-than-60-years.html
Still, my best wishes and thoughts go out to those who may be hit by Florence. This Summer my wife and I drove across the States from Boston to San Francisco, and every person we met along the way was friendly and welcoming, and the scenery was beyond fantastic. It’s an amazing country full of amazing people.
Re hurricanes and 30 years. Well known with cyclones Southern Hemisphere.
Would be a simple reason.
Number of hurricanes per year, width of path of a cyclone on average means that at a particular latitude there would be a specific percentage chance of being in the zone.
Note to all professional hurricane watchers out there.
Sure it has already been done .
Yeah, but this time to make it more scary, “it might hit 5” They might even invent a new category 6 or 7 to make it more newsworthy.
Bob Tisdale never disappoints. Nice work Bob. One thing one can notice from several of your SST graphs is a “Pause” in temperatures that mimics the GAT one erased by the ridiculous Karlization retirement caper. I’ve noticed this in a a number of other graphs measuring climate phenonena covering partially or all of the globe.
I’ve also seen the the same pattern of warming that occurred in the US with the 1930s- 40s highs elsewhere in both the NH and the SH (South Africa, Paraguay, Ecuador…). We will need all of these and others to rehabilitate much butchered earth temperatures to better approximate what really took place.
Ask yourself if there is any other science that has stood still on its earliest wispy foundations, still quoting Tyndall and Arhenius as authorities, who, having been classic eclectic scientists of the 19th Century, intersected only briefly with CO2 and climate. I guess mediocre practitioners feel good seeing themselves as colleagues of illustrious forebears. Climate science per se is essentially about 50yrs old.
Guy Callendar, a steam engineer, in the 1930s made a calculation on the likely growth in CO2 and its effect and according to a post on Climate Audit (the estimable Steve McIntyre’s blog) his projections remain superior to the consensus’s overblown spaghetti graphs.
Are you sure “stood still” is the correct term? “Gone backwards” seems more appropriate. Right back to the beginning of the 17th century when heretics were burnt at the stake for disagreeing with the consensus.
Unless we can scrutinize SST throughout the Holocene like we do now, we can’t say anything is unprecedented.
I don’t know about the temperatures on the ocean, but the last time North Carolina was hit by an “unprecedented” Cat 4 is Hazel in 1954. The last time South Carolina was hit by an “unprecedented” Cat 4 was Hugo in 1989. Georgia had its last “unprecedented” Cat 4 in 1898.
The difference, which would make this hurricane worse, is that we keep building more and more buildings in coastal flood plains because we like to live next to water.
https://en.wikipedia.org/wiki/List_of_United_States_hurricanes
I live in Raleigh and went through Fran, so I know how devastating a hurricane can be in this area.
Florence is a really odd ball. I’ve never seen a hurricane be so hard to predict. Generally 3 days out all the models converge into a solution that generally pans out, but Florence has each model predicting something different and even their solutions change on every run. Sometimes by a hundred miles.
Even as I write this the storm may linger on the coast for 48 hrs, go north up to around Raleigh, go due west or go south into South Carolina then up into the Smokies. About anything one can take for granted is it is strong storm and will be a game changer for someone.
So at this point we here in Raleigh have to prepare for the worst and hope for the best. Hopefully the populated areas of NC/SC/VA will be spared the worst. The areas inland from the NC/SC coasts are generally sparsely populated so maybe it will blow itself down there before moving farther inland. We can take 15″ of rain if the wind isn’t blowing 70 knots. Put them together and the huge oaks and pines that dominate the area get blown down. When you lose a 150 year old White Oak, they aren’t replaced in your lifetime.
Joe Bastardi had its path pinned over a week ago. He doesn’t rely completely on models, but uses pattern matching from previous storms/conditions in combination w/them. He is correctly critical of simply depending on models alone — climatasterists take notice. Look at his public videos:
http://www.weatherbell.com/premium
To the triggered concern-trolls: Water off the east US coast is warm in mid-Sept. Hurricanes regularly form there almost every hurricane-season & can make land-fall. Deal with it if necessary, but stop blaming people driving cars for it.
For all of the discussion about SST’s, Weatherbell.com determined correctly the course and strength of this storm 10 days ago using pattern recognition and the European model. He has now updated it to a 4/5 at landfall. If I were at the end of that track I would have already boarded up my windows, tied down everything I could, loaded my car with clothing, my computer, and personal photos and effects and headed out in a southwesterly direction. Five hundred miles away should do it.
Bastardi’s current track shows it turning northeast after landfall. This will cause massive rainfall on already flooded rivers and soaked ground. The massive growth in this region since the last hurricane of this magnitude struck will cause damage to be in the billions of dollars range.
I hate to sound like a commercial for that company, but his method does show how lame it is to depend solely on computer models that become useful at 3 days out if you are lucky.
From your description Bastardi’s prediction seems to be somewhat off, has he updated it since?
Bob Tisdale’s storm track graph is utter and complete horse shjt, there’s no way he could even COMPILE that graph today (9-11-2018) when NOAA’s most current released data is 9-9-2018.
Pathetic.
[??? .mod]
GOPedos-Are-31%-Losers says, “Bob Tisdale’s storm track graph is utter and complete horse shjt, there’s no way he could even COMPILE that graph today (9-11-2018) when NOAA’s most current released data is 9-9-2018.
“Pathetic.”
Aren’t you a fool, GOPedos-Are-31%-Losers, calling my graph “horse shit”!!!
Are you sure you have the correct dataset, fool? There are 2 NOAA OI.v2 sea surface temperature datasets. Or don’t you know that? I’ll explain for you, fool. The 1-deg resolution dataset that I used for the post is known as Reynolds OI.v2, which is updated weekly and monthly. The second dataset is the 1/4-deg high-resolution version and that’s updated daily. Daily, if you’re not aware, means every day. I used the high-res dataset for the two graphs in the comments. I even noted the dataset in the respective title blocks.
What’s pathetic is your failure to check the source…
https://climexp.knmi.nl/selectfield_obs2.cgi?id=someone@somewhere
September 2018 SST data are there, fool. Click on that link above, fool. Scroll down to SST and select the dataset described as “1982-now: 1/4° NOAA OI v2 SST”. On the next webpage, you’ll see:
“NOAA High-resolution Blended Analysis: Daily Values using AVHRR only
X axis: whole world in 1440 0.25° steps, first point at 0.13° E, last point at 359.88° E
Y axis: regular grid with 720 0.25° steps, first point at 89.88° S, last point at 89.88° N
Monthly data available from Sep1981 to Sep2018 ( 445 months)”
Fancy that, fool. They have data for “Sep2018”
I plotted what’s there and listed the time and date that I downloaded the data.
Good-bye, TROLL.
PS: Come on back when you want to make a fool of yourself again. But I might not respond to you then because you’re a waist of my time.
PPS
GOPedos-Are-31%-Losers, you sound familiar BTW. You’re so rude and ignorant I suspect you’re Sou from HotWhopper using a pseudonym or one of her clones.
Ok, so that was AWESOME!!! Thanks for all the charts and hard work Bob!!
GOPedos is the only loser here. Just a sad lonely keyboard warrior
the only horsepoop here is the post by gopedos. what an utter moron.
re the knucklehead comments, you were correct, see mosher on the latest hurricane thread. it’s apparently worse than it would have been without the warming.
given where the amo is headed i strongly suspect in the coming years alarmist comments from those involved in creating the global temp series will decline as they will be working overtime trying to come up with new creative ways to “hide the decline”.
nice post bob ,keep up the good work.
mosher, the above was said with my tongue slightly in cheek , no offence intended and i hope none taken 🙂
“given where the amo is headed i strongly suspect”
Given that there was a downturn in GMST smack in the middle of an AMO +ve phase in the 40’s/50’s it is not the AMO that has greatest NV on climate.

[Several of your abbreviations are often used, but NV stands for what? .mod]
i suspect nv means natural variation ? you may well be correct. the good thing is we will find out in the near future. it doesn’t have to have the greatest effect on global temp natural variation, just the part of the globe where most measurements are taken, the northern hemisphere.
He automatically assumed that such were your thoughts. Says something about nim, imo. Was going to comment to A.B. along those lines till reading your reply. Plus we should all know ny now that CO2 rules supreme in all matters climatic.
Here it comes, “Worst Storm Evah.” from Zero Hedge.
“Worst Storm In US History” Florence Set To Break All-Time Records; Forecasters Fear Harvey Flood Redux
https://www.zerohedge.com/news/2018-09-11/florence-may-break-all-time-records-trump-predicts-among-worst-us-history
Jusr read this post for the second time. This time around the graph depicting the North Atlantic anoms struck me as having correlation with something else. Then I realized that it strongly follows the MEI/ENSO regions from one end to the other. The intriguing part is that the ENSO can clearly be seen, but there is also a second imprint from another source. Haven’t figured out what that is just yet.