Global Temperature Report: August 2018
Global climate trend since Dec. 1 1978: +0.13 C per decade

August Temperatures (preliminary)
Global composite temp.: +0.19 C (+0.34 °F) above seasonal average
Northern Hemisphere.: +0.21 C (+0.38°F) above seasonal average
Southern Hemisphere.: +0.16 C (+0.29 °F) above seasonal average
Tropics.: +0.12 C (+0.22 °F) above seasonal average
July Temperatures (final)
Global composite temp.: +0.32 C (+0.58 °F) above seasonal average
Northern Hemisphere.: +0.42 C (+0.76°F) above seasonal average
Southern Hemisphere.: +0.21 C (+0.38 °F) above seasonal average
Tropics.: +0.29 C (+0.52 °F) above seasonal average
Notes on data released September 6, 2018
The seasonally-adjusted global average temperature fell slightly to +0.19 °C (+0.34 °F) as nearly all regions of the globe cooled relative to their July readings. For the first 8 months of the 2018 calendar year, the atmosphere is averaging a departure from average of +0.23 °C (+0.41 °F) which is cooler than observed since 2014 when the annual average was +0.18 °C (+0.32 °F).

The coolest seasonally adjusted temperature was found in the far southeastern Pacific Ocean at -3.42 °C (-6.16 °F) below average. The warmest spot was near Dome Fuji in East Antarctica at +3.91 °C (+7.04 °F). The tropics as a whole show virtually no noticeable departures from average. Especially warm areas occurred in the Gulf of Alaska, Canadian
Maritime Provinces, Eastern Europe, northern China, far South Atlantic and East Antarctica. Cooler than average regions covered Arctic Canada, Iceland, Sea of Okhotsk and parts of the far southern oceans.
While the outlook for a developing warm El Niño is still “favorable” according to NOAA (3 Sep 2018), the Pacific sea surface temperatures are giving mixed signals, being very warm north of the equator, but cooler than average south of the equator. The deeper ocean heat content down to 300 m is above average in the Pacific so provides evidence still
pointing toward warmer (El Niño) conditions in the coming months. If this occurred it would be followed by warmer atmospheric temperatures a few months later. We will monitor developments of this unusual situation.
As part of an ongoing joint project between UAH, NOAA and NASA, Christy and Dr. Roy Spencer, an ESSC principal scientist, use data gathered by advanced microwave sounding units on NOAA and NASA satellites to get accurate temperature readings for almost all regions of the Earth. This includes remote desert, ocean and rain forest areas where
reliable climate data are not otherwise available. They are assisted by Dr. W. Daniel Braswell and Robert Junod in the generation of these products.
The satellite-based instruments measure the temperature of the atmosphere from the surface up to an altitude of about eight kilometers above sea level. Once the monthly temperature data are collected and processed, they are placed in a “public” computer file for immediate access by atmospheric scientists in the U.S. and abroad.
The complete version 6 lower troposphere dataset is available here:
http://www.nsstc.uah.edu/data/msu/v6.0/tlt/uahncdc_lt_6.0.txt
Archived color maps of local temperature anomalies are available on-line at:
http://nsstc.uah.edu/climate/
Neither Christy nor Spencer receives any research support or funding from oil, coal or industrial companies orrganizations, or from any private or special interest groups. All of their climate research funding comes from federal and state grants or contracts.
— 30 —
NOTE: about an hour after publication here, Dr. John Christy wrote in with some corrections to the data from their press release. The data for July temperatures has been changed to reflect this correction as well as the number in the headline, from .31 to .32 and the Northern and Southern hemispheric temps have been corrected also. – Anthony
And it cooled half a degree from 1940 to 1975 (Pre-fudged)
..and it exactly matches the AMO
http://oi60.tinypic.com/1zqty55.jpg
your link works for me latitude, but there is no image there. i agree regarding the amo. the next ten years should be interesting.
Yep
Just curious if the geological or climatologic definitions of hemisphere actually mean half of a sphere. If so aren’t half of the ‘tropics’ in either hemisphere. I was a bit confused as to how both hemispheres could be below average of the entire globe. I surmised you meant north of the Tropic of Cancer and south of the Tropic of Capricorn when you refer to ‘hemispheres’.
hemispheres start at the equator. Tropics are 20N-20S.
I think his point/question is why when you average the NH and SH do you not get the global composite temperature, or something close to it like +0.125C instead of +0.19C as listed.
Global composite temp.: +0.19 C (+0.34 °F) above seasonal average
Northern Hemisphere.: +0.15 C (+0.27°F) above seasonal average
Southern Hemisphere.: +0.10 C (+0.18 °F) above seasonal average
Ah! Someone made a boo-boo on the numbers. The NH and SH numbers are wrong. The correct ones are on my blog:
http://www.drroyspencer.com/2018/09/uah-global-temperature-update-for-august-2018-0-19-deg-c/
Anthony/mods
Please update article with correct numbers.
August Temperatures (preliminary)…
Northern Hemisphere.: +0.21 C above seasonal average
Southern Hemisphere.: +0.16 C above seasonal average
You just made my day…I was getting more and more confused! 🙂
Roy, I have difficulty in believing the big swings in figures for Australia- particularly Jan 2017, July 2017 and Jul 2018. My rainfall figures show that these months had very much below average rainfall. Aug 2018 also had very much below average rainfall and with higher temperatures in the day but lower temperatures at night. Feb 2017 also had very much below average rainfall which resulted in higher daytime temperatures over northern Australia but you reported lower anomalies Could your temperatures get confused between clouds, smoke from bushfires and dust over parched country?
Clouds and smoke will have essentially no effect, unless the clouds are precipitating, which will cause a low bias in the satellite. Remember that these are tropospheric temperatures, so if the lapse rate changes just a little the surface versus deep layer relationship will change. This effect happens most in winter, where high and low pressure centers can change the lapse rate.
Actually 23.5° (N & S) if I recall correctly.
They correspond to Earth’s axial inclination relative to the ecliptic (our orbital plane).
rocketsscientist, replying to Roy Spencer
As far as solar insolation and global circulation goes, that would extend all the way up to about 35 North latitude, 35 south Latitude. The Bermuda High (doldrums) goes about that far before you really begin the classic “Temperate Climates” of regular northwestly storm fronts and true seasons.
RACookPE1978
I don’t know exactly what you are trying to say, but Rocketscientist is right.. The Tropics of Cancer and Capricorn correspond to the limits of where the sun can be directly overhead, which of course affects the energy of insolation. Outside this band, the sun’s “rays” are always at a slant, so fewer hit a given area.
The tropical equivalent zones (areas where the yearly solar insolation received are within 5%) continue well past the latitudes where “the sun is directly overhead one day a year” limits you just mentioned.
RACookPE1978
I don’t see how they can be considered equivalent when the amount and seasonality of precipitation, and consequently the biomes change once you get out of the tropics. Of course, the lines are not exact, and there are arid areas within the tropics, but by and large things like tropical rainforest are confined to that band. Even where forest is contiguous you get a change in species composition. Florida, for instance, is subtropical, and doesn’t support forest with the same characteristics as tropical forest.
The climatic equator is the ITCZ that does not coincide with the geographic equator. I understand that is better to use the geographic equator for simplicity and consistency, but one has to be aware of the factors that affect the interpretation.
Javier,
I don’t understand your comment. There is “equatorial climate” which extends beyond the actual line of the equator, but to call that whole zone an “equator” really does just confuse things. Easier just to call it the tropics, which extend 23.5 N to S, as rocketscientist said. I don’t understand the 20N-20S, either. It’s not as if actual climate strictly obeyed lines of latitude.
The only global temperature data set that both sides trust
Alan,
Warmunistas disparage it as often as they can, claiming it has more adjustments than “surface data” sets, for instance, without distinguishing between warranted and unwarranted “adjustments”.
They also skip over all the infilling the surface set has, that is needed to account for most of the planet that doesn’t have sensors.
well then how can that be considered credible in any respect?
sounds like sophistry to me
Bingo!
Ok, well, I consider adjusting raw data suspect. What is the difference between warranted and unwarranted?
Is there something a lay people like myself would be able to digest?
“What is the difference between warranted and unwarranted?”
Adjusting down is warranted. Adjusting up is unwarranted.
Forgot the /sarc tag, Nick (or did you??). I put “warranted” under the rubric of globally consistent operations on all the data, i.e. uniformly measured and applied. In contrast, “unwarranted” might include randomly infilling random station dropouts without considering the accuracy or precision or climatic location of the remaining stations, or periodically adjusting historical data on top of previous adjustments of historical data, not to mention conflating engine intakes, buckets and buoys. But that’s just me…
Taylor,
““unwarranted” might include randomly infilling random station dropouts without considering the accuracy or precision or climatic location of the remaining stations”
That’s probably why it’s not done.
“periodically adjusting historical data on top of previous adjustments of historical data, not to mention conflating engine intakes, buckets and buoys. But that’s just me”
So if errors were found where adjustments had already been made, you wouldn’t correct them? And who has conflated engine intakes, buckets and buoys?
Lowering the past the raise the future is frowned upon.
Not by alarmists.
It really is sad the way these alarmists have to lie about what others believe.
We’ve known for years that they can’t deal with reality, but it’s becoming more obvious by the year.
Nick Stokes finally admits the fudging of the figures and the remedy
–
“What is the difference between warranted and unwarranted?”
Adjusting down is [now] warranted. Adjusting up is [was] unwarranted.
Thanks , Nick
When it’s really 3….and you start at 10…adjust it down by 2…end up with 8
..you can claim it’s adjusted down
Sorta like adjusting down 1/2 degree for UHI…………
And like adjusting the oceans up because they no longer agree with the cooked to a crisp land station “data”, as admitted by Phil Jones.
what about down in the past and up in the present nick ? global temp series are all a ships bucket of doodoo.
Welcome Mr Stokes, & all your warmista friends, to the Holocene Inter-Glacial! Sadly it isn’t as warm as the previous four Inter-Glacials dating back half a million years, but we’re getting there, as long as Sol doesn’t indulge in one of its usual shut-down tricks, like the one it is likely or has already entered! 😉
It is actually a bit warmer than the second interglacial back, MIS 7, though colder than MIS 5,11 and (probably) 9.
And if Antarctica happens to be gaining ice, then change the isostatic adjustment to make it lose ice and then claim it is “losing ice three times faster than we thought”… even though we know the measurement uncertainty is much better than any ice mass change.
I can give this one a try, others might add their favorite examples.
Warranted:
Satellites have orbits which drift over time. This drift causes a continuous shift in the recorded data stream. The drift is carefully measured and so well known. Also, the data stream has a mathematical relationship to the drift. This provides an opportunity to back-calculate out the effects of the orbital drift.
Unwarranted:
Thomas Karl and the “Pause-Busters” paper.
Highly accurate, state-of-the-art ARGO ocean temperature data was “corrected” to conform to much less accurate ship engine cooling water temperature data. It appears for all the world that this was dome because the ship data gave the desired results, while the ARGO data did not. With this little subterfuge in place, they could claim that the results were the product of the advanced ARGO buoys.
Any reasonable person would have corrected the ship data against the more accurate ARGO data, just the opposite of what was done.
Using a poor quality urban station to adjust a high quality rural station.
Several years ago I used to live in a rural setting. On a Saturday evening I would set off in the winter months to fetch my children from their Saturday jobs. The air-con temp dial would read outside temp at say -3°C, by the time I’d got into the city centre 6 miles away, the dial would read something like 1-2°C! This always confirmed to me the UHI effect!
TonyL,
Imagine two trend lines on a graph of time vs. temperature, with the same slope. One stops at a point in time, the other begins at the same point, but they don’t meet. Shifting either line so that they do meet, while keeping the slope of each the same is not going to result in a change of trend in either line whether you move one line up or the other line down. It will, however, affect the overall trend if one considers both original lines at part of the same trend.
So, if the buoys recorded an average 0.25 C lower than the ships, it wouldn’t matter if you moved the buoy trend up to meet the ship data or moved the ship trend down to meet the buoy data – either would correct the error and lead to an overall trend of greater warming. Moving the buoy data up would actually be the conservative thing to do if you were not going to make ongoing adjustments to the data, as the buoy data would keep measuring 0.25C on the cool side.
This is an extremely oversimplified illustration of what is actually done, of course, simply to try to convey an idea. I don’t actually know how it’s done – some statistical algorithm, probably – but this is my way of thinking of it. Those who know more please correct any conceptual errors and elaborate more fully.
(This paper suggests that more attention be paid to potential biases of Argo systems https://www.researchgate.net/publication/228863360_Argo_float_pressure_offset_adjustment_recommendations)
Yes. The criticism of the SST adjustment is totally wrong. First it didn’t involve ARGO at all, but rather surface drifter buoys. But as a trivial matter of arithmetic, it makes no difference to average anomaly whether you adjust the ship readings or the buoys.
The finding was that buoys read 0.12°C lower than ships in the same situation. So they could add 0.12 to the buoy readings to adjust. Suppose they then subtracted 0.12 from all readings, both ship and buoy. What would that do to the anomaly? Absolutely nothing; the same is subtracted from the data and the mean. But it has the exact overall effect of subtracting 0.12 from the ships, and returning buoys to where they were. That is, adjusting the ship data to the buoys. It gives exactly the same anomaly numbers.
Hello Kristi:
I have not seen you comment for a while, so I thought maybe you gave up. Good to see you again.
The big complaint on adjustments is that highly accurate measurements were adjusted by way of very inaccurate measurements.
The ARGO buoys have PRT (Platinum Resistance Thermometers) calibrated to 0.001 degrees.
Clearly, nobody expects that kind of accuracy in something that has been in the ocean for a year or two. But everybody, on both sides of the isle, agree that the ARGO buoys are the most accurate measurement going. (Many people allow a degradation factor of 10x, that means ARGO is trustworthy to 0.01 deg., or maybe 0.05 deg.)
On the other hand, the ship thermometers are good to maybe 1.0 degree. After all, they are there to measure cooling water going into the largest engines ever built. If the cooling water warms, pump up a bit faster, when the cooling water cools, pump a bit slower. That’s it.
Clearly, what goes on in a cargo ship is not science, it is just making the ship go.
A correction for you:
The situation you describe in your first paragraph is correct as far as it goes. But it does not capture the situation.
These corrections change both the intercept of the line, as you observe, and also *the slope* of the line. And that is where trouble comes riding in.
Also:
Some people want to claim that it is all “anomalies” so it does not matter.
Consider:
Not all data is taken at the same time.
Early data gets adjusted *down* by 0.12 deg., but it is “anomalies” so it does not matter.
Later data gets adjusted *up* by 0.12 deg., but it is “anomalies” so it does not matter.
You just created a slope change of 0.24 deg., and it is all good because it is “anomalies”, so it does not change anything.
That is why we call BS on the whole mess.
Tony
“The ARGO buoys have PRT”
Again, that is true, but ARGO are not used for SST. They only come to the surface once every ten days or so. The buoys used for SST are drifters
“You just created a slope change of 0.24 deg.”
The arithmetic here is all muddled. Only part of the data is changed, so it is only a fraction of 0.12° (not 0.24). The point is that if the mix of readings changes from ships to buoys reading 0.12 lower, that creates a spurious slope. The intention is to correct that in the average anomaly overall, so yes, it does change the slope. A point about anomalies though is that it makes absolutely no difference whether you add 0.12 to the buoy readings or subtract 0.12 from the ships. You get exactly the same numerical result.
TonyL,
“These corrections change both the intercept of the line, as you observe, and also *the slope* of the line. And that is where trouble comes riding in.”
Well, yes, that was my point. If part of the slope of the original data taken all together was an artifact of the difference in buoys vs. ships, then there should be a correction whether the result is a greater or smaller slope.
You seem to be confusing accuracy with precision. If buoy measurements degrade over time, I’d think that wouldn’t change the precision reported, but rather the accuracy, resulting in bias.
The slope after adjustments will depend not only on how much each set of data is moved, it will also depend on how long each type of measurement has been made. If you have 100 years of ship data and 15 years of buoy data, the slope after adjustment will be different depending on which set has been adjusted.
(Huh! Found these just now. It’s rather gratifying to read when real scientists affirm my pretty much intuitive ideas.)
“The difference between ship-SST and the
SST measured by drifting buoys and XBT
is larger in the northwest Pacific and northwest
Atlantic oceans. The difference has
month-to-month variation but does not
closely follow the annual cycle in air-sea
difference. So far, we have found little
impact on climate analysis from the difference
by blending the ship-SST with the
automated measurements. Reason for the
small impact is probably that the percentage
and geographic coverage of monthly
mean data from these automated instruments
is still relatively small comparing
(less then thirty percent) to that from ship
observations”
https://www.esrl.noaa.gov/psd/people/quan.xiaowei/PDF/sst.instruments.lengthy.abs.pdf
” As an aside, the decision to adjust buoys up to ERIs or ERIs down to buoys should nominally be trend neutral. Indeed, in their work on HadSST3 Kennedy and colleagues explicitly tested this, and found “no appreciable difference” on trends.”
https://judithcurry.com/2015/11/22/a-buoy-only-sea-surface-temperature-record/
A relative who thinks he knows everything (but is a hard leftist and alarmist who knows little) says Roy S is paid solely by big oil like every other climate sceptic. He practically worships J. Cook.
All you need to know: the game is not over and the alarmists are winning.
Put him onto the NASA figures…which are the same.

Then watch his face.
I did this to a Warmist recently…and they flat out denied the NASA data!
Sweet.
NASA is paid by big oil…… 😉
Y’know, that is actually a statement that, with adjustment, could be considered true. The amounts that big oil pays in the various taxes that they pay is 3 to 5 times the amount of their after tax retained earnings. Then, of course, the federal part of the taxes that are paid by big oil get added to the revenue pool from which NASA is supported.
But then, whadya know, the cost of their taxes of all kinds gets passed on to consumers (taxpayers) at the pump and other locations at which big oil products are purchased and paid for.
That includes any and all income taxes and payroll taxes that are paid on employees earnings since the full amount of the earnings is paid for using money from their revenue streams.
The nastiness of NASA GISS is how they torture the data before the satellites were watching.
The satellites put a limit on how well done they can cook the books. But now that RSS has joined the Borg, that leaves UAH as a lonely bastion of science. And the balloons.
….and buoys
They cooked the balloon data, too. Amazingly, all the adjustments always go the same way.
Lol how, if it supports your narrative, you call it “a lonely bastion of science”. Note the word “lonely”. The correct noun to go with that is “outlier”. Can you say, “cherry-picking”?
Charles – I don’t see the issue. One is measurements on land, one combines land and ocean. They show the same trends, and are remarkably similar considering the area of the oceans.
“Winning”? Neither alarmists nor skeptics will “win”. It’s just like politics. The moderates hold all the cards and in this case will make their final decision based on results. Don’t believe the same media that tried to convince everyone that HRC would win by a landslide and it was appropriate to vote for a winner. Have faith in the average intellect.
Not so sure. The big elephant in the room is the next generation. I watched a panel of adolescents last night on our national broadcaster and they are fully indoctrinated, and just a few years away from voting and moving into teaching roles and bureaucracies. The situation is dire, I fear. Rational grown ups are hopefully still in the majority, but not for much longer unless some serious efforts can be made in the education system to deprogram the young. I feel sorry for them. They have been set up; the world they are creating for themselves will not be the Utopia they think it will be.
It’s the same here in the UK, sadly! In the UK, it is specifically against the law in indoctrinate school children with any kind of propaganda, except AGW of course, that’s compulsory!
I’m pretty sure the teachers make sure to tell the kids how wonderful government and socialism is on a regular basis.
To a liberal, indoctrination is what other people do.
MarkW,
Your being “pretty sure” of something like that, with no evidence to back it up, is itself a nice example of indoctrination. Academia is replete with liberalism, but that doesn’t mean teachers are the same, or there wouldn’t be any controversy about teaching evolution in schools.
Do you think there’s no bias around here, no possibility that people on the fence come here and are indoctrinated into skepticism? How often do you hear a conservative say, “Yeah, I’ve been indoctrinated, too”?
Indoctrination is everywhere, and no one is immune to it. If one gets one’s information solely (or even mostly) from one side or another, it’s bound to affect how one thinks. If one believes the evidence from only one side of an argument and thinks the other side is lying (or unknowingly corrupted) it’s even worse.
Not bad Kristi. It has been my contention that “All-ln” CO2 warming proponents with scientific literacy who come to WUWT are, despite their deep commitment, going to have their views modified. Yes, there are similar innumerate political bandwagoneers on both sides of the question, but there’s an education to be had at this site once you get over crossing lances with the wrong folk.
The thing that makes WUWT the top of the heap in the blogosphere on the subject is the allowing of bitterly opposed views to be freely aired. The site has an open invitation for alarming climate folk to publish here. I for one would love to see what it is that convinces them of the alarm. I would invite you to be devils advocate and query them on it and see what they have to say. So far its models that have been running too hot for 40yrs. It’s something that will descend on us in the indefinite future. Deadlines for saving the planet, Arctic and Antarctic ice, the tropical forests, species (so far, where are the millions of dead bodies? Polar bears seem fine, butterflies are back. ) keep being pushed further and further back. What should we make of this?
Real Climate and virtually all others of it’s kind unfortunately practice heavy censorship. The “proponents” won’t debate (after losing a few classic ones). One can be banned for arguement no matter how polite. If they have the goods, get them out there. As a real education, go and take them on yourself and see how satisfied you are with the responses. It would make an interesting post. These are the sorts of things that changed my mind when I had no reason to not believe the “science”. Anthony Watts and others here used to believe.
Gary,
” So far its models that have been running too hot for 40yrs. It’s something that will descend on us in the indefinite future. ”
Only 40-year-old models could be running too hot for 40 years.
What I find interesting is how much people here focus on the failures in predictions (or what they believe to be failures) and ignore or reject the predictions that are qualitatively if not quantitatively correct. Many also seem to expect the models to be able to predict natural variation that can’t even be predicted over a year in advance, such an ENSO events. As Gavin Schmidt put it, “Models are not right or wrong; they’re always wrong. They’re always approximations. The question you have to ask is whether a model tells you more information than you would have had otherwise. If it does, it’s skillful….
[This is from a TED talk, so there are visual aids. It’s worth a look https://www.ted.com/talks/gavin_schmidt_the_emergent_patterns_of_climate_change/transcript?language=en#t-42622%5D
“The eruption of Mount Pinatubo in 1991 put an enormous amount of aerosols, small particles, into the stratosphere. That changed the radiation balance of the whole planet. There was less energy coming in than there was before, so that cooled the planet, and those red lines and those green lines, those are the differences between what we expected and what actually happened. The models are skillful, not just in the global mean, but also in the regional patterns.
“I could go through a dozen more examples: the skill associated with solar cycles, changing the ozone in the stratosphere; the skill associated with orbital changes over 6,000 years. We can look at that too, and the models are skillful. The models are skillful in response to the ice sheets 20,000 years ago. The models are skillful when it comes to the 20th-century trends over the decades. Models are successful at modeling lake outbursts into the North Atlantic 8,000 years ago. And we can get a good match to the data.”
The problem, as I see it, is that many people don’t consider the limitations of models, of which climate scientists are fully aware. People expect too much accuracy without even taking into consideration the confidence of the predictions, and gleefully pounce when the predictions have not (yet) emerged from the data. This isn’t always because the predictions are wrong; sometimes there’s too much noise to show statistically that a pattern is there; it’s only after many years that the trend can actually be identified.
Climate is extremely complex, and it is to be expected that it will take a long time to understand it – but our understanding is growing.
Another very big problem is that policy and politics are involved, and many people can’t see the science except through the lens of policy. Because a few climate scientists have become vocal policy advocates and the IPCC is partly a policy document, there is an assumption that policy has corrupted the practice of science. Not only that, but all sorts of selfish and political motives have been attributed to scientists, from greed to global socialist conspiracy. I don’t think this is justified.
It doesn’t matter that there are a handful of regular “warmist” contributors to comments here when the articles are entirely on the skeptical side – the opposing view is not nearly strong enough to counteract the bias of the site in general. “Alarmists” are endlessly ridiculed and insulted; assumptions are made not just about their climate science views, but about their intellects, reasoning, motives and indoctrination. Almost no one among the skeptics contradicts such talk as unreasonable or unsupported by evidence. Under such circumstances, there is no reason for censure by the mods or by Anthony apart from comments not to “feed the trolls” – that is enough. It takes guts to persist here in the face of such disrespect and futility. I don’t know why I waste my time.
“These are the sorts of things that changed my mind when I had no reason to not believe the ‘science.’” The fact that you put “science” in quotation marks is illustrative of the disrespect for science that is common here – while simplistic parodies of science (e.g. interpretations of cherry-picked graphs, without any statistical support, caveats, limitations or presentation of alternative ideas) are accepted by many as the real thing and expertise in the field is not valued, but scoffed at.
If the program was by the BBC, the adolescents were probably carted in by their parents from certain wings of Labour (maybe LibDems too). Anyone who watches Question Time will spot this crowd now and again
Sylvia,
People in every generation get more conservative as they age. I wouldn’t give up hope.
Tell him I said I think people like him are paid by Soros to spread lies. 😉
Despite what Nick Stokes has said or any other alarmist has said I repeat :
The UAH satellite temperature data is the only DATA SET THAT BOTH SIDES TRUST. We all know that all the other ones have been tampered with and we can prove it. No one can prove that the UAH data set is flawed. However that is not the reason why fundamentally it is the only temperature data set that both sides trust.
THE REASON IS SIMPLE AND I HAVE SAID THIS BEFORE. THE LOGIC IS SO OVERWHELMING THAT IT STARES US IN THE FACE AND EVERYONE DOESNT REALIZE IT. NOW for the real reason.
If the alarmists are arguing that Roy Spencer and John Christy are purposefully fudging the figures and thus are putting all of humanity at risk by doing so (because of CAGW); then the alarmists would be arguing that John Christy and Roy Spencer know that their data is false and for the sake of winning an argument, they are knowingly committing suicide and are trying to convince the rest of the planet to do nothing which will be a suicidal action according to the alarmists.
This is such an absurd argument that anyone who tried to make it would be laughed out of every court in the world. Nick Stokes tried to tell me that UAH fudges the figures. That proves to me that Nick Stokes is so caught up in his religion of global warming that he has lost all sense of reason or logic. NO ONE CAN POSSIBLY BELIEVE THAT EMINENT SCIENTISTS LIKE SPENCER AND CHRISTY WOULD EVER DO ANYTHING TO PUT ANYBODY AT RISK NOT TO MENTION THE WHOLE PLANET. That idea is so laughable that it proves to me that western civilization needs to have logic courses in grade school. I say that because no one else has brought up this argument.
Note the argument doesnt work the other way. Skeptics can confidently accuse alarmists of lying because when the alarmists lie or fudge the figures they are not putting humanity at risk by doing so. They are making the world poorer if this scam succeeds but they are not hastening CAGW if they get their way. The world comes to an end, only if CAGW is true and only then if we do nothing to prevent it. The alarmists who have enough logic in their brains to somewhat counter the religion that has taken over their brains, implicitly realize this, but few will ever admit it publicly. By not admitting it publicly they are showing to the world that they indeed have no sense of reason or logic. They may in fact have reason and logic, but by not publicly acknowledging what I have said; they are saying to the world, that they aren’t logical. They are in effect saying that their logical “brain” is naked.
The above is the simple logic that proves that the UAH data set is where the global warming final battle will be fought.
This is such a rant. Imagine if the other side wrote such nonsense?
“If the alarmists are arguing that Roy Spencer and John Christy are purposefully fudging the figures ”
I don’t recall anyone saying UAH is fudged, just that it has had its problems.
Alarmists are saying they dont trust it. There were problems. The problems were fixed. If there are still problems why arent the alarmists pointing them out. Spencer and Christy would willingly supply the source code, data methods, and and other information needed to replicate the data.
The alarmists cant argue that satellite datasets are inherently invalid because they rely on RSS which is a satellite dataset.
So if my post was a rant, where was any illogical statement in it? If I was to guess at a %, I would think that most alarmists would publicly dismiss the UAH dataset as being unreliable. They wouldn’t really have a good reason for doing so.
If there arent problems with it why wouldnt the alarmist trust it. If you are saying that they do trust it then you are agreeing with me. We skeptics certainly don’t trust any other data set. Therefore IT IS THE ONLY GLOBAL TEMPERATURE DATASET THAT BOTH SIDES TRUST.
alan, in science i don’t believe trust gets to operate on its own. trust yet verify is the phrase i refer to.
“Alarmists are saying they dont trust it.”
” IT IS THE ONLY GLOBAL TEMPERATURE DATASET THAT BOTH SIDES TRUST.”
A slight contradiction there.
“Spencer and Christy would willingly supply the source code, data methods, and and other information needed to replicate the data. ”
Maybe the position has changed but I seem to remember Spencer saying he wasn’t going to release the source code.
“The alarmists cant argue that satellite datasets are inherently invalid because they rely on RSS which is a satellite dataset. ”
For my own part I don’t consider satellite data to be invalid. I think it’s a very useful additional source. But I do think there are reasons to be cautious about it as with any temperature reconstruction. The fact that both satellite data sets have often disagreed with each other and with previous versions suggest they cannot be that definitive.
“If there arent problems with it why wouldnt the alarmist trust it. If you are saying that they do trust it then you are agreeing with me. We skeptics certainly don’t trust any other data set.”
“trust” can mean lots of things here. I trust scientists, I trust that they aren’t going to fabricate data or let their prejudices influence their results.
That doesn’t mean I “trust” any given data set in that I don’t assume that anyone is 100% correct. All datasets, satellite or surface, rely on inferring a global picture from imperfect data that has to be modeled using assumptions that my prove to be wrong, using calculations that may be flawed.
Bellman, stop being so reasonable. It’s frowned upon.
When one realises, as the UNIPCC & its upper echelons have admitted, that the climate change meme has nothing to do with saving planet Earth for the children, it’s all about setting the scene for the creation & establishment ofa globul guvment run on Socialist lines! Despite all the evidence around the World, including the most recent example of Venezuela, that it doesn’t work, even if one had squillions of dollars at ones desposal, one still cannot fill the shops with food/goods for the people! So they think that doing more of the same that demonstrably doesn’t work, only this time on a really grand scale, it might just work after all! If I keep bashing my head against a 9″ brick wall, eventually it’s going to collapse, isn’t it?
…..”But they have high hopes. High , apple pie up in the sky hopes. Or so sang Frank Sinatra back there in another place and another time when we believed that we lived in a sane world…..But the politicians couldn’t be trusted even then.
“So if my post was a rant, where was any illogical statement in it? ”
Several:
1) “The UAH satellite temperature data is the only DATA SET THAT BOTH SIDES TRUST.”
(in caps mind – so it must be true).
How can that be the case when it is an extreme cold outlier? unless you are motivated to choose a solution that is an outlier? …

Anyone with an even-hand would add all those up and arrive at an average trend.
To take UAH V6 as the “most trusted” is a bizarre statement.
2) “We all know that all the other ones have been tampered with and we can prove it.”

So UAH has not “been tampered with”
Really?
3) “If the alarmists are arguing that Roy Spencer and John Christy are purposefully fudging the figures”
No the followers of consensus science (1.5 to 4.5C per x2CO2 – 4.5 may be alarmist but 1.5C isn’t) are saying that by dint of it being a cold outlier, by the balance of probability it is not correct and that their insistence that the NOAA 15 sensor is correct and that the NOAA 14 one was wrong has introduced an ongoing cold bias to their series that the likes of Mears with RSS has averaged out as they do not know which one was wrong (and one of them was wrong)…

Here is RSS having made a “fudge” between the two sensors (so still wrong – one way or the other).
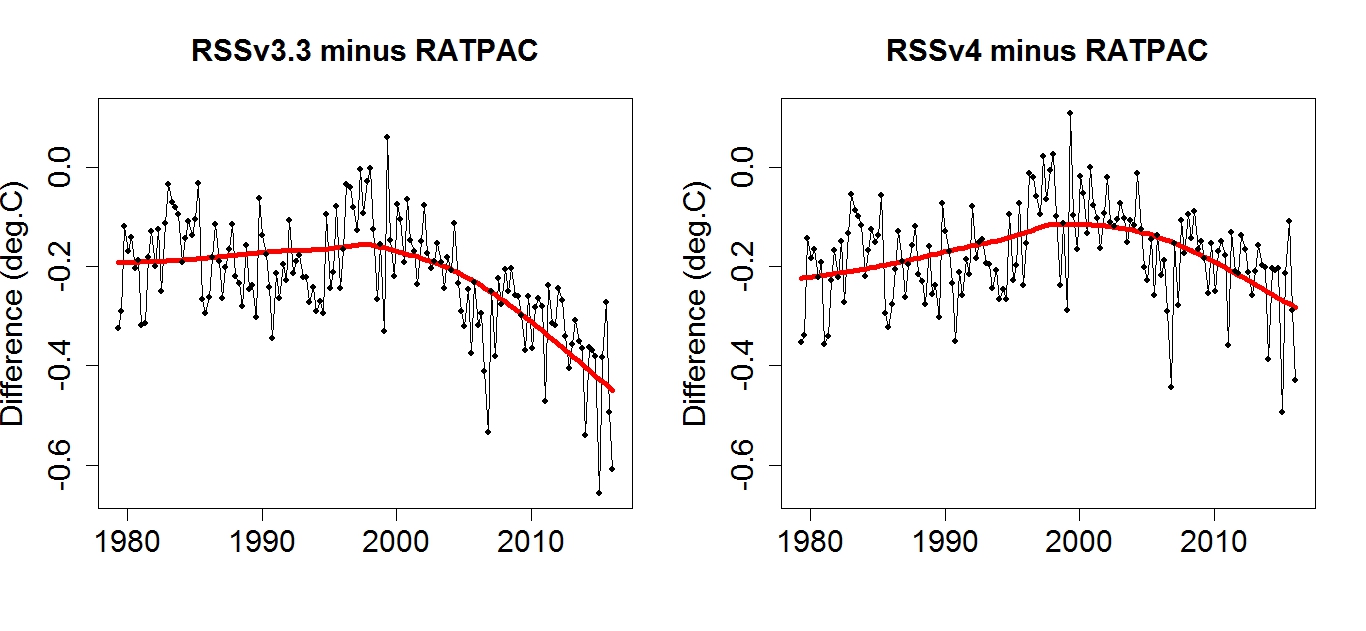
So where is the “proof that UAH has it right” given it is trending cold vs radiosonde?
And this is an example of the “rant”
“That proves to me that Nick Stokes is so caught up in his religion of global warming that he has lost all sense of reason or logic. ”
Try looking at all the data – which is not found on here unless the likes of NS turns up.
As he has and does often to much ridicule as I’m sure this will get also.
It is the denizens of WUWT who have “lost all sense of reason and logic”.
Yes yes….
All climate scientists are incompetent.
(except the ones we choose to like)
All climate scientists are frauds (even the Exxon one).
(except the ones we choose to like)
No the answer, my friend is that they know more than you.
On the other hand, we have the warmista like you who declare that anyone who disagrees with them simply isn’t a scientist. Or that unless it’s published in one of their journals, it isn’t science so must be ignored.
MarkW,
I don’t think you quite got the picture.
“All climate scientists are incompetent.
(except the ones we choose to like)”
Hmmmn.
Is there any evidence any climate scientist is competent – outside of government awards awarded by other government-paid climate scientists?
RACookPE1978
How would you know, and why would you care? You are perfectly ready to assume there aren’t, so what could I possibly say that would make you change your mind?
It’s completely irrelevant to my comment, anyway.
AB, so how is it that when individual radiosondes are compared to satellite data they match the UAH 6 and RSS 3.3 better than RSS 4?
Ratpac is infilled nonsense which only fools people who want to be fooled.
“so how is it “
Well, how is it? Can you support that claim of better matching?
“How can that be the case when it is an extreme cold outlier?”
Yes, the UAH is now the cold outlier. All the others were adjusted warmer. The UAH became the outlier by standing still while the others changed.
” The UAH became the outlier by standing still while the others changed.
“
Just not true. UAH V6 was adjusted radically downward, relative to V5.6, as well as to other measures. Again, here is the plot of the change going from V5.6 to V6 in 2015, in red, compared with changes to GISS between versions of 2005, 2011 and 2015. All shown to the common anomaly base of 1981-2010. UAH V6.0 had a much lower trend than V5.6.
“UAH satellite temperature data is the only DATA SET THAT BOTH SIDES TRUST. ” That’s where I stopped reading. The “sides” only trust the data that makes their side look good.
Hey, you Sceptic! You had your pay cheque yet, still waiting for mine?
Mardler,
There are many who suggest that mainstream climate scientists are corrupted by the need to get grants of any sort, which Spencer obviously does. I do not agree, but I point it out just to show that it’s an irrational way of thinking – why should they alone be condemned just because their research depends on grant money?
Why is it all about “winning”? It’s not a game.
A going-on three-year cooling trend of course is just weather.
Nope it is climate. And to be expected coming off a strong El Nino. But the key thing is it is not as cool as it was after the big 1998 El Nino.
After the 1998 El Nino, there was a record setting La Nina. None so far this time.
In what way was it record setting?
https://www.esrl.noaa.gov/psd/enso/mei/
Bellman, so you admit the 1998-2001 La Nina was far more extensive and stronger than the weak La Nina we saw last winter. As such one would expect more significant cooling.
What is significant is after the La Nina events ended we have returned to almost exactly the same temperature. No warming in nearly 20 years.
Don’t need to admit anything, it’s clear from the data.
The comment I was addressing was the claim that 1998 was record breaking.
“What is significant is after the La Nina events ended we have returned to almost exactly the same temperature. No warming in nearly 20 years.”
Returned to what temperature? Trend since 1998 is 0.75°C / century.
Simon,
I forgot the sarc tag.
Granted, cooling after the 1998 super El Nino soon dropped below the 30-year baseline.
Well, we are still in the Modern Warming Period, so no reason not to expect a slightly higher level above the 1981-2010 baseline two decades later. But the post-Nino cooling is still going on, so let’s wait and see how low it can go.
The WMO estimates a 70% chance of another El Nino. Maybe wishful thinking, or based on some real factors. If they’re right, the cooling might be interrupted, but it’s too soon for another super El Nino.
Nope it’s weather, and so is a three year warming trend.
This is the only true definition of climate.. everything else is speculative bullshit.
1 : a region of the earth having specified climatic conditions ·
…..Yet.
That’s a strawman fallacy. We all agree the surface of the planet has been warming. The key thing is that the warming has not been taking place at the models predicted rate. The obvious conclusion is the consensus is wrong on the effect of CO₂ levels on climate change. We need to re-think how we best deal with CO₂ emissions so the purported cure is not worse than the purported disease.
In this case the “purported disease” is actually the patient getting healthier.
There is that graphic again that shows the CMIPs correctly “forecasting” the 1993 volcano and the 1950-1977 cooling. Amazing.
You are very generous to use HadCRUT4. How does that graph look with UAH6?
I have absolute confidence that they can be defeated with their own rules. Moreover, I believe that is the way to do it.
Correct John
In other words, for all practical purposes:
+++
???
…Robert didn’t come back and explain it….neither one of us knows what he was trying to say
Sure you do, Latitude. You know exactly what I’m trying to say. I say it with two pictures. Pictures are worth …
I’m sure I get what you’re aiming for, but your second graph is devoid of any information as to the “y” scale.
More of us are asking about the “why” scale than the “y” scale …..
Devoid, yes, I agree. I took off the tenths of degree marks and was hoping viewers might see that the realism that I was referring to is more along the lines of whole degrees. It was a sloppy, quick effort, but I think you know what I mean. Images, like words, can have implications of “read between the lines”. In other words, no information there makes about as much sense as tenths of degrees. The overriding aim was to mock the seemingly varying picture caused by tiny gradations with a picture that more closely represents the feel of reality. Humans do not feel temperature reality in tenths of a degree or hundredths of a degree.
Nick S, how is less than a degree anomaly worth all the fuss statistical masters such as yourself go to describe and illustrate?
Even if every location on Earth rose by one degree, would this be cause for alarm? And even if one region showed a larger increase compared to another, in such a way that some locations rose by no degrees, some by 3 degrees, some by minus two degrees, wouldn’t the anomaly just smear out what are really REGIONAL phenomena and NOT a GLOBAL phenomenon? I’m still not convinced that that hundredths of a degree is a meaningful, real world measure — it’s a statistical data measure separated from the real world where the actual data was collected.
Maybe this will help:
Robert
For relevance and perspective the Y axis should cover the complete temperature range of the glacial – inter glacial cycle variation. This is earths recent and historical temperature variation. The current movement is extremely stable.
Regards
“complete temperature range of the glacial” — okay, I can look that up, I guess.
But, to be lazy, what might you suggest that range is? Thanks.
Maybe something more like this?
If yes, then basically what I intuited with my sloppy first-attempt straight black line.
Year 2018 is going in the correct direction which is downwards. As I have said I think this is the transitional year and will be very surprised if this lower trend does not only continue for the rest of this year but for several years to come.
If the global trend in temperatures should go up now- over the next few years I will throw in the towel that is how sure I am.
So far so good and two big indicators to watch are overall oceanic sea surface temperatures and major geological activity. So far these moving in the direction I have been expecting.
It is early and the next 6 months should be very telling . This is not some meaningless way off future scenario but now.
Salvatore Del Prete You wrote “so far so good”.
It is not good. Though I do not care for French wines I don’t want their grape crop hammered like the last three years. Nor Germany or Italy.
Canada had a early frost last week that damaged the soybean crop in Saskatchewan.
We don’t need it getting colder the consequences are grim.
michael
We don’t really grow a lot of soybeans in Saskatchewan and an early September frost is pretty much guaranteed here, while a late August frost is about every second year. It is currently pretty dry but overall, crops are quite good.
A little warmer would be good.
I agree not cold enough yet. Not that worried about El NINO interrupting the cooling trend , due to two factors. First overall oceanic sea surface temperatures are cooling and secondly it looks like the North Atlantic is going to be growing colder which should off set El NINO effects especially if it is weak which is very likely if it comes.
Salvatore says:
“I will throw in the towel that is how sure I am.”
OK, be sure to be prepared properly.
This should help.
https://www.bedbathandbeyond.com/store/category/bath/bath-towels-rugs/bath-towels/13434/
The graphics show a continuing plateau, starting at the 2004 level, see
the page :”Norman Page” or, with different conclusions at
http://www.knowledgminer.eu/climate-papers.html, the PART 8
(1600 AD to 2050 AD) Climate Patterns…. The plateau level lies
0.25°C above the shown UAH level line. The temps reached plateau level,
during the temp increase period 1980-2004, and will remain plateau
there – discounting ups and downs (caused by El Nino/Nina and minor
solar activity change) until 2040 AD.
Details see in mentioned literature. JS.
Maybe I’m the only one…but, I want a warmer world. I hate the cold and Denver sure has a ton of it.
Not me, I want the world to be at normal temperature (whatever that is).
Doesn’t “typical” say it better than “normal” or “average,” whatever that means
As one warmista told me: “Normal is the climate I remember from my childhood.”
Indeed. I want a warmer world. Life thrives in a warmer world. Life dies in a colder world. Warmer is better.
Unfortunately the only thing that will kill off the AGW religion now is a sustained and undeniable period of below average temperatures. The fanatics have gone well beyond appeals to reason and debate.
The cold spell would have to last until its Archdruid Michael Mann retires for the religion to be found false by consensus.
Does it really matter that they may believe it forever….Unless they happen to be right?
Unfortunately the only thing that will kill off the AGW religion now is a sustained and undeniable period of below average temperatures.
Nah, they’ll just switch back to dire warnings of the coming Ice Age and insisting they’ve been predicting it all along. Facts and history mean nothing to them.
Why no discussion of the now permanent cold SST anomaly all around Antarctica. Antarctica is leading glacial inception.
Do not understand how the Antarctic ice extent is plateauing below normal at the moment if this is the case. In some years there has been an anomalous jump at this time of the year but that is the trouble with anomalies they by definition should not be expected to recur. Sigh.
Could someone provide an answer to this question:
What is the temperature anomaly of the globe without the area North of 60 N included?
In other words, what portion of the global temperature increase that has been observed since 1975 is due to the increase North of 60N?
You can do that calc with UAH data since 1979. Global trend, they say, is 0.13C/decade. Trend N of 60N (NoPol) is 0.23, and that is 1/6 of total area. So trend of the rest is
(0.13*6-0.23)/5 = 0.11 °C/decade.
I thought both poles were warming at above average rates. Don’t you have to account for the area from 60S to the south pole?
I did the calculation as requested; you can extend to S Pol. But in UAH, SoPol warms at only 0.08°C/dec, so excluding that will uptrend the remainder.
@Nick Stokes
So, the upshot is that for this “well-mixed” green house gas, the results are not at all uniform. So much for “global” warming. It’s almost as if…as if…natural processes were more important! Nah, can’t be. /sarc
Boo-Hoo, the full data at the link set is not updated yet.
Here is my take:
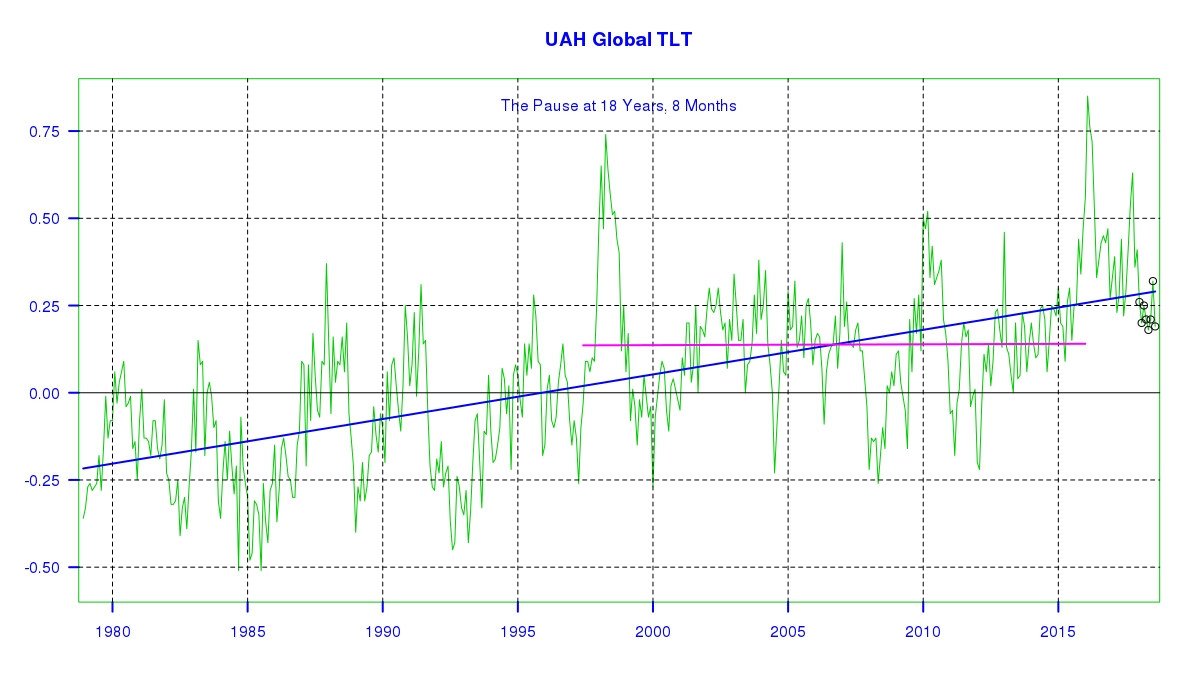
(click to embiggen)
The one thing that really jumps out at me is that 2018 so far is a whole lot of nothing. I have marked the 2018 data with black circles so we can see them. What is striking is that these 8 points form such a tight cluster. This cluster is by far the tightest and longest lasting such grouping in the entire record.
What does it mean?
Probably nothing. For now it is just a curiosity or a statistical fluke in the data. I won’t try to read any meaning into it.
Nonetheless, I have been waiting for cooling all year, and it has not happened. After such a large and long El Nino, I expected things to cool to at least below the level of “The Pause” (+0.138), and maybe even as low as the baseline 0.00 .
So far, the temps just keep hanging up there.
And this is why my predictions only inspire peals of laughter, hoots of derision, and much mirth and merriment from the WUTW gallery.
(But that is a story for another day.)
https://imgur.com/Od0lDU0
Cooling has been taking place and this year is running colder then year 2017, and especially overall oceanic sea surface temperatures down almost .2c from a year earlier.
” overall oceanic sea surface temperatures down almost .2c from a year earlier”
Not at all. In fact, August was the warmest SST month since last November, and about 0.03°C less than September.
If one looked at this graph during last summer overall oceanic temperatures were north of +.30c
Overall oceanic sea surface temperatures are down .2c from last summer, according
to ocean tid bits. Last summer overall oceanic sea surface temperatures were +.35 c above 1981-2010 means today between +.10c to +.20c above 1981-2010 means.
Nick you can’t accept data that runs counter to AGW theory which does not exist to begin with. All the warming last century was natural and that will be proven from now- over the next few years as the temperature trends continue down.
Nick nothing goes down in a straight line and the overall down trend is well intact.
Heat in the tropics and near tropics drives the world temperature. If we are to have a pause the anomaly will need to stabilize at a the same average anomaly as what was occurring during the pause after an initial fall under that to bring it down to that level. Needs a La Nina phenomenon to bring it down [25% chance currently].
Any long term change is likely to be excruciatingly slow [just because].
That does not rule out a quicker 30 year sustained drop just like we had a sustained rise before the pause.
“Nonetheless, I have been waiting for cooling all year, and it has not happened”
Fatuous comment.
You claim to have been looking at El Nino in which case you would have observed that a strong La Nina did not occur hence you have no grounds, on observations you should have made, to have any such expectations.
Scientifically a slight inconsequential warming in GST is to be expected with extra CO2 in the world if there are no large confounding negative cloud feedbacks.
This will underpin a natural variation that is quite capable of a 2C top to bottom variation in GST over 60 year time frames.
We desperately need a shift down in the natural variation to take the wind out of a false narrative. This could happen in 2 , 60 or 240 years to go for the usual 2SD scenarios.
Impetus stalled at moment, let us hope for more clouds and a La Nina.
TonyL: The problem is you placed the red plateau line too low. It must be placed
somewhat higher at 0.25 C above baseline and the blue line should join the red
line in 2004 at 0.25 C ….. and you get the numbers right….
see also my comment with details further up…..
The red line is not a plateau line.
It is The Pause, length as shown, and it has a fixed value of +0.138.
“the blue line should join the red line in 2004”
The blue line is your garden variety LLS line. The slope and intercept are properly calculated, and it is where it is.
I see up above, you mentioned Norman Page. On a couple of occasions, I have overlaid his prediction curve on a current UAH plot and put up the result here. I find his work interesting, but his prediction of a pronounced cooling from 2008 forward is not looking to good at this point.
Cooling started in 2017 with the overall oceanic sea surface temperatures which are down almost .2c since last summer.
Same fallacy as the alarmists? Pick the high point and say anything less represents a cooling trend?
Sorry, but I don’t buy that just yet.
You have not been paying attention. The cooling has actually accelerated in 2018 in surface temperature data. From late August, the global average temperature has reached levels not seen since November 2014.
Graph courtesy of https://oz4caster.wordpress.com/cfsr/
What is not believable is that over two and a half years there is still heat released by the 2015-16 El Niño still lingering in the system. All the heat that went to the atmosphere either left to space or went into other parts of the system. The current cooling is unexplained.
For this month Canada and northern Russia are looking like the prime targets for below average temps in the NH.
Yup, it’s been damn cool here for at least a week in the Edmonton AB area. Even had a light frost about three or four nights ago.
The use of temperature anomalies assumes that the seasonal cycle does not change but i found that it does. Please take a look. Your comments appreciated.
https://tambonthongchai.com/2018/08/17/trendprofile/
CAGW’s bogus CMIP5’s 102 model average predicted the global temp anomaly would be almost 1.2C by August 2018, when actual UAH observations show just 0.19C (six times devoid from reality)…
The current El Nino looks like it will be a El Nada event, and will likely be followed by a strong La Nina event from 2021/22 (the last strong La Nina was 2010/11 and they historically occur every 10 years or so).
Because the PDO, AMO and NAO will all likely be in (or close to entering) their respective 30-year cool cycles from around 2021, global temp anomaly trends will start to fall when this occurs as they’ve always done since 1880..
Moreover, from 2021, a 50-year Grand Solar Minimum will occur, which will likely add to the PDO/AMO/NAO ocean-cycle cooling.
By the end of Trump’s presidency in 2024, I wouldn’t be at all surprised to see a falling temp trend developed from mid-1996~end 2024…
If that should occur, CAGW will have to be disconfirmed given the huge disparity (greater than 3 standard deviations) and duration (28 years) between CAGW’s hilarious projections vs. observations…
We’re definitely at the beginning of the end of this ridiculous CAGW ho@x.
ENSO imperfectly follows the solar cycle, so strong La Niña events tend to happen in the rapid ascent of solar activity following a solar minimum. So your prediction of a La Niña for 2021/22 is correct.
A shift to El Niño usually takes place at the solar minimum. In my article here at WUWT I showed that the solar minimum is projected to take place by several methods in the first half of 2019 (Feb 2019 is my prediction). We should have an El Niño by the summer of 2019. Conditions do not favor a strong El Niño, so we will probably have a regular to mild El Niño, followed by a strong La Niña.
Probability of that pattern being due to chance is lower than 1 in 4000. ENSO is under solar control.
Your prediction of a Solar Grand Minimum, however, doesn’t look good. We are in a centennial low in solar activity, and it should be over by 2035 when high levels of solar activity are expected for SC26.
Never seen your first figure before, so can’t comment on its veracity. Your second one, however is no better than any of the IPCC garbage. Pure random speculation based on a model of unknown and extremely imperfectly understood processes.
Sorry, but I give your speculations no more credibility than any other computer models of the future – viz. none.
Why? You can check it by yourself in 5 minutes. It demonstrates that ENSO is under solar control, and since that goes against dogma that solar variability has little effect on climate, a lot of people would be extremely happy to prove me wrong. Go ahead. Give it a try. Unless you just like parroting other people’s position instead of checking things by yourself.
And your opinion matters to somebody else because…
That model is an extrapolation of the recorded cyclical behavior of the Sun from decadal to millennial time scales in solar proxies. Some variability is expected, but the model will be essentially correct if the Sun keeps doing what it has been doing, and incorrect if it does not. Very simple.
Spectral forecast of solar activity has a long history, but to reach its full potential a better understanding of solar cyclical behavior is needed. My take is better than previous ones because I have read them and learnt from their mistakes. Time will be its ultimate test.
Meanwhile SC25 should create serious doubts among believers that we are entering a Solar Grand Minimum.
SAMURAI – Im in agreement with you 100%.
This year is the transitional year in response not only to low solar conditions but also a weakening geo magnetic field. In year 2005 solar activity switched from a warming mode to a cooling mode.
Look at overall oceanic sea surface temperatures now off .2c more or less from a year ago. Less UV light lower overall oceanic sea surface temperatures.
Look at the geological activity up over 30% in the last month for magnitude earthquakes 4.0 or higher.
Watch for a major explosive volcanic eruption in the not to distant future. More cooling.
Watch for global cloud cverage to be on the increase and greater snow coverage all which will contributle to a slightly higher albedo cooler global temperatures.
Weakening solar/geo magnetic fields equate to all of the above.
In addition we have the NAO/PDO/AMO moving into a cool phase, as you mentioned.
“We’re definitely at the beginning of the end of this ridiculous CAGW ho@x.”
Lot of people going back a long time involved in that then.
But I suppose no dafter than those necessary to ideate “we never landed on the moon” conspiracy.
Anyone with a modicum of common sense and all that.
So is your bet on the chinese as the current illustrious POTUS reckons?
If the variation in temperature locales, is in the order of +7 degrees C, then the so called worldwide ‘average’ temperature is somewhat meaningless, especially at less than 0.2 degrees C. And, for what its worth, what is the error bar?
“uncertainty for this product�s trend calculation (+/- 0.040 C/decade).” From Roy Spencer’s site referring to the LT trend calculations. “The new LT trend of +0.114 C/decade (1979-2014)” referring to beta of version 6.0. In other words, between +0.64 and 1.54 C/century. so far indicating a low CO2 sensitivity.
Re-arranging these cool anomalies to New England and northern Europe in time for winter will be fun to watch. Crank up the excuse engines to explain cold with AGW.
For the first 8 months of the 2018 calendar year, the atmosphere is averaging a departure from average of +0.23 °C (+0.41 °F) which is cooler than observed since 2014 when the annual average was +0.18 °C (+0.32 °F).
Can someone explain why +0.23 C is cooler than +0.18 C???? or are the numbers switched around?
This year is the beginning of the end for AGW.
All of this is very interesting..temps go up they go down, life goes on…what I find humorous if not somewhat frightening is the levels to which the media will go to put the fear of God into people..take this link for instance, https://www.nytimes.com/interactive/2018/08/30/climate/how-much-hotter-is-your-hometown.html Yes I know it’s the NYT times one of the most reputable of all the newspapers(insert sarcasm), but you can see how someone plugging in their date of birth and then looking at the future predicted temp models could come to the conclusion we’re all going to burn up.
This is the lead in..
“As the world warms because of human-induced climate change, most of us can expect to see more days when temperatures hit 90 degrees Fahrenheit (32 degrees Celsius) or higher.”
we don’t know what modelling they used for future temperature forecasting, but of course whatever happens must be “human induced”..
I find it sad how gullible people can be..