By Andy May
In Part A of the Great Debate series (see here) we discussed Dr. David Karoly’s and Dr. William Happer’s arguments regarding how unusual recent global warming is and how we know the recent observed increase in CO2 is due to human activities. In Part B we examined their thoughts on questions three and four. Number 3 is “How do we know that the increase in CO2 and other greenhouse gases in the atmosphere have caused most of the recent global warming?” Number 4 is “Climate models have been used to compute the amount of warming caused by human activities, how accurate are they?”
For an introduction to the debate and links to the original documents see Part A. In Part C we will examine the predictions that global warming and more CO2 are dangerous and that we (as a global society) need to do something about it.
5. How do we know global warming and more CO2 will have substantial adverse impacts on humans and the planet?
Karoly writes that we are already seeing adverse impacts from global warming and that these will continue in the future.
“Global warming has led to increases in hot extremes and heatwaves, affecting human health and leading to crop and animal losses, as well as increases in the occurrence and intensity of wild fires in some regions.
Increases in global temperature have led to global sea level rise, flooding coastal areas and causing coastal erosion and pollution of coastal freshwater systems with seawater. The impacts of storm surges, combined with global and regional sea level rise, were clearly demonstrated by the storm surge impacts of Hurricane Sandy on New York City and the east coast of the United States. Expected sea level rise by the end of this century for even the smallest projected global warming will lead to the annual flooding of many hundreds of millions of people and the complete loss of some low-lying island countries.
One of the other major impacts of climate change due to increasing carbon dioxide concentrations is the increase in carbon dioxide dissolved in the oceans. As shown below, the dissolved carbon dioxide in the upper waters of the ocean has increased in parallel with the increase in atmospheric concentration. As the oceans absorb more carbon dioxide, they become less basic (or more acidic), with a higher concentration of carbonic acid. This can be seen in the decrease in pH of ocean water by about 0.1 units over the last 30 years.” Karoly’s major statement.
Karoly acknowledges that there are some possible benefits from higher CO2 and warming, but these benefits are only for “moderate levels of global warming.” Thus, the magnitude of expected warming is important.
“The increase in carbon dioxide concentrations in the atmosphere has some potential benefits for plants because carbon dioxide is essential for photosynthesis. Plants grown in an atmosphere with higher carbon dioxide have faster growth rates and lower water use, assuming there are no other limits on growth.” From Karoly’s statement.
Happer writes in his statement:
“If increasing CO2 causes very large warming, harm can indeed be done. But most studies suggest that warmings of up to 2 K will be good for the planet [ (Tol 2009)] extending growing seasons, cutting winter heating bills, etc.” From Happer’s statement.
He adds:
“More CO2 in the atmosphere will be good for life on planet Earth. Few realize that the world has been in a CO2famine for millions of years — a long time for us, but a passing moment in geological history. Over the past 550 million years since the Cambrian, when abundant fossils first appeared in the sedimentary record, CO2 levels have averaged many thousands of parts per million (ppm), not today’s few hundred ppm, which is not that far above the minimum level, around 150 ppm, when many plants die of CO2 starvation [(Dippery, et al. 1995)]. An example of how plants respond to low and high levels of CO2 is shown in Fig. [7] from the review by Gerhart and Ward.” (Gerhart and Ward 2010) From Happer’s statement.
 Figure 7, source (Gerhart and Ward 2010)
From Tamblyn’s detailed reply:
“Temperature — specifically leaf temperature — is a critical factor in photosynthesis and crop yields. Photosynthesis is temperature-dependent: the productivity of photosynthesis is poor at low temperatures, rising to a peak around 30° C for C3 photosynthesizers, slightly higher for C4 plants. Beyond this peak, photosynthesis efficiency declines markedly, dropping to very low by around 40° C.”
This is true and well known, but Happer was careful to say that warming of up to two degrees will be beneficial and Karoly agrees (assuming “moderate” means about 2°). The average temperature of the Earth’s surface today is about 15°, well below the optimum temperature of 30°. Tamblyn also speculates that the nutritional value of plants may be less, but this is controversial. Tamblyn’s comment is irrelevant to this discussion and a red herring, the debate is not about what happens at 40°, but what has happened and will happen at moderate temperature increases.
From Happer’s interview:
“I believe that more CO2 is good for the world, that the world has been in a CO2 famine for many tens of millions of years and that one or two thousand ppm would be ideal for the biosphere. I am baffled at hysterical attempts to drive CO2 levels below 350 ppm, or some other value, apparently chosen by Kabbalah numerology, not science.” Happer’s interview.
From Happer’s final reply:
“Over most of the geological history of the Earth, CO2 levels have been much higher than now. There were no tipping points: ocean acidification was not a problem; corals flourished, leaving extensive fossil reefs for us to study today; and evolution continued its steady course on land and in the oceans, punctuated by real catastrophes, including giant meteor strikes, massive volcanic eruptions leading to vast areas of flood basalts, etc. These events probably released CO2, CH4, SO2, and other gases that significantly affected the oceans and atmosphere, but the catastrophes were not directly caused by greenhouse gases.
The only undisputed effect of more atmospheric CO2 over the past century has been a pronounced greening of the earth …” Happer’s final reply.
Happer provides an excellent discussion of the benefits of more CO2 in both his interview and his statement, they are well worth reading.
Happer disagrees with Karoly and Tamblyn’s assertions that extreme weather events, excessive sea level rise, and ocean acidification will increase and cause problems.
“One of the bogeymen is that more CO2 will lead to, and already has led to, more extreme weather, including tornadoes, hurricanes, droughts, floods, blizzards, or snowless winters. But … the world has continued to produce extreme events at the same rate it always has, both long before and after there was much increase of CO2 in the atmosphere. In short, extreme weather is not increasing. [Original reference (Pielke Jr. 2017)]
We also hear that more CO2 will cause rising sea levels to flood coastal cities, large parts of Florida, tropical island paradises, etc. The facts, from the IPCC’s Fifth Annual Report (2013), are shown in Fig. 19 [not reproduced here]. A representative sea level rise of about 2 mm/year would give about 20 cm or 8 in of sea level rise over a century. For comparison, at Coney Island, Brooklyn, NY, the sea level at high tide is typically 4 feet higher than that at low tide...
In biologically productive areas, photosynthesizing organisms remove so much CO2 during the day that the pH can increase by 0.2 to 0.3 units, with similar decreases at night when respiring organisms return CO2 to the water.” Happer’s major statement.
Thus, Happer does not believe the estimated average decrease in pH of 0.1 unit cited by Karoly is significant. After all, if the daily local range of pH is over 0.2, how can this be a problem?
Tamblyn takes issue with a graph, from Rutgers University that Happer used to show Northern Hemisphere snowfall is increasing, which it is. He shows more data that shows the yearly variation in snow fall and snow cover is increasing, although it isn’t clear what this means in terms of climate and his attempt to make it meaningful is not convincing, at least to this author. Tamblyn also claims the rate of sea level rise is going up in recent decades, but acknowledges the current rate he quotes is 3.4 mm/year or just over a foot in 100 years. We should also point out that the last few years, since 2010, the rise in sea level has slowed considerably to about 1.6 mm/year according to CSIRO. The starting and ending points matter a great deal, the record is short, measurements inaccurate and difficult, and the accuracy desired, millimeters, very small.
Tamblyn acknowledges that a small decrease in pH will have little impact, if any, on the biosphere. But, he speculates that in the future there may be some adverse impacts based on studies of areas where conditions are very unusual, such as the Southern Ocean.
The debate over extreme weather events and how man-made climate change affects them will not be settled here or by Tamblyn, Happer and Karoly. The interested reader can read the various arguments in the original documents and Dr. Roger Pielke Jr.’s congressional testimony (R. Pielke Jr. 2017) and book (R. Pielke Jr. 2010) or this summary of the discussion of extreme weather and climate change. The only rational conclusion one can come to is that we do not know if the strength or frequency of extreme weather events are affected by climate change.
Economic losses from extreme weather events have increased, but this is largely due to inflation and increases in wealth and the number of people living in areas exposed to extreme weather events, the connection to climate change is very weak, as stated by the IPCC in AR5:
“Economic losses due to extreme weather events have increased globally, mostly due to increase in wealth and exposure, with a possible influence of climate change (low confidence in attribution to climate change).” IPCC AR5, Technical Summary, page 49.
In his final reply, Tamblyn includes a laundry list of potential dangers of climate change, but these are all speculative and based on models that use an assumed climate sensitivity to CO2 that is probably too high and depend upon large potential temperature increases that may or may not happen. They are largely irrelevant to the discussion because Karoly and Happer, and presumably Tamblyn, all believe that a geologically rapid temperature increase of two-degrees C or less is benign and may be beneficial. The key argument here is will we reach two degrees or more anytime soon? Or the equivalent question, is the climate sensitivity to CO2 around one or three or more? Listing hypothetical dangers to a temperature we may not reach is a waste of our time. The issue is how fast and how much.
6. Should anything be done to combat global warming?
Karoly thinks that “limiting global warming to any level requires stabilizing greenhouse gas concentrations in the atmosphere.” Due to the unmeasured but computed “CS” (climate sensitivity to doubling the CO2 concentration in the atmosphere) Karoly believes “rapid, substantial and sustained reductions in greenhouse gas emissions from human activity” are required. He continues:
“The net emissions (sources minus sinks) of greenhouse gases into the atmosphere from human activity need to fall from present levels to near zero as quickly as possible.” Karoly’s major statement.
Karoly provides our Figure 8 below as an illustration of the impact of human CO2 emissions on climate.

Figure 8. The IPCC estimated impact of human CO2 emissions on global average temperature. From IPCC AR5, Synthesis Report page 9 (IPCC core writing team 2014). The ellipses show the temperature change location of various IPCC emission scenarios, the numeric labels are ranges of CO2concentration in 2100 in ppm. The position of the ellipses suggests an approximate assumed CS (climate sensitivity to CO2) of just under 3.0°C/2xCO2.
The plot in Figure 8 is model-based and assumes a range of CO2 emissions scenarios
that cover the shaded region. The warming shown is the warming at 2100. An unstated assumption, used to make the graph, is the expected CS, or climate sensitivity to a doubling of CO2 abbreviated “°C/2xCO2.” The 2100 CO2 concentrations on the plot imply a CS of approximately 3.0°C/2xCO2. If the CS is lower than assumed by the IPCC or Karoly, the slope of the ellipses and the shaded region will be lower than illustrated and the resulting temperatures in 2100 will be lower at each level of CO2 emissions.
The ECS or Equilibrium Climate Sensitivity is the temperature-rise reached after the oceans have equilibrated with a new surface temperature. It is unknown, but the IPCC estimates the true ECS to be between 1.5° and 4.5°C/2xCO2, which is the same range given in the Charney report in 1979. Quoting the AR5 report:
“Equilibrium climate sensitivity is likely in the range 1.5°C to 4.5°C (high confidence), extremely unlikely less than 1°C (high confidence), and very unlikely greater than 6°C (medium confidence).”
The above quote, on page 14 of the “Summary for Policymakers” has a footnote that reads as follows:
“No best estimate for equilibrium climate sensitivity can now be given because of a lack of agreement on values across assessed lines of evidence and studies.”
What they mean by the footnote is that the model results and observation-based estimates of ECS do not agree with one another, the model results are higher by a factor of almost 2 times. To reach the ECS temperature, the oceans must equilibrate to the surface temperature, the length of time required is not known, but probably many hundreds of years or more. We, as humans, are more interested in the climate sensitivity, a smaller number, the rapid (70 years or so) temperature response of the surface to a change in CO2. Happer calls this the climate sensitivity or “CS” or “S.” Generally, it is assumed that CS (or TCR as it is also sometimes called) is about 70-80% of ECS (Lewis and Curry 2015), but it varies depending upon the assumed ocean response to surface warming.
Happer estimates a feedback-free, pre-equilibrium climate sensitivity (CS) of about one-degree C/2xCO2 in his statement and explains his calculation in some detail. The final calculation, for Princeton, New Jersey is given in his equation 19. How feedbacks affect the climate sensitivity is unknown, the IPCC believes the net feedback is positive, thus Figure 6 (see Part B) shows the result of a CS near 3°C/2xCO2. As Happer notes, observations suggest the total CS, including all feedbacks, is closer to his theoretical value of one. Recent work by Nic Lewis and Judith Curry, using historical temperature and CO2 data (Lewis and Curry 2018), suggest the overall ECS is likely 1.6°C/2xCO2, with CS around 1.3°C/2xCO2. Richard Lindzen, using satellite data, has computed an ECS of 0.7°C/2xCO2 and believes the net feedbacks on CO2-based warming are negative (Lindzen and Choi 2011).
Tamblyn claims that as atmospheric temperature rises, the total water vapor in the atmosphere will rise. Water vapor is a powerful greenhouse gas, so if CO2 causes temperature to rise and temperature causes water vapor to rise, the temperature increase will accelerate – positive feedback. He supports this claim with a reference to (Soden, et al. 2002). Soden et al. base their conclusion on data from 1991-1996 and data from IPCC AR5 from 1988-2012 over the oceans. Other data on the relationship between atmospheric temperature and total water vapor content is more ambiguous and various datasets do not agree with one another very well (Benestad 2016) (Miskolczi 2010). See this review for a discussion of the ambiguity in this data. Not considered in this assumption is the unknown relationship between increased water vapor and clouds or the unknown relationship between clouds and CS. Too many unknowns to take this speculation about water vapor seriously.
With the various proposed values of CS in mind, Happer provides us with an interesting graph, shown in Figure 7. The IPCC, and most climate scientists, believe that warming of two degrees is unlikely to cause problems. In Figure 9, Dr. Happer has noted how many years it will take to reach this milestone at CS values (called S in the graph) of 0.5° to 4°C/2xCO2, the true value of CS is generally thought to lie between these two extremes. A CS of 2°/2xCO2 takes 200 years and an CS of one-degree takes 600 years. In Happer’s opinion, the truth probably lies between these two values, with values less than one possible. The value of CS, inclusive of feedbacks, is probably the most important unknown in the whole climate debate, yet we know little more about it today than we did when the Charney Report was published in 1979 (Charney, et al. 1979) (Curry 2017).

Figure 9. A plot of warming (ΔT) versus CO2 concentration in ppm, each line is a different CS (“S” or sensitivity). The feedback-free sensitivity computed by Happer is the green line and it takes 600 years to increase the Earth’s temperature two-degrees.
The recent mismatch between observed temperatures and climate model predicted temperatures is easily seen in Figure 6a in Part B, as well as in Dr. John Christy’s plot of the model average and observations in Figure 10 from Happer’s major statement.

Figure 10. The model predicted temperatures are averaged and shown with the red line, the observed temperatures from weather balloons and satellite measurements are shown in blue and green respectively. The points plotted are all five-year averages to remove some of the year-to-year variability.
Happer points out that climate researchers have proposed more than 50 mechanisms for the poor model performance illustrated in Figure 10. However, in his opinion, the simplest reason for the discrepancy is that the doubling sensitivity (CS) assumed by the models (~3°C/2xCO2) is much too large. He closes the discussion of sensitivity to CO2 with this:
“The simplest interpretation of the discrepancy of [Figure 10] is that the net feedback is small and possibly even negative. Recent work by Harde indicates a doubling sensitivity of S = 0.6 K.” (Harde 2014)
So, Happer’s contention is that the “doom and gloom” predictions of the IPCC community are the result of overestimating the sensitivity of climate to CO2 concentration (CS). If they correct their sensitivity, they will find that no government intervention is needed. This is the answer to Tamblyn’s laundry list of potential man-made climate hazards. He writes:
“Is concerted governmental action at the global level desirable? No. More CO2 will be good for the world, not bad. Concerted government action may take place anyway, as has so often happened in the sad history of human folly. The Happer Interview.
Tamblyn does not believe that the period of time shown in Figure 10 (and in other figures shown in Happer’s statement) is long enough to draw any conclusions. Tamblyn also presents more estimates of ECS and they range from less than one to over five. He acknowledges that no one knows what ECS is but suggests that the estimates “cluster around 3.” Not very precise when so much hangs in the balance. Far too many conclusions in climate science seem to have their roots in “guesstimates” like this one.
From Happer’s final reply:
“It is immoral to deprive most of mankind of the benefits of affordable, reliable energy from fossil fuels on the basis of computer models that do not work.” Happer’s final reply.
What is coming next?
The answers the scientists give to these two questions show that their difference of opinion on how much warming will occur in the next few hundred years leads them to different conclusions. Both agree warming could be a problem if the warming is large, perhaps more than two-degrees, perhaps the limit is larger, but both agree that warming will be a problem if it is large enough and happens very rapidly. Karoly believes the more radical model projections are possible, Happer does not.
Both agree that modest warming will benefit humankind and green the planet. Their differences center around the value of CS.
In Part D of this series I will discuss my thoughts and opinions after reading the debate documents.
Works Cited
Benestad, Rasmus. 2016. “A Mental Picture of the Greenhouse Effect.” Theoretical and Applied Climatology 128 (3-4): 679-688. https://link.springer.com/article/10.1007/s00704-016-1732-y.
Charney, J., A. Arakawa, D. Baker, B. Bolin, R. Dickinson, R. Goody, C. Leith, H. Stommel, and C. Wunsch. 1979. Carbon Dioxide and Climate: A Scientific Assessment. National Research Council, Washington DC: National Academy of Sciences. http://www.ecd.bnl.gov/steve/charney_report1979.pdf.
Curry, J. 2017. Climate Models for the layman. GWPF Reports. https://www.thegwpf.org/content/uploads/2017/02/Curry-2017.pdf.
Dippery, D., D. Tissue, R. Thomas, and B. Strain. 1995. “Effects of low and elevated CO2 levels on C3 and C4 annuals.” Oecologia 101 (1). https://link.springer.com/article/10.1007/BF00328895.
Gerhart, Laci, and Joy Ward. 2010. “Plant responses to low [CO2] of the past.” New Phytologist 188: 674-695. https://nph.onlinelibrary.wiley.com/doi/pdf/10.1111/j.1469-8137.2010.03441.x.
Harde, H. 2014. “Advanced Two-Layer Climate Model for the Assessment of Global Warming by CO2.” Open Journal of Atmospheric and Climate Change.https://www.researchgate.net/profile/Hermann_Harde/publication/268981652_Advanced_Two-Layer_Climate_Model_for_the_Assessment_of_Global_Warming_by_CO2/links/547cbb420cf2cfe203c1fbab.pdf.
IPCC core writing team. 2014. Climate Change 2014 Synthesis Report. https://www.ipcc.ch/report/ar5/syr/.
Lewis, Nic, and Judith Curry. 2018. “The impact of recent forcing and ocean heat uptake data on estimates of climate sensitivity.” Journal of Climate. https://journals.ametsoc.org/doi/10.1175/JCLI-D-17-0667.1.
Lewis, Nicholas, and Judith Curry. 2015. “The implications for climate sensitivity of AR5 forcing and heat uptake estimates.” Climate Dynamics 45: 1009-1023. https://search.proquest.com/openview/2f4994e4ab3a28571ecdff2edb3aeb13/1?pq-origsite=gscholar&cbl=54165.
Lindzen, Richard, and Yong-Sang Choi. 2011. “On the Observational Determination of Climate Sensitivity and Implications.” Asia-Pacific Journal of Atmospheric Sciences 47 (377). https://link.springer.com/article/10.1007/s13143-011-0023-x#citeas.
Miskolczi, Ferenc. 2010. “The Stable Stationary Value of the Earth’s Global Average Atmospheric Planck-Weighted Greenhouse-Gas Optical Thickness.” Energy and Environment. http://journals.sagepub.com/doi/abs/10.1260/0958-305X.21.4.243.
Pielke Jr., R. 2010. The Climate Fix, What Scientists and Politicians won’t tell you about global warming. New York, New York: Basic Books. link: http://sciencepolicy.colorado.edu/publications/special/climate_fix/index.html.
Pielke Jr., Roger. 2017. “STATEMENT OF DR. ROGER PIELKE, JR. to the COMMITTEE ON SCIENCE, SPACE, AND TECHNOLOGY of the UNITED STATES HOUSE OF REPRESENTATIVES.” U.S. House of Representatives, Washington, DC. https://science.house.gov/sites/republicans.science.house.gov/files/documents/HHRG-115-SY-WState-RPielke-20170329.pdf.
Soden, Brian J., Richard Wetherald, Georgiy Stenchikov, and Alan Robock. 2002. “Global Cooling After the Eruption of Mount Pinatubo: A Test of Climate Feedback by Water Vapor.” Science 296 (5568): 727-730. http://science.sciencemag.org/content/296/5568/727.
Tol, Richard. 2009. “The Economic Effects of Climate Change.” Journal of Economic Perspectives 23 (2): 29-51. https://www.aeaweb.org/articles?id=10.1257/jep.23.2.29.
5. How do we know global warming and more CO2 will have substantial adverse impacts on humans and the planet?
Karoly: “Global warming has led to increases in hot extremes and heatwaves, affecting human health and leading to crop and animal losses, as well as increases in the occurrence and intensity of wild fires in some regions.” Etc, etc, etc, etc…………
WTH, he just states the question as a given fact & made no effort to actually answer how we know it’s caused by CO2.
He begged the question because he has to. There is no mechanism for atmospheric CO2 – even if you accept that CO2 absorbs/scatters infrared – to warm the oceans or any vegetation covered land around 80% or more of the planet’s surface.
Downwelling infrared will increase evaporation from the oceans surface and increase transpiration from vegetation. As the humidity increases the enthalpy of the humid atmosphere increases reducing the temperature by increasing the potential energy content in kilojoules/kilogram of the atmosphere.
If the atmosphere above the water surface or above vegetation is warm it will increase evaporation and transpiration humid air is in any case lighter than dry air at the same temperature and rise. When the rising air cools enough (due to pressure change as it rises) the water will condense out then freeze – releasing latent heat increasing the convection. (This is how thunderstorms work. ) Cold rain/hail/snow then falls to the surface cooling it (taking up more kilojoules of energy) to continue the hydrologic cycle.
The top few meters of the ocean hold more energy (in kilojoules/kilogram) than the entire atmosphere. Atmospheric warming of a few degrees is a trivial amount of energy in comparison and only increases energy loss from the surface to space due to the hydrologic cycle. This can be seen in geologic record where temperatures reach a peak level and hold at that level where the hydrologic cycle provides homeostasis.
The entire ‘green house effect’ is based on falsified hypotheses and use of incorrect metrics. This is why the lapse rates can be accurately calculated by ICAN without reference to CO2 just to levels of humidity purely based on The Gas Laws.
Happer makes the point that we are in a CO2 famine. Emotive language that means nothing. We evolved on a planet that has had low levels, therefore that is where we are suited and thrive. Farmers farm according to the climate in their region. Sure they can change if the climate changes, but it will take it’s toll. Reduced crops, uncertainty, damage. We might get lucky and keep ahead of the changes, but then we might not.
Animals have a habitat that includes the climate for a reason. It’s where they are suited and function best. If we alter that quickly (150 years is quickly) then they are at serious risk. That concerns me. All life is precious, not just human life. As far as we know this is the only planet with life like this. I think it is sensible to be cautious, particularly with the evidence we now have.
Just because civilization sprang up during a time of CO2 drought is not evidence that every animal and plant is best suited to these dangerously low CO2 levels.
There’s a reason why greenhouse owners often boost CO2 levels to over 1000ppm. And it’s not because they like to waste money.
How much adaptation does it take to stay ahead of a few tenths of a degree per century.
Your knowledge of farming is even worse than your knowledge of science.
MarkW
“Just because civilization sprang up during a time of CO2 drought is not evidence that every animal and plant is best suited to these dangerously low CO2 levels.”
That’s true, but many of the plants and animals around during high levels are gone. And where did you get “dangerously?” That’s crazy emotive language. They are “your species” levels.
“There’s a reason why greenhouse owners often boost CO2 levels to over 1000ppm. And it’s not because they like to waste money.”
I get that plants to a certain level do better, but then things drop off. And no one said there were no benefits. Karoly acknowledges that here.
“How much adaptation does it take to stay ahead of a few tenths of a degree per century.”
It’s been one degree in a century and forecast to increase.
“Your knowledge of farming is even worse than your knowledge of science.”
But still pretty good aye. I know enough to know farmers like to be aware of what is ahead so they can plan. Change of climate is a massive concern for those with a few clues. I can see why you are not worried.
Mark is not the sharpest pencil in the box…
Careful how you go, do you believe Karoly’s statement?
“The net emissions (sources minus sinks) of greenhouse gases into the atmosphere from human activity need to fall from present levels to near zero as quickly as possible.”
“Do I believe Karoly’s statement?’ – No
As I said earlier there is no mechanism for a warm mainly dry atmosphere to warm the ocean or to warm land covered in vegetation. All it does is increase evaporative heat loss. Therefore, the main plank of the AGW hypothesis is falsified.
Increase in atmospheric humidity will increase the absorption of infrared but it also increases the enthalpy of the air -therefore, more heat does not equal increased temperature; and, increases in humidity also increase the speed of the hydrologic cycle carrying heat to the upper atmosphere at a faster rate. As anyone in the tropics and subtropics will tell you.
If you are claiming the atmosphere is trapping energy then you must use metrics for energy content – kilojoules per kilogram. Temperature is the incorrect metric for energy content in a variable humidity atmosphere.
OK thanks.
It really is cute how trolls feel the need to support each other.
It’s necessary because the facts don’t.
Simon, please list the plants that have become extinct over the last 100K years.
Since your first statement is demonstrably wrong, the rest of your suppositions also fail.
As to greenhouses, your whole point is that plants don’t need higher CO2 levels, yet you admit that greenhouse owners more than double the current atmospheric levels. Something you dismiss as being “somewhat higher”.
Can’t you at least try to be hones, for once?
“Simon, please list the plants that have become extinct over the last 100K years.”
Time to sharpen the pencil Mark and do some research for yourself.
Simon you say
“Animals have a habitat that includes the climate for a reason. It’s where they are suited and function best”
And since we evolved in tropical forests and African savannahs, we’re best off in that climate. So how do we ensure the world is more like that? Certainly, not by removing CO2, the main plant food!
The pertinent question may be “how can we heat-up the global climate to that African level so all humans can thrive?”
Jon
We have an african climate. It’s in Africa.
So you want the whole world to move to Africa? Surely the people who already live there have a say in that.
Nope, we live where we are best suited. Which was my point at the start. Don’t mess with things you don’t have to
Much of this topic has become, or always was, quasi-religious and political, not scientific as such. When the determination of a crucial variable (ECS) has not improved since 1979, something else is going on than a search for and exploration of reality.
Just look at the buzz words:
1) Experts – legal argument.
2)Deniers – religious or dogma based.
3) Consensus – political argument.
No sign of any empirical evidence.
MODTRAN6 corroborates other’s findings of low climate sensitivity. And the quiet sun might cancel that.
Oops, should be: ꝺT/ꝺCO2 = ꝺT/ꝺFlux *ꝺFlux/ꝺCO2 * CO2/T
Assuming linearity?
True but IMO least biased and actual will turn out to be lower. Linear contribution of CO2 to date by this method is 0.00276 * (407 – 275) = 0.36 K which would be a substantial chunk of the total increase of about 1 K since 1700.
Dan,
Would it be possible for you to do similar calculations for different areas of the Earth, say the Sahara, Amazon Basin, and Western Europe, and see if you derive similar results for climate sensitivity?
Only available default values on MODTRAN6 (on line freebe version) is latitude sections and seasons as covered in last paragraph.
Dan,
As I have remarked elsewhere, I suspect that there isn’t just one value for CS. I think that climate zones will be more important than latitude because one can have vastly different climates along the same latitude. I’d like to figure out if CS varies, and if by any substantial amount. Probably the most important variable will be WV, and we already know that WV is very different for the Sahara (or Atacama) versus say the Amazon.
I think you are on to something here with your approach!
There is only one CS for global but it can be determined by area and time weighting of constituents.
The calculated CS for each of the regions and times are: 34.2 % tropics = 1.51 K, 26.2 % mid latitude summer = 1.39 K, 26.2 % mid latitude winter = 0.186 K, 6.7 % subarctic summer = 3.67 K, 6.7 % subarctic winter = -0.59 K (yes, adding CO2 to subarctic winter actually produces cooling).
“How do we know global warming and more CO2 will have substantial adverse impacts on humans and the planet?”
Actual empirical data contradicts this.
1. If hot temperatures are detrimental, why do we grow plants in a greenhouse in the first place?
2. If high CO2 is detrimental, why do greenhouses in the Netherlands pump in CO2 from local refineries.
Sorry to say both of these well educated men are wrong. CO2 has nothing at all to do with climate. I’m in the atmospheric pressure camp which totally invalidates GHE. Refer to the Nikolov, Zeller paper. What we have here are two men educated with the notion that CO2 has atmospheric warming potential. It does not.
Happer and Pielke are wrong on this one. Multiple studies in beaches and bays all over the North Atlantic and Western Mediterranean have shown that storminess was much stronger during the Little Ice Age, which was the stormiest period in 6000 years. Theoretical calculations show that a warmer atmosphere is less capable of producing work as more energy is consumed by evaporation. Atmospheric-related extreme weather events have decreased with global warming. Recent data also supports this, as Accumulated Cyclone Energy has decreased over the past decades.
Globally wildfires have also decreased during the satellite era, although the cause appears to be human-related.
All in all it cannot be said that extreme weather events should increase with global warming. Some will do, others will decrease.
Thanks Javier. Happer and Pielke might not be aware of the studies you refer to or they are afraid to compare modern records to proxies. Here is the plot of storminess from your fifth nature unbound post:
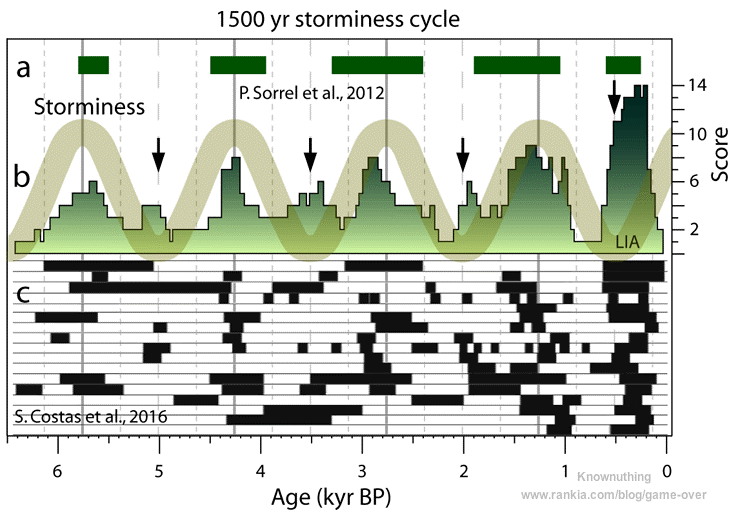
The so called cycle broke down with the LIA, but note at the long term increase in storminess with the long term cooling. Colder planets in our solar system have faster storms.
The estimates of future temperatures have a serious problem. They depend on estimates of emissions of CO2, which in turn are based on estimates of future population. But the population estimates assume a rising population, which is not going to happen. Most estimates are that the world’s population will start decreasing by the 2050s.
In fact, the world’s population already is aging, and will age more rapidly due to fewer births. Older persons use less energy than younger persons. China’s population collapse will be a big factor in this: In 1990 persons 15 years old and younger had 22 million per age year; in 2015, it was 15 million per year. This will significantly reduce the demand for new housing, automobiles, food, etc., as the current much smaller number of youngest persons replace the 1990 youngest persons in the next decade.
Many countries already are showing actual decreases in population, from Japan to Portugal to Russia. The projected world fertility rate for 2015 to 2020 of 2.47 is barely above the necessary rate of 2.10 (https://en.wikipedia.org/wiki/List_of_sovereign_states_and_dependencies_by_total_fertility_rate#Country_ranking_by_TFR_forecast). India is only 2.34, the United States is 1.94, Brazil is 1.74, China is 1.59!!, Germany 1.44.
Towards the end of the article, four lines above ‘What is coming next?’, it is stated that, “Far too many conclusions in climate science seem to have their roots in “guesstimates” like this one.” This problem of “guesstimates” has been around for decades. For example, almost 30 years ago in [Ref. 1] Hugh W. Ellsaesser wrote,
‘I would like to have you step back and take a critical look at the process by which the now fashionable “Interdisciplinary Science through Workshops of a Committee of Experts” operates; how it transforms preliminary “guestimates” into a consensus supported by a constituency with a vested interest in confirming and perpetuating the problem rather than solving it.’
Two pages later Ellsaesser wrote, ‘It has been my experience that the greater the concern, as indicated by media attention to a research program, the more difficult it appears for the participating scientists to maintain and exercise objectivity.’
For me the above quotes neatly encapsulate how and why the alarmist position has become entrenched over the intervening decades. This is very sad for everybody concerned, especially for the progress of traditional science (as opposed to post normal science) and for the many ordinary people who have had to pay exorbitant energy bills for electricity generated by non-despatchable renewables.
Reference:-
1. S. Fred Singer, “Global Climate Change – human and natural influences”, ICUS/Paragon House, 1989, at pages 67 and 69.
Regards,
John C.
John, I was a government scientists and then an administrator for several decades. One of government responses to any problem is to form an committee of technical experts. Ellsaesser’s quote certainly describes what takes place in such committees most especially if the committee is assigned to actually “research” a problem. I had noted about half way through my career that the smaller such committees were the more useful their ultimate recommendations. I didn’t have a choice about creating such committees. I either served on them or was responsible for creating them at the request of some boss or politico. We had one committee of scientists I managed. The longer they were together they more they were in agreement and defended each other, even when someone on the committee make significant errors. Their ultimate recommendations to management were two fold (1) they needed more time and money to better answer the question, and (2) their recommendations were so ambiguous that it was not useful for policy makers.
Andy et al, please note that my recent paper ”On the influence of solar cycle lengths and carbon dioxide on global temperatures”, by R.J. Booth (2018) Journal of Atmospheric and Solar-Terrestrial Physics, URL: https://doi.org/10.1016/j.jastp.2018.01.026 , universally viewable preprint at
https://github.com/rjbooth88/hello-climate/files/1835197/s-co2-paper-correct.doc , has estimates of climate sensitivity and the time taken for oceans to reach equilibrium.
The TCR is estimated to be 1.93+/-0.26K and the ECS 2.22K with similar error bars. The half-life of the lagged response of oceans to the warming on land is about 20 years – to be contrasted with “probably many hundreds of years or more” in the article above.
The paper has many other goodies too, such as an 18-year periodicity in global temperature anomalies (calculated back in 2011 but came pretty true with 1998 and 2016 warming events).
Thanks R.J., the paper looks very interesting, I will read it. When you say “The half-life of the lagged response of oceans to the warming on land is about 20 years” you do not mean the full depth of the oceans do you? Are you just talking about the mixed layer? Remember, most of the ocean volume is below the mixed layer. Actually over half is below 2000 meters and only ventilates at the poles.
Andy, thanks for promising to read my paper, and sorry for the delay in replying.
No, I don’t mean the full depth of the oceans, because it is higly unlikely that global warming is ever going to affect that, and if some cold current magically managed to emerge from the deep it would dwarf current climate change.
But the surface waters presumably do respond to increased air temperatures, and this is borne out by the data. If the oceans had hardly warmed at all in the last century then it could be argued there is a really long lag. But in fact they have warmed by a significant proportion to the air, which implies a modest half-life for the response.
Andy,
Many thanks for the time and effort you have put into this series…it is much appreciated by me and I’m sure many others in search of facts and good reasoning.
Thanks!
“The impacts of storm surges, combined with global and regional sea level rise, were clearly demonstrated by the storm surge impacts of Hurricane Sandy on New York City and the east coast of the United States.”
Storm surges perhaps, but combined sea level rise around NYC is very small compared to the natural cycle of tides and the normal storm surge that accompanies all storms such as Sandy, which was neither unusual in its strength, time of year of formation, or location of landfall. What made Sandy so destructive was the fact that it hit in just the right place-the mouth of the Hudson. Same with Katrina. Nothing really unusual, it just hit the sweet spot and overwhelmed the levees around New Orleans. For warmists, the phrase “weather isn’t climate” only applies when it works in their favor…
“Economic losses from extreme weather events have increased, but this is largely due to inflation and increases in wealth and the number of people living in areas exposed to extreme weather events…”
The quote touches on one of the main “drivers” of Climate Change, which is the political utility of having an “act of God” to blame for manmade flooding events (Katrina, Sandy, Harvey). None of those storms was capable of catastrophic damage in itself: infrastructure failure and failure to plan were the cause of those catastrophes. Katrina was a Cat 2 over New Orleans, which had weathered many such storms. Sandy was an augmented nor’easter, no hurricane at all. Harvey produced a rain event of biblical proportions in SE Texas, but nothing outside the range of probability.
Meanwhile the charade that weather is becoming more extreme is abetted by agenda-driven media with headlines that grossly mischaracterize the impact of severe weather, such as a UK newspaper’s “Monster hurricane slams into Texas” — sounds like Dallas, Houston and Austin were either inundated or blown into Oklahoma, when in fact the monster winds of Harvey (as with all large storms) affected only a tiny area and population; a 30-mile wide swath centered on Rockport was hit with the 125 mph winds of the eye wall, but most of economic damage occurred 200 miles further up the coast near Houston, the result of opening the sluice gates of inadequately designed reservoirs.
From the article: “The interested reader can read the various arguments in the original documents and Dr. Roger Pielke Jr.’s congressional testimony (R. Pielke Jr. 2017) and book (R. Pielke Jr. 2010) or this summary of the discussion of extreme weather and climate change. The only rational conclusion one can come to is that we do not know if the strength or frequency of extreme weather events are affected by climate change.”
Well, if extreme weather events are affected by human-caused Climate Change (CO2), then explain how CO2 is increasing while extreme weather events are decreasing.
I knew the post below would come in handy in the future.
https://wattsupwiththat.com/2018/09/02/an-open-letter-to-u-s-politicians-running-for-office-in-2018-about-climate/
-The Annual Number of Hurricanes Making Landfall on the Continental U.S. Has Decreased Since 1900 (NOAA AOML– Atlantic Oceanographic and Meteorological Laboratory)
-The Annual Number of Tornados for All 50 States Has Decreased Since 1954 (NOAA NWS – National Weather Service)
-Drought Conditions for the Contiguous U.S. Have Decreased Since 1895 (NOAA NCDC – National Climatic Data Center, now known as the NCEI – National Centers for Environmental Information)
-Floods for the Contiguous U.S. Streams and Rivers Have Decreased Since 1970 (USGS – United States Geological Survey)
end excerpt
I might add that not only have the numbers of tornados decreased but the severity of tornados has also decreased. This year has been one of the more pleasant summers here in Tornado Alley. Relatively mild temperatures, more rain than we know what to do with (we are usually bone dry by this time of year and hoping for a tropical depression to come visit) and tornados are few and far between. We’ll take a summer like this every year! 🙂
“Water vapor is a powerful greenhouse gas, so if CO2 causes temperature to rise and temperature causes water vapor to rise, the temperature increase will accelerate – positive feedback.” But that is not happening. “net feedbacks on CO2-based warming are negative (Lindzen and Choi 2011).” That has already been proven. Back in the 40’s someone came up with the “heat index”. Here in Ohio when we have high humidity weather person will say ‘The thermometer says it’s 90F but it “feels” like it’s 100F. Question: Why doesn’t the thermometer say 100F? Because water vapor is doing their “get ridding of latent heat thing” If we were in Yuma, Az if the thermometer said it was 90F the heat index would be what, 92F or 93F because of very low humidity.
Try high desert away from the river.
It’s reasonable for Happer to concentrate on the idea that because sensitivity appears to be low, and mild warming is beneficial, there is not a problem. However, I don’t think it’s actually been established that even if the models were right about ECS and RCP 8.5 happened, that the consequences would be catastrophic. The climate models can at least claim they got the right sign on the temperature anomaly trend — that hasn’t even been shown for the economic models.
Further, the “should anything be done” section also revolves around the magnitude of the problem. But even if sensitivity were high and economic damages were also high, it still doesn’t necessarily follow that mitigation would be more cost-effective than adaption. To date, the “do something” policies advocated and adopted have the twin demerits of simultaneously being expensive and ineffective.
Make no mistake about it, there is a real (negative) economic impact in “rapid, substantial and sustained reductions in greenhouse gas emissions from human activity”. Issuing carbon credits is just as artificial and detrimental as over printing of money in a Latin American dictatorship. It takes time for dramatic policy implosion to occur in either case but damage is done nonetheless along the way.
The 30-year rollover and decline of the AMO cycle will put this debate on ice for a long time. The antagonists of satellite temperatures will have to get a lot louder and desperate to overcome the pattern of decline. Politically of course you could have another round of over reach going against this reality with excuses ramped up….for awhile.