From ETH Zurich and the “slow as molasses in winter” department.
Hot summers cause glaciers to melt. That not only changes the makeup of the landscape and hence the maps of Switzerland, it also affects every area of society. A new, dynamic glacier inventory makes the impact of climate change and the changing landscape visible.

The last time Swiss glaciers managed to grow at all was in 2001. Since then, the country’s 1,500 glaciers – as well as others elsewhere – have been suffering a slow but inexorable death. Until now, though, we have understood only partially how quickly they are really disappearing, and what effect that has on the landscape, people and animals. That is about to change, thanks to the Glacier Monitoring in Switzerland (GLAMOS) project. GLAMOS is working on behalf of various Swiss federal offices to put together a comprehensive inventory of the country’s glaciers – at an unprecedented level of detail.
But why bother compiling such a detailed inventory of a dying “species”? For GLAMOS geoinformatics expert and ETH employee Yvo Weidmann, the reason is obvious: “Glacial melt affects the flow rate of our rivers, which makes it a relevant factor in natural catastrophes, disaster prevention, the power supply, transportation, tourism, building sites and not least glacier research.”
Today, GLAMOS is monitoring some 100 glaciers, with a particular view to measuring fluctuations in their length and ice thickness. In future, it will gather data on the extent of some 1,500 glaciers, helping tomorrow’s researchers to track even the tiniest changes in their extent.
From maps to a digital 3D landscape model
What makes the new inventory possible is a paradigm shift at the Swiss Federal Office of Topography, or swisstopo: it has spent several years painstakingly converting its maps into a digital 3D landscape model. The earlier maps show – to put it simply – where things are, but this basic view was of no use in glacier research.
Glaciers can be covered by debris, which is relevant for glaciology. “It’s possible for a major proportion of a glacier snout to be hidden by debris, with the visible body of ice representing only part of the actual glacier,” Weidmann says. This means a purely cartographical representation of the area of visible ice comes up literally too short.

Ice fields become glaciers
In the topographical landscape model, this limitation falls away. The digital representation makes it possible to combine various layers along topographical rules. For instance, forest and bodies of water can touch but not overlap. Boulders can lie on top of ice. And liquid water – for instance glacial lakes – can be present over ice. Layers can be added or removed on the computer, producing a comprehensive model of the landscape that is fit for all possible purposes.
Now for the first time, swisstopo’s new landscape model also records glaciers according to glaciological rules. For instance, it is sometimes the case that two glaciers, located on opposite mountain flanks and with opposing directions of flow, will meet along a mountain ridge. From a cartographical viewpoint, this would be treated as a single large area of ice. But from a glaciological viewpoint, these are two “individuals” that have little in common and no effect on each other – apart from where they brush against each other on the mountain ridge.
“In future, glaciers will be given a unique number to make their history traceable,” Weidmann explains, adding, “Should a glacier with two catchments in two different valleys melt to the extent that it becomes two independent glaciers, one of them will be assigned a new number.” These inventory numbers not only make it easier to identify glaciers, they also help to document their history.
A model of unprecedented precision
By linking the inventory to glaciological computational models, researchers can show how much water each glacier will deliver and when.
The more data that flows into the model, the more precise the basis on which to make predictions. As a result, GLAMOS achieves an unprecedented level of precision. Every four to six years, swisstopo aircraft record each square metre of Switzerland. The 3D images generated are capable of showing changes in altitude across a grid of two metres by two metres to an accuracy of some 50 centimetres. If an area of gravel sediment ahead of a glacier snout sinks noticeably between two measurements, there is probably ice under it. The true proportions of the glacier below are better documented with each subsequent measurement.
A treasure trove of data
The first complete inventory of glaciers was drawn up in 1973. Later, a second inventory was reconstructed for the year 1850 based on estimates, maps and moraines. Additional surveys followed in 2000 and 2010. All these inventories were important for research, but each was produced using its own set of rules and different methods, making them barely comparable.
From 2019, Switzerland will for the first time be able to turn to a glacier inventory that will undergo dynamic further development and be completely renewed every four to six years. And the cost of the new glacier inventory is manageable because GLAMOS is drawing on existing troves of data, processing them, interlinking them and making them available in a format that a wide audience can use.

What is GLAMOS?
The Swiss Glacier Monitoring Network documents long-term fluctuations in glaciers located in the Swiss Alps. It is jointly operated by Sciences Switzerland’s Cryospheric Commission, the Laboratory of Hydraulics, Hydrology and Glaciology (VAW) at ETH Zurich, and the Universities of Fribourg and Zurich. Images are secured with financial support from the Swiss Federal Office for the Environment, MeteoSwiss, and the Swiss Academy of Sciences (SCNAT).
The Sahel (southern Sahara) desert has also “been suffering a slow but inexorable death.”
http://archive.is/gWGr0
http://sealevel.info/090731-green-sahara__excerpt_natgeo.png
So much death of dearth of life. 😢
They should study the Russian Glaciers
GLAcier MOnitering in RUSsia would be for more GLAMORUS
Yes this retreat is TOTALLY UNPRECEDENTED due to Global Warming, that is why it is exposing trees, buildings and artifacts going back to when Hannibal took the Elephants over the Alps.
Yes, but this time it’s the sign of a ‘new normal’.
They, for some reason, forgot to mention anthropology and archaeology as relevant disciplines for this project.
Maybe instead of ignoring this, they should do what they did for inconvenient paleoclimate events and simply revision the science, i.e. the exposure of medieval artifacts does not suggest that the glaciers have grown since 1,000 A.D. but instead shows that these people climbed into the extant ice fields and glaciers to bury artifacts and sometimes even decided to bury themselves within the ice, solid climastrology.
Let me introduce Otse, a Swiss resident of 4000yrs BCE ago who appeared from under retreating ice in a mountain pass a few decades ago:
https://en.m.wikipedia.org/wiki/Ötzi
Holocene Climate Optimum, anyone? He was a victim of foul play. His leather bag contained Ptarmagan/grouse he had killed. Even that period wasnt as warm as the Eemian interglacial, which wasnt as warm as the Eocene, which wasnt as warm as…other “precedents” unmentioned by Fake News Co.
One observation from the warmists –
As proof of AGW – they always show one picture of the glaciers in the early 1900’s with the next picture in the 1980’s/1990’s and early 2000’s.
Almost always skipping the 1920’s 1930’s and 1940″s – Why because that would show the warming that occurred prior to the Mann made Global warming.
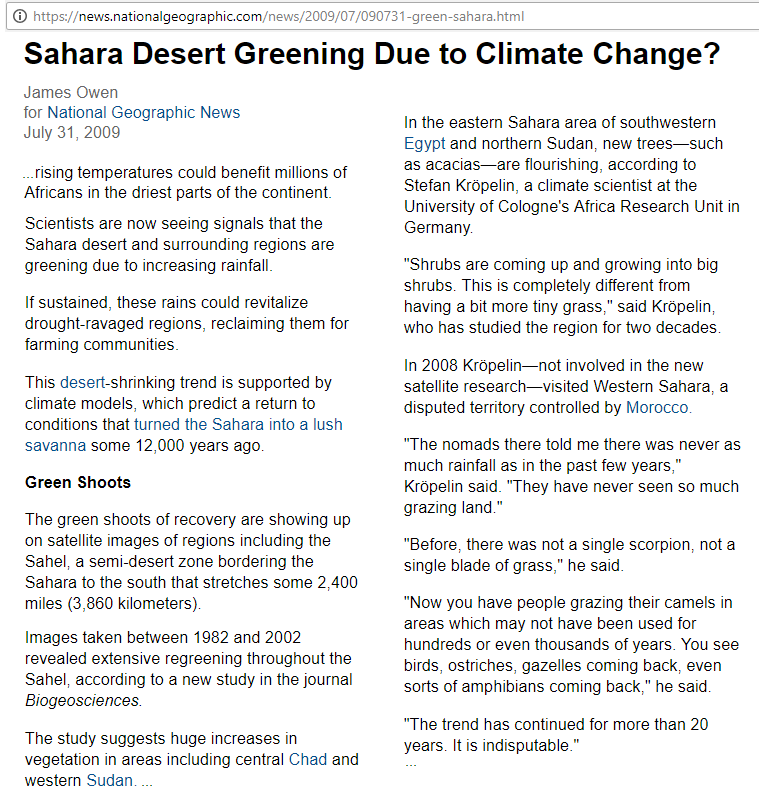
Added comment – The coloured lines show where the edge of the Aletsch glacier once was (red line 1850, green=1973, blue=2010). (Graphic: Swisstopo/GLAMOS)
Eyeballing the graph above with the 1850 red line, the 1973 green line and the 2010 blue line, it would appear that the melt from 1850 – to 1973 and to 2010 has been reasonably consistent for the 160 years by volume, (taking into account the V shaped valleys the glaciers reside in)
So not the sudden glacier melt claimed by the warmists
Though would be nice to have some additional lines for the early 1900’s
The picture shows the ice in 1850. The green line is 1973 which is at the end of the 20th century cold period. The glaciers were retreating from the mid 1800’s on with no possible correlation to CO2.
This alone makes the Eco-Leftist preoccupation with CO2 a farce as science.
John – my comment dealt with the typical presentation by the warmist depicting the “rapid ” decline of the north american glaciers – the ommission of the extent of the retreating glaciers during the 1920’s, 1930’s & 1940’s. Deception / cherrypicking ie the things skeptics get accused of –
I also posted (though the comment is in moderation) noting that based on the 1850 line and the 1973 line vs the 2010 line that the overall volume of glacier ice melt was likely significantly more from 1850 to 1973 (83 years) than from 1973 to 2010 (43 years), taking into account that the valleys are V shaped.
Where did I see… valleys carved by rivers are “V”-shaped, valleys carved by glaciers are “U”-shaped, or more likely half-pipe shape. Which doesn’t negate your point @Joe – the non climate scientist, it just changes the volumes a bit.
But according to Lord Monckton (see his post of last week), the temperature was in equilibrium for 80 years between 1850 to 1930, such that all warming is post 1930 and hence nearly all warming is during the period of manmade CO2 emissions.
Lord Monckton considers that whatever was driving the planet out of the LIA had come to an end by 1850, and there was no further 19th Century recovery, notwithstanding that even Phil Jones conceded the warming through to 1880.
I tried to point out some of the dangers behind his paper which throws the baby out along with the bath water.
Huh? I don’t believe that is what he said…..
Look at this:
http://swiss-glaciers.glaciology.ethz.ch/glaciers/aletsch.html
Nothing to hide
Yes, this page shows a graph of Advancing,Declining and Stationary Swiss glaciers from 1880 to almost present. This has all happened before in the not too distant past.
http://swiss-glaciers.glaciology.ethz.ch/lengthvariation.html
“Glacial melt affects the flow rate of our rivers, which makes it a relevant factor in natural catastrophes, disaster prevention, the power supply, transportation, tourism, building sites and not least glacier research.”
Not to mention the supply of red herrings.
The thing they most like them for is as a proxy for “climate change”.
As in Joerin 2008?
https://chaamjamal.wordpress.com/2018/08/20/the-holocene-optimum-period-a-bibliography/
Took a close look at your Holocence Climate Optimum map. You didn’t source it, though it comes from Wikipedia here:
You have superimposed the black line from that chart at the top of the post and misleadingly named the end of it as ‘present day’, even though the data stops in 1950 (the ‘present’ in ‘before present’ by convention). We can tell this because they have marked temperatures as of 2004 on the right y-axis of original chart, which I see you have edited out of your representation.
As can be seen from the original chart, temperatures relative to mid 20th century in 2004 were already above the level during the period that you label the “Climatic Optimum”. They have warmed further since, of course.
D Rice- nice try. Paleo reconstructions are 1-3 century smoothed temperatures. For apples to apples, the last couple of hundred years should be averaged to one data point!
“Paleo reconstructions are 1-3 century smoothed temperatures.”
Not temperatures, but supposed proxies for temperatures, or not. Comparing the last couple hundred years of thermometer readings to a proxy isn’t even apples to crabs.
Fair point. Using HadCRUT4 1850 to present as the latest data point, zeroed to 1950 as the anomaly base (as the chart is), it would put the solid black line at about 0.2 C on that scale. Close to but not as high as the Holocene climatic optimum.
However, the recent rate of increase would at least rival that seen at the start of the record, c. 11,000 BP. What might have caused this?
Aletsch glacier once was (red line 1850….
Yea, let’s bring back the LIA
Swiss glaciers were a lot bigger 72 years ago…../snark
August 17, 2018, 1:35 PM
Melting glacier uncovers U.S. WWII plane that crash-landed in Switzerland in 1946
A heatwave in Switzerland has uncovered the wreckage debris of an American World War II plane that crash-landed in the Bernese Alps 72 years ago.
https://www.cbsnews.com/news/switzerland-melting-glacier-uncovers-wwii-plane-c53-skytrooper-dakota-that-crash-landed-72-years-ago-2018-08-17/
“The crew and passengers were rescued six days later.”….and they couldn’t rescue them because the glacier was so big they couldn’t walk there
August 4, 2017
An Ancient Lunchbox Emerges from the Ice
In July, an employee of a Swiss ski company came across the mummified remains of a couple who had gone missing in 1942; they were found fully dressed, with their wartime identity cards, backpacks, an empty bottle, a pocket watch, and a book.
https://www.newyorker.com/tech/elements/an-ancient-lunchbox-emerges-from-the-ice
Saturday 18 August 2018
Melting glaciers in northern Italy reveal corpses of WW1 soldiers
https://www.telegraph.co.uk/history/world-war-one/10562017/Melting-glaciers-in-northern-Italy-reveal-corpses-of-WW1-soldiers.html
…glaciers are just doing what glaciers have always done
Glaciers should stand in place where God created them. Stories about ice slowly moving down the mountain and finally depositing anything frozen in them at the lower end are just lies invented by den1ers.
I read books about the LIA…and how glaciers advanced so fast…they wiped out entire villages
Advance, retreat, repeat ad nauseum…
https://debunkhouse.files.wordpress.com/2018/08/2007_ice-borne_prehistoric_finds_in_the.pdf
And I for one, would much rather that the glaciers didn’t advance again for centuries.
Interesting how that hole melted open like that… 🙂
It took some chopping to dig through all of that global warming melted ice!
Soooo… where was the Glacier Extent back in 1350 during the MWP apex
Ancient Forests and are being uncovered
Louis Agassiz (1807–1873) was a Swiss-U.S. zoologist, glaciologist, and geologist. Here’s hoping that the current crop of aspirants in the field of glaciology exhibit the same level of acumen as this scientist.
Well- yes, there’s the rub. It is all very well to collect data – and my word, here will be huge amounts of data, stored away in computers. But what good will it ever be? To what use can we ever apply it? Yes, I know that quite often large amounts of continuous data will suddenly show meaningful connections with other quite different sciences in our complicated world – but my imagination does not stretch to figure out how that can be the case here. We know that ice melts in proportion to amounts of heat around it – but so what??
Observing glaciers in “real time”
Given how boring most television programming is today, this might catch on…..
The Glacial Melt Channel
I don’t think it will be as popular as the Gorilla Channel. that just trumps all the rest. 😉
GLAMOS will not be monitoring the death of glaciers. It will be monitoring the death of the catastrophic global warming scare! As the glaciers grow and expand due to the natural climate cycles that have always been present, GLAMOS data will be hard to find. Then the project will be defunded and abandoned.
Jim, the GLAMOS data will probably go the way of the ARGOS buoys – ignored until they figure out some way to “adjust” the inconvenient facts.
Warmists will spend their holiday’s with pick ax and shovels trying to chip away the growing glacier fronts.
“Warmists will spend their holiday’s with pick ax and shovels trying to chip away the growing glacier fronts.”
More likely, they’ll just turn their Microwave Monitoring System from ‘measure’ up to ‘melt’.
So will Glamos be quietly tucked away out of sight when the Glaciers start growing again? By the way what did happen to the continuous record of Co2 in the atmosphere?
It looks like a thorough method to monitor an always changing condition.
Perhaps, just in time for many Alpine glaciers to end their retreats.
However, if one wants to read about an expanding Alpine glacier:
Look up the Taku Glacier, just east from Juneau Alaska. It is the biggest of its kind and is doing a great job in carving out a fjord some 600 feet below sea level.
Geology in action.
Decades ago I was involved with evaluating a Molybdenum prospect on the south side of the Taku River.
Thus, my interest in the region.
PS. The “moly” is still there.
Better get it mined before the glacier scrapes it away. Any Cu or Au with it?
It is a “classic” molybdenum deposit. Like the original at Climax Colorado. However, it is remote and mostly covered by a huge snow field. That was when the price of Mos2 soared from 30 cents to 30 dollars!!!
Stock went from 25 cents to 7 dollars.
🙂
Sorry, the Taku Glacier has started to retreat.
http://www.durangobill.com/TakuGlacier/TakuGlacier.html
(Photos now show the Taku is retreating from its trimlines and terminal moraine.)
Glaciers retreating from terminal morraines = Good.
Advancing glaciers haven’t yet established terminal morraines. Advancing glaciers = Bad.
You’re missing a sarc tag.
This is actually great news. If the Atlantic flips to a colder state and the glaciers start to grow we will have all of it in 4K video!
So far the Tropical North Atlantic is starting to cool. From a record (since 1950 anyway) of 2 standard deviations cold in June and a followup -1.5 in July there is a lot less energy there, especially compared to last year. Whether it is a beginning of a trend remains to be seen, but it’s a start. Cycles happen!
Good grief!
I just had a post on glaciers “disappear”.
It was right above Dave Burton’s on the Sahara.
???
Bob Hoye
Rapid ablation!
I’ll, briefly, try again:
If anyone would like to read about a significant glacier that is, repeat is, growing:
Taku Glacier, just east of Juneau Alaska.
Bob Hoye
Yes, Taku is the largest glacier in the Juneau Ice field. Hubbard Glacier (also in Southern Alaska) is growing, and it is the largest tidewater glacier in North America – (outside of Greenland).
For what it’s worth the Taku is now shrinking.
Which is better than growing.
But far worse than staying the same size.
Where/what is your reference for that??
So…..what do we compare this too? We have no data similar to this on the growth or previous melting of the glaciers. We don’t know what happened as they grew or shrank. I know the data may be useful later on, but generally climate science doesn’t want to wait for the data to come in.
Join the discussion…There are three methods of heat transfer. They are conduction, convection, and radiant heat. Heat transfer to or from the earth can only be done by radiant. All material contains heat and is radiating it to cooler surfaces or absorbing it from warmer surfaces. The difference is the heat gain or loss of the material.
The earth gains heat radiated from the sun and loses heat it radiates to outer space, called black sky radiation. Outer space is considered absolute zero.
The amount of radiant heat hitting the earth from the sun daily is relatively constant. The radiant heat lost daily by the earth thru black sky radiation is constant since absolute zero is constant. The amount of heat gained by the earth’s surface depends on the surface area of the earth covered by water relative to that covered by land. Land area absorbs a larger percent of the radiant heat relative to the water area since the surface of the water reflects a percentage of the radiant heat back to outer space. The daily access heat, or loss of heat, is transferred to the oceans thru conduction and convection where it works its way to the poles and it freezes water adding to the polar ice caps or melts the polar ice caps thus keeping the surface temperature of the oceans, thus the earth, relatively constant. As the polar ice caps grow or melt, the surface area of the earth covered by land relative to that covered by water changes. This is the definition of global warming. I call it Global Ice making and Global Ice Melting.
That radiant heat absorbed by oceans and land masses is transferred to the atmosphere thru conduction and convection. When it is winter in one hemisphere it is summer in the other and the same with spring and fall. I would think the average temperature of the lower 5,000 feet of the atmosphere changes about 10’F to20’F each day. This probably takes more heat than man has added to the earth in the last 50 years. That heat man adds to the atmosphere each day is radiated to the black sky and the infinitesimal amount left helps melt the ice during global warming, should be called Global Ice Melting.
Absolute Zero is -459.68’F and the average surface temperature of the sun is between 7,300’F and 10,000’F. If we could go back in time 18,000 years, the end of the last ice age, we would probable see that the average daily temperature of the earth was in the mid 60’F as it is today. You must understand the amount of heat gained every 24 hours is almost equal to that lost during the same 24 hours. Angle of the earth’s axis is 23.5’.
The average surface temperature of the earth is about 63.5’f. The heat loss to black sky radiation every 24 hours is constant. The average radiant heat striking the surface of the earth is relatively constant. Because the sun is an active star the average temperature will change over centuries. As the surface area of the earth covered by water increases, the more radiant heat is reflected back to the black sky increases. When the daily radiant heat gained by the earth from the sun in 24 hours became less than that lost by black sky radiation we began ice making. Looking at the ice core from the Antarctic we can see that the earth began the new Ice Age about 18,000 years ago.
The Weather Channel just had a piece on a very large section of ice is about to break off a peninsula in the Antarctic. This is be because of the fact that 18,000 years ago the earth switched from Global Ice Melting to Global Ice Making. Since then the Ocean levels may have dropped a foot and the ice has risen around 250 meters in the Antarctic. It seems like that would be a tremendous amount of leverage attempting to break off that ice. The Ocean level was some 400’ lower at the changeover and the 39’ water has been melting the bottom of that ice shelf for the last 73,000 years as the ocean rose. The shoreline has been receding below the glacier for 80+ thousand years. During Global Ice Making, the thickness of the ice, which eventually becomes a glacier is getting thinner. The weight of the new ice is what makes it become a glacier.
The Arctic ice core chart also shows the top 500’ is the beginning of the man’s discovery of fire, thus the increase of CO2 percentage rise in the atmosphere. The chart also shows that as the ocean level drops the CO2 level in the atmosphere drops. This is because the land surface area grows, thus the green foliage increases, thus the photosynthesis, which is how nature removes the CO2 from the atmosphere, lowers the CO2 level. Oceans were about 400’ lower than they are now at the peak of the ice age and global ice melting began. The last ice age lasted about 120 thousand years. That means it took about 60 thousand years to melt the ice, thus the oceans rose an average of 6.67 feet per thousand years.
The only thing I haven’t explained is how they get the date of the end of the Ice ages. It has to do with the ice melting from the top down. They say the last Ice Age ended about 18 thousand years ago. I say that point was ice deposited before the peak of the ice making and which was about 80+ thousand years ago.
As the ice melts the water flashes from solid directly into vapor and is absorbed into the cold, very dry air. This similar to the evaporation of a puddle in the driveway or the surface of the ocean.
I assume they date the ice by using carbon dating. This is on the solids they find in the ice core. As the ice is evaporated the solids are left behind. There is no way nature can take 60 thousand years to make the ice and melt it all in 10 thousand years.
About 18000 years ago the new ice age began. Until the land mass grew enough the carbon dioxide level in the atmosphere kept growing. About 18000 years ago the green foliage was not enough to stunt the growth of carbon dioxide and as the land mass grew the carbon dioxide level began to drop. About 16000 years ago the land mass, and green foliage, was enough to overcome nature. 8000 years ago, man plus nature began to make more carbon dioxide than the growth of green foliage could overcome and the carbon dioxide began to rise until present.
1)”Heat transfer to or from the earth can only be done by radiant. ”
Well that isnt even true if you are only talking about actual land surface. Conduction from top surface layer goes on all the time.
2) “Outer space is considered absolute zero.”
It is between 2.73 and 3 degrees Kelvin. However that is outside the solar system. So because you were talking about the temperature immediately beyond the exosphere, the temp range in the thermosphere where the space station is ; is 173 K to 533K depending on whether you are in the direct sunlight or in the shade. The temperature in the exosphere will be colder than that however Pluto’s surface temperature is 33K. So the temperature of the region beyond the exosphere has to be between 33K and 173K That is a lot warmer than you were implying.
3) “The radiant heat lost daily by the earth thru black sky radiation is constant since absolute zero is constant.”
That amount is not constant. NASA have been measuring it for decades. Besides your reasoning because of absolute zero being constant is NONSENSE.
4) “since the surface of the water reflects a percentage of the radiant heat back to outer space.”
You should have added that the reason is; that the sun’s angle varies with latitude. At the tropics very little of the solar gets reflected.
5) “The daily access heat, or loss of heat, is transferred to the oceans thru conduction and convection where it works its way to the poles and it freezes water adding to the polar ice caps or melts the polar ice caps thus keeping the surface temperature of the oceans, thus the earth, relatively constant.”
Convection has nothing to do with heat transfer in water. The surface temperature of the oceans varies all the time.
6) “As the polar ice caps grow or melt, the surface area of the earth covered by land relative to that covered by water changes. This is the definition of global warming. I call it Global Ice making and Global Ice Melting.”
There is no land in the Arctic icecap. You are the only person in the world that has that definition for global warming. Ice on water is not land.
7) “The heat loss to black sky radiation every 24 hours is constant.”
It varies as does the amount of solar varies.
8) “This is be because of the fact that 18,000 years ago the earth switched from Global Ice Melting to Global Ice Making. Since then the Ocean levels may have dropped a foot and the ice has risen around 250 meters in the Antarctic.”
Ocean levels have been constantly rising for last 18000 years.
9) “During Global Ice Making, the thickness of the ice, which eventually becomes a glacier is getting thinner.”
How does ice making make ice thinner? Glaciers move by gravity and changes in temp of freezing and melting.
10) “As the ice melts the water flashes from solid directly into vapor and is absorbed into the cold, very dry air. This similar to the evaporation of a puddle in the driveway or the surface of the ocean.”
You are talking about sublimation. However there is much more water than ice on the earth. The amount of latent heat gained through evaporation dwarfs the amount than that through sublimation. Sublimation involves some of the ice going directly to water vapour and some going to water and then to water vapour through evaporation. Evaporation and sublimation are only similar because both end up in water vapour. Other than that they have nothing to do with each other.
11) “There is no way nature can take 60 thousand years to make the ice and melt it all in 10 thousand years.’
Why not. It all depends on temperature differences.
Alan Tomalty
Small correction on your comment about the earlier 7) above.
LW radiation Heat Energy LOSS from the earth’s surface does occur continuously from the every part of the earth’s surface back up through the atmosphere to space. (You and I disagree on the “effective radiation temperature” of near-earth space, but let’s cover that separately from this one.) The outbound radiation depends on the surface temperature of each sq kilometer radiating outbound, the emmisivity of that sq kilometer, the direction of that surface back towards space. So, the amount of LW radiation energy lost per sq meter increases when open water at 2 to 4 degrees is radiating into the same sky and space that the far colder surface of sea ice at -35 deg C is radiating.
Equally, if sea ice is present, the surface emmisivity of sea ice and open water is nearly the same as if open water is present.
Wind has little effect on LW EMMITTED. Wind and humidity greatly affect the re-radiation of LW back towards the surface.
Now, the RETURN radiation back towards that same sq kilometer depends on the assumed temperature of the re-radiating body: Depending on what reference you read, this could be the ) K temperature of infinite space, the 3 deg K “temperature” of the residual Big Bang gasses, the near-earth assumed space, the high clouds above earth (35-40,000 feet temperature of the air), the 2-3 meter air temperature (with all of its associated pressure, relative humidity, and cloud cover factors.
But the emmission of LW radiation is constant over 24 hours if open water is present, and is constant if sea ice covers that water. But those two energy losses are very different.
I was interpreting the original posters comment that it was always constant from day to day.
Join the discussion…During Global Ice Makingthe thickness of the ice, which eventually becomes a glacier, is getting thinner from the bottom and replaced by 39″f water.
Interesting discussion above, about ‘heat’
What is ‘heat’ &where does it come from? perhaps an infantile question ?
Space is said to be about 1or 2 degrees above – 273* C, or 1*K(absolute zero) which is extremely cold of course .So ,we say ‘heat ‘ or what we call heat is felt by us when for example sunlight or sun’s ‘rays’ fall on our skin .This is our ‘interpretation ‘of that effect as” Wow its hot in the sun”,so,what do we do? we go into the shade if possible.( there are a few other things like e.g.electric fire radiant bars,coal ,wood &gas fires volcanic magma etc.that give similar effects of course .) ,Astronauts would , apparently, rapidly freeze to death outside of their craft/capsule&need to wear heated insulated suits to do so safely, in order to survive .Hm. but in the direct path of the sun’s rays they would equally boil or at least overheat without that protection .So a naive question?where is the heat?what is ‘it’. ‘Is it actually’ intrinsically ‘ within’ the suns rays ?are they ‘hot ‘? or is it an external effect,caused by the rays affecting the molecules of the person or object such that we discern it as & call it ‘heat’ ? ‘heat’which wasn’t there before hand, until the sun rays became blocked or obstructed by the substance or object.so I ask again my somewhat naive question ,What,actually , is’ Heat’.? how do we define it?how is it caused?
My very 1st day of Thermodynamics Class: From a thermodynamic standpoint, there is no such thing as “cold”. There is only heat, or less heat…
So now, next time your Mom tells you to close that refrigerator door, you’re letting all the cold out, you can reply with, my photographer told me to close the door to his dark room, or all the dark leaks out! See, NOW you get it! 😀
Why are the liberal left greenies worried about a dead, lifeless frozen piece pf land ?
“From 2019, Switzerland will for the first time be able to”…
…get all neurotic and paranoid over something that’s normal and they can do nothing about
I’m of the impression that the ice fields on the north side of Glacier National Park (MT) have been relatively stable for over 100 years. I got the impression from a Glacier NP website that has been taken down. Its replacement has no mention of the stable fields.
Now, my point is, if ambient air temperature alone were responsible for the retreat of glaciers, one should expect all the glaciers to retreat equally. On the other hand, if there were a decrease in alpine cloudiness, then one should expect glaciers on south-facing slopes to be affected most strongly because of increased insolation.
The data from GLAMOS might shed some light on this issue (pardon the metaphorical pun).
The glaciers at Glacier NP have been retreating since the late 1800’s. However, they formed after the Holocene Climatic Optimum and reached their maximum extent in the late 1800’s.
Most North American valley or alpine glaciers formed after the Holocene Climatic Optimum and advanced up until the mid to late 1800’s. The fact that they stopped advancing and began retreating is a “good thing.” 🙂
Advancing glaciers: BAD!
Retreating glaciers: GOOD!
The glacier in the Humble Oil advertisement is Alaska’s Taku Glacier. The advertisement ran in the Feb. 1962 issue of Life Magazine.
See https://billmoyers.com/story/exxonmobil-more-than-fifty-proud-years-of-melting-glaciers/
The photo of the glacier dates back a few decades further to an estimated 1935 to 1940 era. By 1950 the terminal moraine in front of the Taku had built up enough so that the Taku was no longer calving icebergs into Taku Inlet. Thus the photo has to go back to before 1950.
The estimated 1935 to 1940 date is based on the position of the glacier vs. the Brassier Hills on the right edge of the photo.
The Taku continued to advance up to about 2014 as the terminal/push moraine protected it from oceanic calving. (Even though the earth was warming, the loss of calving ablation meant that total melting decreased more rapidly than the decrease in snowfall accumulation. Thus the Taku grew while most other glaciers were shrinking. 2014 looks like it will mark the end of the advance as recent photos show it starting to retreat.
A complete history of the Taku along with a mathematical model for its past and future behavior can be seen at http://www.durangobill.com/TakuGlacier/TakuGlacier.html
I wipe away a nostalgic tear… I lived in Humble, Texas for 13 years!
The whole story of the Aletsch glacier has been recorded and is not unprecedented, in fact, it confirms MWP nicely

Translation:
Growth and shrinkage of the Aletsch glacier in Switzerland
Vertical axis: shortening relative to 1950 (m)
Horizontal axis:year
isn’t it relative to 1859?!?
Correct, my bad.
and adding the glacier retreat after 2000 you would see that meanwhile the terminus of Aletsch Glacier is now higher than it was during MWP. Assuming the graph you show is correct, when adding the “retreat” figures from 2001 on we would be now somewhere between 3700 and 4000 m retreat after 1859. This would surpass the terminus at roman times.
Correct, we also see a dramatic reduction of aerosols since 1980 and a global brightening, which indeed stimulates the current warm period.
Interesting, but hardly alarming.
Interestingly enough, experts have confirmed the winter of 2017-18 as the snowiest on record. Which means all of that snow is the first salvo in rebuilding the loss of glaciers in the Alps in general and Switzerland specifically.
Weahter in 2018 was eating away the excess snow early in summer: Glacier have as little Firn as they had last year on this date.
What is not said in such reports -but one can see:
here are new buildings in mud floods deep in the valley
where since men’s memory nothing was built –
for good reason!
https://www.bbc.com/news/amp/world-europe-41049827
Same old, same old-
THE WAXING AND WANING OF GLACIERS.
Mount Alexander Mail (Vic. : 1854 – 1917) Thursday 1 January 1885
COLLAPSE OF ANOTHER SWISS GLACIER. London, July 15.
Evening Journal (Adelaide, SA : 1869 – 1912) Saturday 16 July 1892
The Swiss Glaciers Decreasing.
Australian Town and Country Journal (Sydney, NSW : 1870 – 1907) Saturday 29 December 1900
Alpine Glaciers Disappearing.
Australian Town and Country Journal (Sydney, NSW : 1870 – 1907) Saturday 16 August 1902
SWISS GLACIERS SHRINKING.
Newcastle Morning Herald and Miners’ Advocate (NSW : 1876 – 1954) Saturday 24 June 1905
The Earth Warmer: Glaciers Disappearing.
Northern Star (Lismore, NSW : 1876 – 1954) Saturday 9 June 1906
SHRINKING GLACIERS.
Evening News (Sydney, NSW : 1869 – 1931) Friday 13 December 1907
GLACIERS DISAPPEARING.
Sunday Times (Sydney, NSW : 1895 – 1930) Sunday 26 July 1908
GRAVE NEWS ABOUT GLACIERS.
The Catholic Press (Sydney, NSW : 1895 – 1942) Thursday 18 May 1911
MELTING GLACIERS EXPERTS MEASURE MOVEMENT
Lithgow Mercury (NSW : 1898 – 1954) Wednesday 30 December 1931
SHRINKING ICE IN SWISS GLACIERS Cycle of Movement
The Canberra Times (ACT : 1926 – 1995) Monday 31 December 1934
GLACIERS WON’T BE LONG
The Tribune (Philippines : 1932 – 1945) Thursday 22 August 1935
Glaciers In Alps “Slowly Dying”
Newcastle Morning Herald and Miners’ Advocate (NSW : 1876 – 1954) Saturday 22 April 1950
Awesome selection of truth. This should be permanently posted on the site!
When it comes to understanding climate change in europe then l think its wiser to look at what was happening outside of europe. Because although the ice sheets did extend across europe during the last ice age, l don’t think it was europe that was the source of this cold. But rather it was simply the cold getting exported into europe by the weather patterning. lt was NW Russia which was where the real source of the cold was.
lf this is the case then l think this could have a important bearing on climate change in europe. Because with the ice free waters around NW eurasia thanks to the gulf stream. Rather then this saving us from a ice age it could end up been part of the process that helps to tip europe into a ice age.
Gee, the graphic with this footnote, “The coloured lines show where the edge of the Aletsch glacier once was (red line 1850, green=1973, blue=2010). (Graphic: Swisstopo/GLAMOS)” seems to indicate rather clearly, that most of the recession occurred before 1973 (from 1850). This is prior to the consensus view that there was a significant – perhaps, even measurable) human footprint on global temps – AGW.
Pretty much like this shows: Swiss Alps – 120 glaciers
Also since 2010 the ice sheet has remained largely the same or even grown slightly.
Once and for all, could we have dates for the Medieval Optimum Period and the Little Ice Age?
Is there a map of this?
Not the glaciers in the european alps (yes you were were bringing “ice sheets” into the discussion).
The gap between red and green is 125 years, the gap between green and blue 37.
From Wiki I took the top 44 glaciers in Switzerland out of the total of 1500. They all have retreated since 1973 to 2016. However the total retreat has been 34.38 km over that 43 year period. That is an average of 0.8 km per year or 0.78 km per glacier . That works out to 0.278 % decrease in length per year as an average overall for the 44 glaciers. Based on that average it will take 360 years for those 44 glaciers to completely disappear. In 2013 it was found that in most of them the decrease was slowing down. Even if all 200000 glaciers in the world completely disappeared the sea level would only rise 400mm. What in the hell are we worried about?
Thank-you Alan Tomalty,
If I could I’d vote +10.
Nice to see another person understands that melting glacier ice is no big deal, and humans can easily adapted to it. Indeed ice melting in the NH is no big deal.
“In 2013 it was found that in most of them the decrease was slowing down.”
https://wgms.ch/latest-glacier-mass-balance-data/
Could you just open more clearly what does that plus/minus mm water equivalent mean in reality? Is it a thickness of a glacier?
mm water equvalent multiplied with 1.09 will give you the thickness og glacier change averaged over all of the glacier area. Keep in mind: the upper part of a glacier often gains mass the lower part is loosing, The graph shows average over all glacier areas.
clos to 22m or approx. 70 ft of ice lost.
Meaning that it will take about 100 years till the glaciers ane all melted?
Why should all Glaciers melt? In some of the glaciers in the Europena Alps they detected ice more than 7000 years old.
A considerable number of glaciers will dissapear, most will shrink. If you take average values for predictions you will end up with rather mediocre results.
The melting or disappearance of Swiss glaciers is one of the few areas where I will admit my emotions get the better of me. To me, the Alps are just not the Alps except where they have a permanent snow cap. I feel a bit like Bilbo Baggins not able to find rest until he could see the Misty Mountains again.
But of course, the agricultural peasants who lived under the threat of the advancing Alpine glaciers during the Little Ice Age had good cause to take a less romantic view. And that is indeed the problem, when global warmers take only a romantic view of what they think climate is or ought to be.
the most interesting way to check out the bossons glacier https://www.youtube.com/watch?v=neFCXFdUwAU
New data just out on glacier melt in the Alps–drip, drip, drip.
This makes sense, because they’re primarily concerned with the rivers.
Is GLAMOS just GLADOS with better fashion sense?
“Glacial melt affects the flow rate of our rivers, which makes it a relevant factor in natural catastrophes, disaster prevention, the power supply, transportation, tourism, building sites and not least glacier research.”
If glaciers were growing, what would that do to the flow rate of your rivers? I think that would be much worse than melting. At least with melting, you still get flow from rainfall.
The only thing glaciers are good for is summer skiing, and even that is of questionable quality. SO really, what is the fuss?
I’ve seen stuff in the past something to the effect that indigenous peoples who live at the edge of glaciers rely on using glacial ice for water (they chip off a block or two at a time and take them back to their villages).
As I mentioned above, if glaciers were growing, that would be the end of their villages. If shrinking, they would have more fresh water from lakes and streams that form, and from regular rainfall, since they won’t know what snow is any more.
I strongly doubt that any indigenous peple are stupid enough to settle at the edge of a glacier.
Actually, glaciers aren’t any good at all for skiing. Too hard for your skis to get a bite, too rough in general.
“Since then, the country’s 1,500 glaciers – as well as others elsewhere – have been suffering a slow but inexorable death. ”
Hasn’t that been happening since the last ice age?
No they actually mostly died about 10,000 years ago, only to be resurrected about 4-5000 as the climate cooled.
Observing glaciers in “real time”
Is this the new PC equivalent of “watching paint dry”?