Guest Essay by Kip Hansen
 Damien Cave, the NY Times Australia bureau chief, writes yet another heart-rending story with great personal touches about how the Solomon Islands are being “swallowed by the sea”. His latest offering is titled: Solomon Islands Dispatch — His Pacific Island Was Swallowed by Rising Seas. So He Moved to a New One.
The story is about a seaweed “farmer” who grows a particular ” wiry breed that’s exported across Asia.” The seaweed grows in the shallow water around his “island”. Calling it an “island” is a bit of a stretch — it is really a sand spit or sand bar, “At mid-tide, it’s 24 steps across at its widest point, and 58 steps long.” [ Note: this is not a coral atoll — just a pile of sand, maybe over some bit of rock.] Of course, The Sea Weed King’s first sand spit got washed away by the currents, so he moved to a new one. Here’s what it looks like:

We’ll have to guess what the elevation above Mean High Water is, the Times doesn’t tell us, but is certainly isn’t more than a foot or two.
Now, you can read the whole story in the NY Times (linked in the first paragraph) — but here’s the thing — the Times repeats this oft-echoed falsehood:
“Scientists call it a global hot spot. The surrounding seas have risen about 7 to 10 millimeters per year since 1993, roughly three times today’s global average — and what scientists expect across much of the Pacific by the second half of this century.”
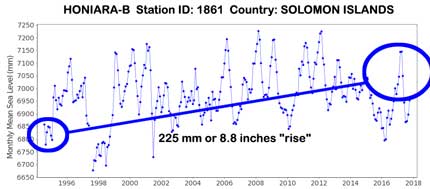
They get that impression from someone looking at graph like this:

That’s right — my golly — 225 millimeters in 25 years — that’s 9 mm/yr!
Oh my — I won’t say it — I won’t. I will not call this F… News.
I will, however, supply a more pragmatically annotated graph of the NOAA-listed Tide Gauge in the Solomons:

Experienced readers will see right away (have already seen in the first graph) how a big rise has been made out of highly variable data. The data is extremely variable — 18 inches of variability, which is about the same as the normal daily tides in the Solomons. In fact, over the last 25 years or so, Mean Sea Level at Honiara has soared and fallen over an 18 inch total range, ten times or so. Even if we insist on using the apparently somewhat outlier date of 1993 (far left) we can only squeak out a 4 inch rise comparing to range for 2015-2016 (a 6 month peak in 2017) and 2018.
A reverse-bias view would be something like this:

The truth however, is the bare raw data for Honiara-B:

When we have the raw data graph (this is monthly MSL) a trained observer can see what the real situation is. We suspect that an equipment move or change made the break in 1997 sometime.
Drawing “trend” lines over times series graphs is itself a form of bias, constructed from the choice of start and end dates. I have already demonstrated that the “alarming rise in sea level” in the Solomons is a construct of such choices and presents an entirely false image of the situation. Likewise, selecting mid-1990s to early-2018 is equally biased, but in the opposite direction.
The graph immediately above is what we really know about sea level changes at Honiara-B — there has been a very wide range of variability over the last 25 years. Mean Sea Level at Honiara-B is currently running low in the range, not high.
How one finds out about all this is to go to the PSMSL website and find the PSMSL page for Honiara-B station in the Solomon Islands. There is a lot of information there, but the data authority for Honiara is actually the National Tidal Centre in Kent Town, South Australia. The National Tidal Centre page for Honiara offers downloads of yearly data.
# # #
Of Note: The New York Times article quote used above contains this: sea level has “risen about 7 to 10 millimeters per year since 1993, roughly three times today’s global average — and what scientists expect across much of the Pacific by the second half of this century.” This links to a very interesting 2015 paper titled: “Coastal vulnerability across the Pacific dominated by El Niño/Southern Oscillation” in NATURE Geoscience by Patrick L. Barnard et al. It is a mystery to me why they used this as a reference as this paper does not make any predictions for mean sea level rise for the Pacific, none, at all. It does, however, say this:
“Upper-end sea-level rise scenarios [IPPC projection scenarios] could displace up to 187 million people by the end of the twenty-first century1, with flood losses exceeding US$1 trillion per year for the world’s major coastal cities by 2050 (ref. 2). However, prior studies typically omit key oceanographic components of water level elevations during storms that drive severe beach erosion and flooding of coastal communities, and can be highly temporally and spatially variable. As the climate system evolves nonlinearly, so too will the spatial distribution of mean and extreme wind speed, wave height, period and direction, water level anomalies, and resulting coastal response, as is evident from trends observed over the past two decades.”
and
“We find that observed coastal erosion across the Pacific varies most closely with El Niño/Southern Oscillation, with a smaller influence from the Southern Annular Mode and the Pacific North American pattern. In the northern and southern Pacific Ocean, regional wave and water level anomalies are significantly correlated to a suite of climate indices, particularly during boreal winter; conditions in the northeast Pacific Ocean are often opposite to those in the western and southern Pacific.”
# # # # #
Author’s Note:
Journalists should do their job. They should check the most pertinent facts for themselves — in this case: Is sea level really rising 7-10 mm/yr in the Solomons?
Finding out that it hasn’t and isn’t makes a much more interesting story than “yet-another-alarmist-talking-point”.
Do note that while coral atolls are generally self-regenerating, sand spits/sand bars are not — they are at the mercy of the currents and waves.
Thanks for reading.
# # # # #
Quick Links:
expect across much of the Pacific
PSMSL page for Honiara-B station
National Tidal Centre page for Honiara
expect across much of the Pacific
Coastal vulnerability across the Pacific dominated by El Niño/Southern Oscillation
# # # # #
This story is idiot-bait. You measure sea rise during an El Nino in the Solomon Islands (which as a whole will be around for another 10M years) and claim panic? Did you try this year when the weather condition is La Nina and claim the land is rising? Or the seas receding?
Because that is what the measure shows.
In fact you have it backwards. The hot Nino years of early 2000s show lower sea levels in West Pacific Solomon Islands. The “super el Nino ” of 1998 is a notable trough in the data. The building El Nino from 2012-2016 also shows a drop.
This graph seems to be a fairly good proxy for ENSO cycles, if someone has the time to plot the two.
Warmer surface water accumulated in WPWP spreads eastwards during El Nino and causes a warm anomaly in tropical Pacific SST. This is reflected by a drop in MSL at sites like the Solomon Islands.
The Times article can easily be show to be fiction by plotting the data and showing linear regression instead of cherry picking two points and joining them together in MS Paint .
It should also be quite obvious that water levels at some point on the globe can not keep rising three times faster than the global average. It’s a pretty stupid proposition which even an uneducated person would question.
Also worth remembering is that coral bleaching occurs during strong El Nino, because of sea level fall, and the Indian Ocean is also impacted.
This graph from Bob Tisdale illustrates the impact of the 97/98 El Nino on Indian Ocean sea level.
http://tinypic.com/view.php?pic=huiyko&s=4#.W1rYci1L2i4
I advise to not use this link in the above post as there is a Trojan in a link on that page. If the ominous voice comes up then do not do what it says.
Good practice for being skeptical. Don’t do what the ominous voice tells you to do!
Especially if it is the stentorian tones of Al Gore.
I’ve always been a sucker for the old ominous voice scam – I think it dates back to an episode of the original Star Trek
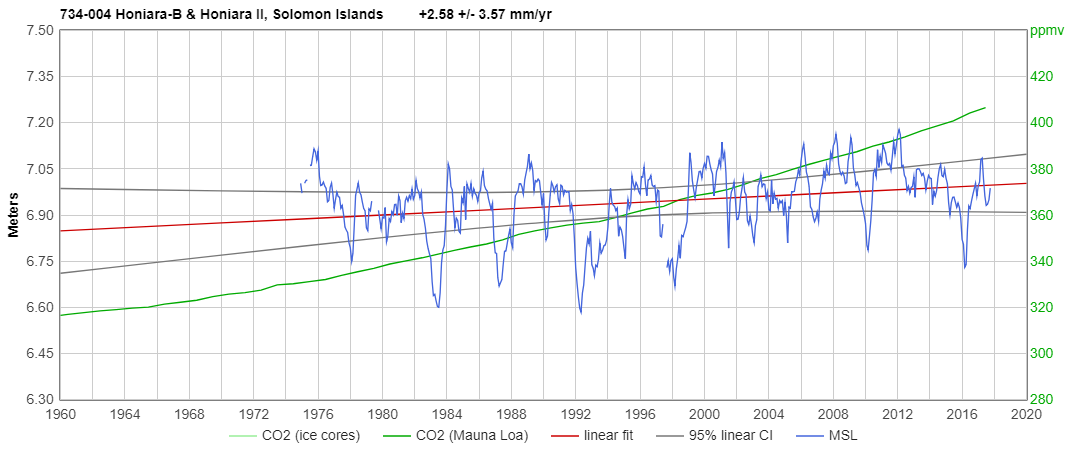
Here is a correctly done linear regression of the Honiara-B data

Surprise surprise, the mean rate of sea level rise is 3.41 mm/ year .
Greg ==> As with all Tide Gauge Sea Level measurements, one can not draw too many conclusions, especially on multi-decadal scales, without knowing that the land is doing – – – Vertical Land Movement. There is not yet any dependable (robust) measurement for Honiara at the present time. That means we don’t know if the land has been rising and falling over these decades.
Eventually, all important Tide Gauge stations will have a “GPS@Tide Gauge on the same structure” and we will be able to properly determine the changes in both land and sea surface levels.
The only thing Honiara needs to worry about is Relative Mean Sea Level — sea surface compared to land surface. It appears that this swings wildly over a range greater than 18″.
Hi Kip, I agree about all the caveats, I was just showing that however the authors arrived a 7-10 mm / y it was BS. Linear regression provides the best fit of a constant rate of rise for that data. and it is half to one third of the range cited.
That would be the most scientific way to rebut their claim. Maybe you would like to add that graph and the true rate of change as an update at the end of the article.
Solomon Islands are in a “hot spot” in the sense that it is some of the warmest SST on the planet. It is NOT a “hotspot” for sea level rise. It is totally average.
In fact if you start after the anomalous drop caused by the 1998 “super” El Nino, there is no statistically meaningful trend over the last 20 years. ( insignificantly negative. )
Greg ==> You are exactly right — the paper linked by the Times is about that very issue, even if it does nothing to support their claim of 7-10mm/yer SLR.
But if you go back another 20 years you find that sea levels have actually fallen a net 6 inches [150mm]
http://www.psmsl.org/data/obtaining/stations/1373.php
Sea levels in this part of the world vary depending on the strength of the trade winds.
Kip, the rise is totally bogus science. See graph above, linear regression gives 3.4 mm/y with that data. That is totally in line with global averages. No sea water piling up ever higher in WPWP.
“It should also be quite obvious that water levels at some point on the globe can not keep rising three times faster than the global average.”
…and those same places match gravity maps
Latitude ==> The important metric — Relative Sea Level — can rise far above the global average and does in many places as the land moves vertically in a downward (towards the center of the Earth) direction.
Sinking cities have real problems and need to take action to protect themselves — Hint: Emitting less CO2 does not stop negative Vertical Land Movement.
Hint: that has nothing to do with gravity maps
Unless of course they are Climate Correspondents for the BBC who fall over themselves to tell us about places with high “sea level rise”. I am aghast at the deliberate and disingenuous way in which the issue of relative sea level is dealt with by people (and their agents) who have snouts in the climate troff. Interesting how they ignore completely the most obviously and most sensitive place of all in Europe….The Netherlands…Strange that! The lack of scientific rigor in the prosecution of research around sea level indeed a large part of this trillion dollar a year scam is deliberate and Joe Public is just told “believe”. Isostasy and eustasy figure nowhere in the calibration of any sea level data I have been party to. The fact that media outlets like the BBC can brazenly promote alarmism with downright lies connecting problems for example in Miami or the Mekong Delta to climate change supposedly quoting “scientists” is an insult to all normal scientists working outside the smoke and mirrored world of climate “science” for whom professional integrity and ability dictates employability. Indeed, I find it more and more difficult to put the words climate and scientist together. When your livelihood depends on the Climate Merrygoround your integrity MUST be in question until proven otherwise. Climate “activist” is a better term and frees the rest of real science from this embarrassment!
…..You have to admit that it likely does a very good job of reinforcing existing idiocy.
If you look up the definition of a spit or bar you will find that “ephemeral” is part of the definition.
Mike ==> e·phem·er·al əˈfem(ə)rəl/
adjective
adjective: ephemeral
1. lasting for a very short time.
(Definition supplied to benefit the trolls….)
The Swallowmon Island.
https://en.wikipedia.org/wiki/Geography_of_the_Solomon_Islands
Terrain: Mostly rugged mountains with some low coral atolls
Elevation extremes:
lowest point: Pacific Ocean 0 m
highest point: Mount Popomanaseu 2,332 m (7,651 ft) (not Mount Makarakomburu)
I suppose most NY Times readers have never been there and are to stupid to look for information on the internet.
off course they’re “too stupid to look for information”, they’re NY Times readers so it goes without saying. 😉
Remember the battle for Guadalcanal 1942-43. For six months US Marines and Japanese troops fought over the control of Henderson Field on the north coast of the island. Whoever held Henderson Field ruled the skies over the Eastern Solomons because it was built on the only piece of land flat enough and big enough for an airfield in the whole Eastern Solomons.
tide-forecast shows that Honiara has tides of 0.8-1.0 meters and on top of that they expect swells of 0.8 meters for next week. And that is without any big storms passing by.
So who gives a frack about an adult actors length per century of rise. Another industry that is known for it’s exaggerations.
Oddly enough, NOAA has data for that location going back much further:
http://sealevel.info/MSL_graph.php?id=1861&g_date=1960/1-2019/12&c_date=1960/1-2019/12&s_date=1960/1-2019/12&datasource=psmsl,noaa
Linear trend = 2.576 ±3.571 mm/yr
Acceleration = 0.284 ±0.635 mm/yr²
The midrange value for that linear trend is slightly higher than the global average, but certainly not worrisome. 2.576 mm/yr for 84 years would be 8.5 inches of sea-level rise by year 2100.
In spite of the alleged trend lines; that graph looks darn near unchanged over 45 years.
Notice how sea-level falls in the western equatorial Pacific during El Niño events. That’s because the east-to-west (“easterly”) trade winds weaken during El Ninos, causing the ocean water to slosh east. So at San Diego, Calif., the opposite happens: sea-level spikes up during El Niño, and drops during La Niña.
Worth noting that the R-Squared is 0.083 and the error is 1 mm/yr larger than the linear trend, so the actual trend could be -1 mm/ yr. My statistics prof. would have said a 0.083 R-Squared means the data sets are unrelated.
Nice response, Dave! I note the quote “The surrounding seas have risen about 7 to 10 millimeters per year since 1993,…”
As I do not recall any tide gauges present in the “surrounding seas” it can mean only that satellite altimeter numbers make up the numbers furnished in the claim. They do not have the resolution to validate or verify these and thus are not empirical data. The tide gauge is, and the result is stunningly clear!!!
With actual trend error factor larger than the trend itself and the acceleration error factor more than double the acceleration itself, this data is worthless.
“However, the conventional SAR interferometry only can achieve meter level height accuracy. This paper focuses on a method of radar echo-tracking for InSAR altimeter system in order to correct the slant range measurements and finally to improve the height measurement accuracy to several centimeters’ level.”
Resolution of several centimeters at best. These people lie, cherry-pick, and bamboozle, for a living apparently, sad…
Dave ==> The pragmatist in me says that with data with that degree of variability, drawing any statistical trend line is spurious — at least doubtful — as the start and end point have been selected by the date when the data set starts, the present, and the dates of the El Ninos. I know — your figures are for the whole data set and not as sensitive to the dates…but still….
I know that stats people believe that these types of exercises are valid and actually tell us something about the real world….but I’m not one of them. Precision to 1/1000ths of a mm?
What we do see is that as far back as the record extends, to the 1970s, sea level was as high/a bit higher than it is today.
So in 50 years, there has been no cumulative change.
That said, your work confirms that there is nothing unusual about SLR in the Solomons.
Dave,
Just looking at your graph I’d say a linear trend before 1998 and another after 1998, before and after the probable instrument change, would both be pretty close to zero and possibly even below the global average. The jump after 1998 is fairly obvious.
I agree with y’all that short-duration records like these are of dubious value for trend determination. You really can’t even say with certainly that sea-level is rising at all there, over the long term. That’s why I dislike the practice of many sea-level specialists, of using data from large numbers of short-duration measurement records, rather than a smaller number of high-quality, long-duration records, like these:
That said, I wouldn’t go quite so far as to say this Honiara data is completely useless.
For one thing, it could be cleaned up a bit by adjusting for the obvious ENSO influence, just as we routinely adjust for predictable seasonal variations (annual cycle).
There might also be a bit of PDO influence evident in that record. To my eye, there appears to be a slight inverse correlation with PDO. From mid-1970s to late 1990s sea-level tended to the low side, while PDO was positive. From mid-2000s to early-2010s sea-level tended to the high side, while PDO was negative. Here’s a PDO graph:
http://research.jisao.washington.edu/pdo/pdo_tsplot_jan2017.png

Kip, w/r/t/ reporting too many digits of precision, that’s my longstanding practice if-and-only-if a confidence interval or error margins are also explicitly reported. Discarding insignificant digits is really just a crude shorthand for implicit confidence interval reporting. Reporting a few extra digits (along with the confidence interval!), avoids adding additional errors from rounding artifacts, and explicitly reporting the CI avoids conveying an erroneous impression about the precision with which the quantity is known.
Dave ==> Everything you say is probably right – though the “adjusting for” mania simply calls for ignoring the data as it is.
I personally feel — eye-gut-mind reaction — that the Honiara data is the result of non-linearity (-ties) in the interactions of climate and geophysics that affect sea level in the South Pacific. Trying to adjust for chaos-induced noise is very difficult to “a fools errand”.
The question we’re trying to answer is: Has the sea been rising in Hoiniara (in respect to the land)? The answer-apparent — “yes — quite often actually — by about 18 inches — then it drops back those 18 inches only to rise again.” The future? I predict “more of the same” — the best-bet forecast for questions under great uncertainty and little understanding.
Dave B. uses the PDO in his comment.
Perhaps there are new readers here that are not familiar with the PDO, nor with Bob Tisdale’s posts on the topic. They are worth reading.
Below is a link where he wrote:
“. . . the PDO does not represent the Sea Surface Temperatures of the North Pacific.
1 of numerous posts
If you look at the middle of the end ranges you get a ‘trend’ from about 6900 to 7000 so about 100 mm over say 24 years at most.
I saw a similar ‘kiddy fiddling’ of data based on Port Jackson (Fort Denison in Sydney Harbour) data since the late 18th century. The data had a distinctive periodic variation which was the PDO signal. The data started on a PDO ‘trough’ and finished on a ‘crest’. Lo and behold!!! an uptrend. You would have got the same for data created by a pure sinusoid!
These ideological loons just cannot help themselves.
They could help themselves if tgey had integrity.
That is a characteristic in extremely short supply in the evangelical world of CAGWarmism. Its almost an endless drought.
Quite apart from the cherry-picked ‘elevation’ over two decades cited by the NYT reporter, I was struck by how many times the average Solomon Island sea surface had either risen (or plunged) about that same full foot over the course of just a year or so. Gave me motion sickness just following it with my gaze; or perhaps the feeling was due to once again getting jerked around by some pretend “journalist” in the current death spiral of a once proud profession in the informative service of their fellow citizens? America wants to know.
It makes me think that the rapid changes in each year are more due to atmospheric pressure systems causing localised swells and troughs. Movement like that isn’t even seen on active volcanoes.
Doc ==> The oceans are not still — they are not like water in a bathtub whose level remains steady until water is added or taken out. Sea Level is a nonlinear result of complex climate and geophysical factors. The paper mentioned at the end of the essay addresses this.
You are spot on — sea level in the Solomons is surprisingly variable over time scales of years and decades, and shows no particular tendency up or down — with sea level now being a bit lower than 1976.
These island stories come and go in cycles. Have done for decades.
https://chaamjamal.wordpress.com/2018/06/15/history-of-the-global-warming-scare-chapter-6-2005-2010/
Yes. Yes it is, because they say it is.
Somehow, only “scientists” know how a “hot spot” can be global and only in the Pacific at the same time. I wonder what brand of dihydrogen monoxide they’ve been drinking?
The stupid continues to burn.
The sooner Trump’s space troops take out the moon – the safer these people will be.
I can do that with my thumb. Look out the window.. See? All gone. /sarc
Thanks for saving all those poor children
You could prophet from being a god.
I’d rather “profit”, thanks. But who says I’m not? I’ll rain fire and brimstone down on them. Grr..
Natural erosion and accretion can be very large. link People insist in building near the shore and every year folks lose their valuable property to the sea. This has been going on for centuries. In spite of this the world’s great harbors continue to exist.
Perhaps you should remove the ”guess” of broken or moved equipment in 1997, anyhow there is no Evidence of broken equipment, but opposite exists, namely following study. According to this study there was a high negative (reverse) Anomaly ( -30 cm/s) of Western intense boundary currents (WBCs) during 1997 related to ENSO. At least it indicates Sea level change during the event – see e.g. picture 9b from http://www.legos.obs-mip.fr/members/gourdeau/my-filing-cabinet/altisolsea/altipapier.pdf?lang=fr
Harri ==> Thanks for the link to the Solomons circulation paper.
My comment about 1997 is not to the odd value (the drop in sea level) but to the break (missing month(s)) in the data set.
Asking that journalists check their facts before writing their news report supposes that they are actually writing the truth. Corporate news is just propaganda, and has nothing to do with the truth. Its all about advancing their agenda.
Journalists don’t check facts these days. They usually just copy & paste whatever press release is dropped on their desks.
Many journalists these days think that a degree in media studies entitles them to pontificate on scientific matters.
TO ALL AND SUNDRY :
HELLO !
I understand the care and effort you expend in YOUR meticulously REASONED ,
LOGICAL , SENSIBLE presentations of THE FACTS…BUT….THIS DOESN’T MATTER !
xxxxxxxxxxxxxxxxxxxxxxxxxxxxxxxxxxxxxxxxxxxxxxxxxxxxxxxxxxxxxxxxxxxxxxx
LAZY , INCOMPETENT news reporters , editors and “green-washed” LEFTISTS
DON’T GIVE A DAMN ABOUT THE FACTS !
IF they think that they can create a “sensation” then they will report
what-ever serves THEIR purpose !
THE WRETCHED RESULT IS THAT EVEN MY “EDUCATED” and otherwise
intelligent friends and acquaintances STILL QUOTE AT ME:
“THE SEA LEVEL IS RISING AND ISLANDS ARE SINKING ( like Atlantis !! )
AND ALL THE GLACIERS AND POLES ARE MELTING !
……………….AND 97 % OF SCIENTISTS CAN’T BE WRONG !! ”
xxxxxxxxxxxxxxxxxxxxxxxxxxxxxxxxxxxxxxxxxxxxxxxxxxxxxxxxxxxxxxxxxxxxxxxx
To them I am the “IDIOT unable to grasp the truth” !!!
IT IS SO BLOODY ANNOYING !!!!!!!!!!!!!!
.
I send them these WUWT articles constantly BUT to no avail !
I DO HOPE “THE TRUMP EFFECT” starts to burgeon SOON !!!!!
.
AND HOW IS PROF. PETER RIDD faring with his legal battle ????
Anyone able to UP-DATE ME please ?????
ps…..No ! I don’t need help otherwise !
I am neither homicidal nor suicidal !
Just FRUSTRATED !! and did I mention..
…….BLOODY ANNOYED !!!!!!!!!
To quote many people.. “Wow.”
And not wow in a good way. Dude is seriously unhinged.
Just what is “The Trump Effect”?
The Trump Effect = Winning! 🙂
It’s Yuge.
All sand based islands come and go.
The N Carolina outer banks, The US Gulf coastal islabds, and many more.
The NYT is now working hard to make people dumb and afraid on so many topics.
The NYT doesn’t have to work hard at that. K through 12 and the Uni’s have done a fine job for the last several decades.
Kip — One thing to watch out for re the Solomon Islands is that the region is at the juncture of a number of crustal plates. See https://en.wikipedia.org/wiki/Solomon_Sea_Plate
Two consequences of that situation:
1. Data for Honiara are not necessarily indicative of what’s going on at other locations in the region. Those locations can, and I believe do, move up or down somewhat independent of Guadalcanal.
2. Because there are subduction zones in the area, there can be significant vertical land motions that have nothing to do with global sea level rise.
This has been the subject of a LOT of discussion and terrible journalism over the years — some of it so awful that even the Guardian backed away from it at times. Here’s a link to an article by David Middleton with lots of links. https://wattsupwiththat.com/2016/05/16/five-pacific-islands-vanish-from-sight-as-sea-levels-rise-part-deux-the-erosion-strikes-back/
Don ==> Yes, lots of vertical land movement in those areas. For Honiara, the PSMSL data lists “not robust” for VLM data for that particular site.
The linked paper at the end of the essay is interesting as it finds sea level rising and falling with ENSO, opposite in the North than the south.
So why do none of the worlds agencies responsible for marine charts add a datum correction for sea level rise. Why do we not hear a notice to mariners on this terrible danger.
ferd ==> ….because ships are worried about feet or meters of water below the hull, not millimeters, not inches.
Usually.
http://www.cnn.com/2010/TRAVEL/11/01/cruise.ship.bridge/index.html
Interestingly, when we sailed the Bahamas back in the early to mid 90’s the main/official charts available at the time were based on British surveys from the 1800’s. The depths over the banks and inside the Exumas were still fairly accurate. Of course some of the entry channels and bars had moved around a bit from the storms but the overall depths were not noticeably different from the charts. It wasn’t until Belize where you worried about inches and had to watch the tides very closely.
Joe ==> Yes — precisely right. Important harbors for commercial traffic have been redone with modern depth sounders, but many areas not normally used by commercial traffic still depend on data that seems very much out of date when one looks at the references.
I have trusted that old data enough to sail across the Bahama Banks, at night, depending on GPS to keep to a course that is known to give minimum 8 feet of water over the coral…..done it several times.
That night sailing on the banks can be fun but maybe a bit scary in spots. I missed a pole by about 4 or 5 feet that marked a sand bar behind the Exumas one night…. saw it just in time Had two charts showing it to the west so I plotted a clear course well east of it. Damned thing had moved right into the middle of what should have been a clear channel… still had a bunch of fun though.
Joe ==> If one hasn’t had any near missing he hasn’t really been sailing! (and needs to try harder.)
On long runs through buoyed channels, I have the tendency to steer directly at one of the buoys a few miles away….and am always surprised to come out of that sun-and-wind-sailing induced euphoria to discover I am 20 feet from crashing into the thing.
Bureau of Meteorology – Pacific Sea Level Monitoring Project
Honiara 1994 to June 2018:
http://www.bom.gov.au/ntc/IDO70061/IDO70061SLI.pdf
I guess very few Mr & Mrs Average bother checking this stuff.
So they get away with it . . .
Warren ==> Thanks for the BOM image — it shows tides of 3 feet low to high.
I wonder, did Damien Cave select the data himself or was he fed it by someone claiming to be a scientist?
michael hart ==> it is a CAGW “talking point” — repeated so many times in so many places that it is considered true. The Solomons still recognize Queen Elizabeth as their Queen, and Australia looks after many aspects of their affairs (such scientific authority for weather and tides).
Someone should create an alarmist global cooling parody site that uses real data; it’s only tweak would be to select the start/stop of the timelines. Let the global cooling narrative begin!
Now if you really wanted to talk about DRAMATIC Sea Level rise, just take the 1998 to 2000 period.
Around 400mm in 2 years, 2 metres per decade, 20 metres per century.
Yet the current sea level is lower than 2000 and looking at Dave Burton’s NOAA graph shows virtually no long term movement at all.
The NYT story typical CAGW Hype.
Many of the sea level gauges in the western pacific show rises over shorter periods. There is a record in the Pacific that goes back a bit further than ’93 with a rate less than a millimetre per year. https://eyesonbrowne.wordpress.com/2018/03/28/kiribati-its-still-there-and-its-beautiful/
Rgb ==> Nice site — nice essay.
A journalist is not going to fact-check something if it fits the narrative they want. They’re more likely to fact check until they get the narrative they’re looking for.
Don’t call someone looking to fit a narrative a journalist. They are merely propagandists or politicians. Many personalities on TV news are merely script readers.
If you think that is bad, check out this statement in the Florida Realtors Magazine article about flood insurance:
“vulnerable South Florida could face economic chaos, especially in the face of rising seas. The region faces one to two feet of sea rise by 2060, according to the Southeast Florida Regional Climate Compact”
WOW!
Who is the Southeast Florida Regional Climate Compact?
http://www.southeastfloridaclimatecompact.org/regional-climate-action-plan/
This is what they produce:
“Regional Climate Action Plan”
“The Regional Climate Action Plan (RCAP) is the Compact’s guiding tool for coordinated climate action in Southeast Florida to reduce greenhouse gas emissions and build climate resilience. The RCAP provides a set of recommendations, guidelines for implementation, and shared best practices for local entities to act in-line with the regional agenda.”
And this is their agenda, note the magic word “funding”
“The Compact calls on the counties to work cooperatively to:
• Develop annual legislative programs and jointly advocate for state and federal policies and funding.”
It’s not the Climate Regional Action Plan ?
That might reveal the truth …..
Tom ==> Certainly asking for more money will save Miami. See Miami’s Vice.
Yes. If anybody needs a climate action plan, or whatever you wish to call it, it’s Southeast Florida. Less than 1 foot of slr will cause severe problems in the Miami area, on top of problems they already have. See Kip’s reference.
And this has less to do about climate change and more to with continuation of modest slr which has put southeast Florida at grave risk.
Kip, I really wish you would change some of those pictures you used in that post….they are all from rain and have nothing to do with high tides….and the dog picture is in Key Largo, neighborhood called Twin Lakes, that has standing water every time it rains, that’s not tides either
Latitude ==> If you are referring to the essay Miamis Vice, there is no picture of a dog that I can find….the flooding images are from the MSM as examples of what they are pushing as flooding from high tides.
yes, I know…and people are using them all over the internet to show flooding from tides….every one of them are from 2 3 and 4 day rains….see the clouds in the background…Florida is sunny, unless it’s raining
Second picture down…the one with Sally’s real estate sign in it…woman in red pants…with dog…..that’s Key Largo, Twin Lakes, it’s what we call marl, clay, it’s doesn’t perk…so you get standing water every time it rains…
Alton used to be the dirt/sand road to my grandfather’s farm….
BTW, we may be a lot of things down here….but stupid enough to drive your car through salt water is not one of them
Latitude ==> Thought that was a cat…… 🙂
LOL…
Also relevant
http://notrickszone.com/2018/07/26/new-paper-54-of-vulnerable-sw-pacific-islands-studied-had-shorelines-that-expanded-from-2005-2015/
“. We suspect that an equipment move or change made the break in 1997 sometime.”
…or sea level dropped so far it was high and dry and wouldn’t work
More wins from today’s GWPF Newsletter 27/07/18
1) EU Abandons Climate Stance In Trade Sop To Trump
EurActiv, 27 July 2018
2) Trump and Juncker Agree To Boost US Shale Gas Exports To Anti-Fracking Europe
CNBC, 26 July 2018
3) Trump Wants Europe To Buy U.S. Gas — But Russia Is In His Way
The Wall Street Journal, 26 July 2018
4) Oh Dear: Climate News Is A ‘Ratings Killer’, US Journalist Confirms
The Washington Times, 26 July 2018
5) And Finally: You’re a CEO—Stop Talking Like a Political Activist
The Wall Street Journal, 27 July 2018
It usually takes longer than 3 days for my predictions to materialize.
Call this a “quickie”. 🙂
https://wattsupwiththat.com/2018/07/24/jeffrey-sachs-trump-is-taking-us-down-the-path-to-tyranny-because-paris-climate-agreement/#comment-2412688
[excerpt]
Donald Trump’s policies are eminently sensible and beneficial for the USA and the World – he is reversing destructive Marxist nonsense that is harming the economy and putting excessive control over everyone’s life into the hands of unelected leftist bureaucrats.
My expertise is energy. Cheap, abundant reliable energy is the lifeblood of society – it IS that simple!
Most politicians are so ignorant about energy that they should not even opine on the subject, let alone set energy policy. Trump is reversing the many leftist energy debacles, and restoring reliability and economy to US energy.
The example that America will set for the World will ultimately cause other governments to return to energy sanity. If they fail to do so, they will be unable to compete with the USA.
Low sandpit islands come and go all the time. In fact, one big storm could make that island completely disappear in one day. That island’s conditions says nothing about sea level rise or global warming.
The NYT is also know as the “old grey lady,” which is also an anagram of “really dodgy.” Coincidence? Or cosmic joke?
The sea level rise from the graph is over 100mm/yr from 1993 to 1996, so I guess that means the oceans are rising much slower then they were. I can only postulate the increased CO2 in the atmosphere some how slows sea level rise from this graph.
I think a really skilled journalist would have measured the sea level during low low tide, started his/her SUV up and left it running and then measured at a high high tide. This would be the most exciting proof of CAGW and sea level rise. It certainly meets all their quality standards.
That Times chart must have been presented as some kind of joke. The “trend line” is so obviously skewed that it makes the actual trend look flat. In fact, looking at the raw chart with no trend lines I conclude that the “trend” is, in fact, non-existent. Do whatever mathematical analysis you want on it to show some kind of “trend” and it’s either wrong or so completely overwhelmed by the noise of the variation as to be meaningless.
Jim ==> To be clear, the NY Times did not present a chart of sea level rise — if they had, all would have seen that their point was unsupportable.
The featured image, presented full-sized in the essay, is an example of the graphs that are used to support such false claims.
“Journalists should do their job”
But they are. Modern journalists see their “job” as promoting leftist causes. That’s why they became journalists: to make a difference.
Jim ==> I’m sure that in many cases you are right — they are trying to make a difference by being activists — where their professional calls for unbiased factual reporting of issues from all reasonable perspectives.
More proof that one can parse out a direction from the noise … that is, any direction.
Bill ==> Truthfully, even when when one is trying to be very scientific about it, as Dave Burton does above, the results are not always a reliable reflection of the real world. See reply to him.
where is the typical “these islands won’t be around long anyway because they are sand bar and they aren’t actually included in the global network” obsfuscatory response?
California is also in the business of creating sea level rise. Look at California Ocean Protection Council projections for San Francisco compared to tidal gauge records:
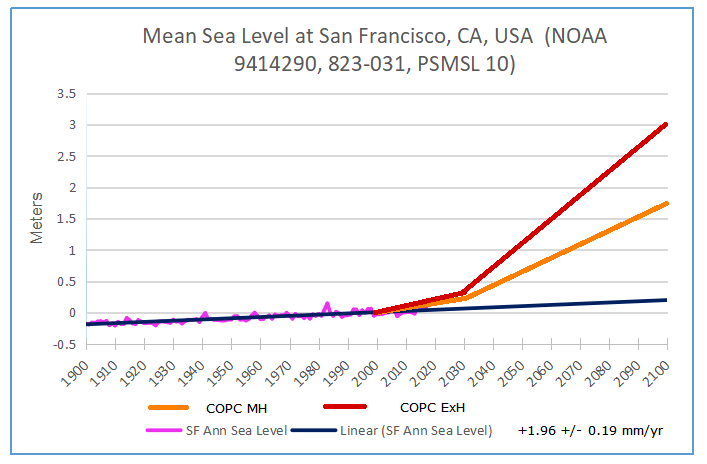
https://rclutz.wordpress.com/2018/07/27/calif-dials-up-sea-level-alarm/
Ron ==> Projections — of all types — made from climate models suffer from the same problem. The problem is revealed and described in:
Lorenz validated which discusses NCAR’s “40 Earths Study”.
Thanks Kip for the link and the article your wrote. You emphasize that the models behave in a chaotic manner due to unforeseen and unpredictable interactions between the component equations. In contrast, the earth’s natural climate is amazingly stable, maintaining a very narrow range of fluctuations in parameters like temperature and precipitation. In a similar way, models project radical changes in sea level, while the actual observed rise since end of LIA are quite slow and steady.
Ron C ==> First, We Don’t Know. (The hardest sentence ever for scientists).
Second, the climate systems appears to be “bounded” in at least two ways….Warm Periods seem to be constrained to a fairly narrow range of temperature and climate distributions, but our true state of knowledge is weak. Glacial Periods seem to be bounded as well even weaker knowledge).
It is well within expectations for Chaotic Systems to exhibit these types of multi-states, each well-bounded.
In fact, “stability” is a feature of chaotic systems. See “Chaos & Climate – Part 2: Chaos = Stability”.
Thanks for contributing — always nice to have rational voices chime in.
Australian BOM data. http://www.bom.gov.au/ntc/IDO70061/IDO70061SLI.shtml
Epilogue:
Thanks to all reading here — first, simply for reading at all (so many people don’t anymore) and second, for reading this essay.
It is a pity that in today’s world so many journalists are forced to “write to the narrative” of their newspaper’s owners or editors, rather than be true to the Code of Ethics for professional journalism. Maybe someday a Hero will emerge and set journalism straight — I’m not holding my breathe.
Remember, most of these journalists really believe they are doing their jobs when the write these kinds of Acti-Journalism (activism + journalism) stories. There are some who can be educated — others are lost to “The Cause”.
When scientists are queried about so-called quotes in Acti-Journalism pieces, they nearly always reply to me –“That’s not really what I said or what I meant.” The Acti-journalist “hears” what he needs and wants to make his “required narrative” point.
This journalist was so sure about rising sea levels that he didn’t even check the single most basic bit of data when writing a magazine-length article. As a young journalist (university) I would have been fired for such an omission, and rightly so.
Here’s to the hope of better times.
Again, thanks for reading.
# # # # #
“Drawing “trend” lines over times series graphs is itself a form of bias…”
No, it’s actually a form of lying.
(Practiced primarily by ‘climate scientists’.)
These tear jerker sea level rise stories are so silly. Anyone who lives on coastal lowlands and has any understanding of either geology or archaeology knows that sea level rise has been continuing for the last roughly 12KYA to 15KYA since the retreat of the last glaciation began. Where did the Bering Land Bridge come from, anyway? Every school child knows that’s the now submerged lands from whence humans migrated from east Asia to North America.
Google ancient geological maps of the Florida peninsula, and one can easily see that Florida at one time was several hundred miles wider east to west in the shallow Gulf of Mexico than it is today. It is for that reason that archaeological artifacts found to date in Florida tend to be rather recent, just a few thousand years old … the prehistoric natives tended to cluster along the shoreline, and 10 to 15 KYA that shoreline was way out in what is now the Gulf.
NYT is cancer, all the junk that’s fit for ads and political slants