Guest Opinion: Dr. Tim Ball
I know there are many articles on this website about sea level, none better than the recent one by David Middleton that speaks about “More nonsense about sea level rise.” I thought his article would make the continuance of this article unnecessary. It doesn’t because it is written for the WUWT readers. Unfortunately, too many of them like most of the public, scientists, and media don’t know what is involved in creating the net result that is sea level. I think because they don’t know, that it is time for something more basic as a citizen’s template for fighting city hall. Citizens of Honolulu are the most recent victims of this as the Mayor of Honolulu directs the City to prepare for a 3-foot sea level rise in some undetermined time period. It was reinforced during a recent radio interview when a caller asked about it because his city was planning to spend millions on structures to anticipate sea level rise. I provided a few facts about changes in sea level, scientifically called eustasy, and all the other mechanisms that could explain that change.
Let’s start with the automatic assumption by the public and the media that any major environmental issue, like global warming, glaciers melting, or sea level rising, is due to human activity. It reflects that bias, but also how little they know about all the natural causes of change. The simple assumption is that sea level rise is due to anthropogenic global warming (AGW) causing increased melting of glaciers adding more water to the oceans. In reality, just as with climate change, there is a multitude of causes, and few people know very little about any of them, and even those that do know have a quite limited understanding. As one group of scientists explained;
“a wide range of explanations for the current observed rise in sea level is possible.”
In 1997, before it sold out to sensationalism to survive as a science journal for the public, Scientific American, took a reasoned look at the issue. Figure 1 shows the cover story.

Figure 1
The conclusion they reached was illustrated in the story accompanying a picture of Holland because it was considered at greatest risk (Figure 2). Remember, this was before the UN exploited the South Pacific Islands by offering money in return for their collective votes in support of the Intergovernmental Panel on Climate Change agenda.

Figure 2
The caption is a good starting point toward understanding how this issue was distorted, misrepresented, and exploited. The extent to which this was an ideal vehicle for scaring the public about AGW is reflected in how it dominates Al Gore’s propaganda movie An Inconvenient Truth. A central, dramatic, feature included computer simulations of water inundating Florida and other areas.
Like everything related to the AGW deception the sea level issue began with a grossly simplistic position. It was based on the changes in sea level reconstructed since the zenith of the last glaciation that showed sea level rose approximately 120 meters with most of the increase occurring between 14,000 and 8000 years ago (Figure 3).

Figure 3
It is important to note that the last 8000 years covered most of the Holocene Optimum when temperatures were warmer than today for over 90% of the time. A recent study indicates temperatures as high as 6°C warmer than today 9000 years ago at Svalbard, Arctic North Atlantic. The question is why didn’t the rate of melt of the previous 6000 years continue? Regardless, early estimates of sea level rise and those made for future change, take the entire volume of ice, melt it down and add the volume of water to the existing sea level.
In the week before Gore received a Nobel Prize for his propaganda movie, a UK court ruled there were nine scientific errors some of which were created to enhance “the context of alarmism and exaggeration”. One of these was his claim of sea level rise of up to 20 feet “in the near future”. The Judge wrote, “This is distinctly alarmist and part of Mr. Gore’s “wake up call”. He noted that even if Greenland melted the water would be released, “but only after, and over millennia.” The judge also spoke to the claim of the threat to low-lying inhabited Pacific islands. Gore claimed they are, “being inundated because of anthropogenic global warming” and evacuations are occurring. The Court said there was no evidence of any evacuations. Gore exaggerates future levels well beyond his fellow Nobel Prize winners at the IPCC. Why haven’t they challenged his claims?
Unfortunately, few people know of the Court ruling, but even if they did, the debate is so ill-informed that sea level rise continues as a major concern? But what are the facts? What do we know? The facts, as usual, show what is happening is perfectly normal with no evidence of a human influence. Some of the following information is known to a few specialist scientists but the majority, like almost all the public, including most scientists, have little or no knowledge.
Sea level is not level. Most people can’t get their minds around this idea because water is frequently used as a measure of ‘level.’ Water on one side of the bowl will be at the same level as water on the other side. The belief is that if the water is all in one body, then it will be level in all areas. Confusingly, that is nowhere near the case with the Oceans. For example, sea level is different at each end of the Panama Canal, yet the Pacific and Atlantic Oceans are connected at both ends of the Americas. This is an important point because you might think the difference is due to the proximity of the land. It isn’t, as sea level varies considerably in the open ocean.
One cause is changes in atmospheric pressure. The weight of the atmosphere pressing down on the surface pushes the water down and causes it to flow out to other areas. Since air pressure varies considerably all the time, then the sea level varies accordingly. We see and can measure, this effect when the bulge caused in the region of very low pressure associated with hurricanes comes ashore and creates what is called a tidal surge. Sea level can rise several meters over very large areas under large low-pressure systems. As the system moves the sea level changes, and in low lying areas, causes flooding.
The water level will vary with wind speed. It is called a set-up and occurs measurably even in lakes. For example, lake levels in the south end of Lake Winnipeg (Figure 4) can be 2 meters higher in the south end with a steady northwest wind over a couple of days.
On the oceans, most people know waves and their size are a function of winds blowing over a stretch of water called a reach, but few think about the ‘piling up’ of water. Of course, if it increases the sea level in one area, it is decreasing the level in another. Some know the general pattern of surface winds also create surface ocean currents. Few know those currents, due to the frictional effect of the wind only extends down about 1000 meters, below that the circulation is very different, primarily being a function of cold water sinking at the Poles and rising at the Equator.

Figure 4.
Some scientists show that gravity differences cause variations in sea level. Figure 5 shows an image produced from satellite data. As the author notes,
It is clear from this image, sea ‘level’ actually changes in height with spatial variations of 100m over the oceans.

Figure 5
A discussion of the interaction between sea level and gravity are provided in a 2002 paper that notes,
Sea level rise is often accounted for by summarising mass budgets. In fact, however, the problem of sea level rise is complicated because a number of contributions interact with one another. For example, at the centre of concerns about sea level are the ice sheets. Changes in their mass not only effect (sic) eustatic sea level directly; they effect (sic) it too through viscous flows in the Earth’s mantle that change the shape and gravity field of the Earth, and they effect the ocean dynamical circulation because freshwater fluxes affect the buoyancy of the ocean water masses. Thus a comprehensive understanding of sea level needs not only to identify causes of sea level changes, but also ways in which they may interact.
There is another factor related to tidal conditions. Tides, which is the rise and fall of the oceans due to the gravitational attraction of the Sun and the Moon varies with the positions of the Sun and Moon relative to earth. However, those change over time. For example, we know from work on the Milankovitch Effect that the distances between the Sun and the earth change over relatively short time periods. The orbital change is given as 95,000 years, which seems too long to be of significance, but this is the complete cycle from extreme ellipse to almost circular (as it is now) and back. So, the actual change is one-half the time.
Sea level varies when water temperatures change. Warmer temperatures expand the volume of water and sea level rises; cooler temperatures shrink the volume and water levels lower. This can result in a global or a regional change or both. But even this is not simple because the water temperature varies with depth and different layers change temperature differently. There is one important temperature range, 0° to 4°C, that results in a different volume reaction. This is very important because it means that large areas of polar water and water at depth, even in the tropics, does not to respond to temperature change in the same way. We don’t know how much water that entails in the total ocean volume, but it is clearly a large amount and precludes any study assuming a simple volume change with water temperature change.
This idea of volume change as a function of temperature is even more problematic than the assumption that it is uniform in space and time. Two parts of my career taught me the error of that assumption. When I was involved in chasing Soviet submarines around the North Atlantic, we used instruments to detect the noises they make. Because of the way sound travels through water it required an accurate temperature profile of the water called a bathythermograph. We had instruments called Sonobuoys that could lower microphones or thermometers to preset depths to measure temperature as they descended. It was astonishing to see the temperature variance with depth that could occur. This means the volume of each layer varies thus affecting the net sea level value.
Similarly, we installed weather instruments every 200 ft on a 1000 ft radio tower outside of Winnipeg. Again, the variance in temperature with height at any given time was quite remarkable. We were especially surprised by the number of inversions that occurred. This is why the global temperature measured at weather stations located between 1 and 1.25 meters above the surface is that and only that. It is the temperature of the atmosphere between 1 and 1.25 meters.
The salt content of the oceans, known as salinity, varies considerably from region to region and that creates an imbalance. Different salinity creates different water density, and that can create different water levels and density currents. Perhaps one of the best known is between the Mediterranean and the Atlantic through the Straits of Gibraltar.
So far, we have examined sea level changes under the general category of eustasy. Now we need to examine sea level changes caused by changes in land levels under the general category of isostasy.
When you observe a shoreline over time, and the water line changes it is natural, because of education and reason, to assume it is the water level that has changed. However, it is also possible that the land is rising or falling. There are ways to determine which change is going on, but not usually by observation. This results in people attributing a change in sea level rise incorrectly as evidence of global warming when the land is sinking. This misattribution occurs most often on the Gulf of Mexico coast of the southern US. The North American continent is a useful example to explain what is going on.
There are two parts to the crust of the Earth. One part is a crust that covers the entire globe and is primarily composed of silica and magnesium (sima). The continents, the second part of the crust are primarily formed of silica and aluminum (sial). This makes the continental crust lighter than the underlying oceanic crust, which is rich in iron and denser than the continental crust. It means the continents effectively ‘float’ on the underlying oceanic crust, which in turn sits on the fluid material of the mantle. Everything rises and falls with the convective currents in the mantle but also with changes in weights added or removed from the continent.
Figure 6 compares North America 20,000 years ago with today. On the left map, the blue shows the extent of the ice, at the peak of the Ice Age. It was greater in area than the current Antarctic glacier and was thickest in the dark blue region centered on Hudson Bay. Notice the difference in coastline compared to the current situation on the right.

Figure 6: Maps of North America; Left, 20,000 years ago. Right, Today.
Figure 7 shows a cross-section along A to B. The weight of the ice sitting on a floating continent changes the level of the land in two ways. It pushes the entire continent down at the northern end, so the southern end rises. It also depresses the rock of the continent as indicated by the arrows at A, a process called deformation.

Figure 7; Cross section AB through the ice sheet and continent.
When winter snow survived the summer melt high in the Torngat Mountains of Labrador, layers built until a continental glacier was formed. The ice sheet center spread west as the snow was heavier in the prevailing westerlies. At the peak of glaciation, the thickest ice lay over Hudson Bay.
Since the ice melted, the continent has adjusted by rising in the north and sinking in the south. At the same time, the depressed land has regained some of its altitude. The land sinking along the Gulf of Mexico is mostly due to this adjustment. The rate of recovery is rapid and sometimes noticeable even without measure because it occurs within a person’s lifespan. Two pictures illustrate the rate the first (Figure 8) is of shorelines along the coast of Hudson Bay that form and are abandoned as the land rises.

The second image is my favorite because I saw the differences between my first and last visits to a place called Sloop Cove near Churchill, Manitoba (Figure 9). The name comes from the fact that in the 18th and 19th centuries, the Hudson’s Bay Company anchored their small sailing vessels called sloops in the inlet. Today the inlet is above water even during the highest tides. Geologic estimates are the land has risen 2 meters since they began using it.

People in Manitoba who own cottages on the southern end of Lake Winnipeg (Figure 4) also noticed the effect because the Lake is moving south as the northern end rises. This vertical rise is converted to a greater horizontal movement so is more noticeable as the lake threatens your cottage. I learned much about this when serving on a Commission of Inquiry created because people blamed the ‘flooding’ on the utility (ManitobaHydro) that built a dam at the north end of the Lake to use it as a reservoir for hydroelectricity. In fact, in about 30 years the water moved south by several feet.
Measurement
Traditionally, sea level was measured by taking the average of tide gauge readings, however, since 1992 it is done by satellite. All the discussion is about an increase in the mean or average height of the sea, but only fractional increases. They were talking about millimeter increases when that type of precision wasn’t possible with tide gauges and even the TOPEX/POSEIDON satellites claim,
“Measured sea levels with unprecedented accuracy to better than 5 cm.”
It’s important to note that this estimate is with an uncertainty of 3-4 mm. This is important because the IPCC claim, “For the period 1993 to 2003, the rate of sea level rise is estimated from observations with satellite altimetry as 3.1 ± 0.7 mm yr-1.” But what are they actually measuring? It is the average variation of sea level relative to an imaginary line called the reference ellipsoid. Potential for error exists in determining the ellipsoid, the height of the satellite, in the actual measurements, and in the changes going on in the ocean and on the land. Frankly, it is useless to even talk about millimeter changes. There are so many inputs, and so many adjustments that the final results claimed are unjustified. As Carl Wunsch said,
“It remains possible that the data base is insufficient to compute mean sea level trends with the accuracy necessary to discuss the impact of global warming–as disappointing as this conclusion may be.”
He adds,
“Useful estimation of the global averages is extremely difficult given the realities of space/time sampling and model approximations. Systematic errors are likely to dominate most estimates of global average change: published values and error bars should be used very cautiously.”
Claims don’t fit the reality.
Everything was done by the IPCC to attribute the increase to global warming especially through increased sea temperature. They claimed that about 25 percent of sea level rise of the last 50 years was due to thermal expansion with that rising to 50 percent for the last decade. As with everything they do, the IPCC start with the assumption that their estimates of global warming are accurate and therefore their extrapolation of perceived trend going forward of increased sea level is also accurate. The arrogance of attributing 50 percent of the increased sea level to thermal expansion is done with a computer model that eliminates almost all the variables that cause temperature change, and the result is then applied to computer models that leave out most of the causes of sea level change.
Looking forward.
Originally, sea level rise was a grossly simplistic theory that asked how much sea level rise would occur if the Greenland and Antarctic ice sheets melt completely and the total water produced was then added to the current sea level. Let’s consider a similar scenario going forward. What is the maximum sea level rise that can occur if all the ice melts and the water is added to the current sea level?
Among the things to consider are the problem that much of the ice is already in the ocean, so it won’t add to the level. In fact, if we only consider that portion, then sea level will go down because water expands by about 9% when it freezes, the space occupied by the ice below sea level will hold 9% more water. Similarly, ice above sea level will produce 9% less water by volume. Then there are the isostatic adjustments the land will make as the weight of the ice is removed.
But all this assumes total melt, and that is unlikely for thousands of years, if at all because the average temperature of Antarctica is below –20°C (-4°F). How much warming is required before that moves above the freezing point?
Of course, you can stop worrying because Al Gore confirmed his practice of doing what I say not what I do. He bought waterfront property, and according to reports has not made it ‘green’ friendly. These are the best signs that neither global warming nor sea level rise are a threat?
Sea level was higher in Hawaii (Oahu) during the Eemian interglacial and prior Holocene warm cycles than now, adjusting for local uplift over the hotspot lately so in the news.
http://www.soest.hawaii.edu/ericg/kap_paper.pdf
Sea level in Hawaii was higher during some months of 1920 than it is right now.
And the seasonal variation, not to mention the monthly and yearly variations, are larger than the sum total of the net changes from 1900 until the present.
Decidedly unscary.
A monolith has been found about 130 ft. below sea level in the Mediterranean Sea, about 37 miles south of Sicily. Does Al Gore want to extend man caused global to that submergence as well ? I bought Gore’s d.v.d. inconvenient “truth” where he made a big deal about Washington, D.C. trees being bare in Civil War period spring and leafed out in the same month now, completely disregarding that we were coming out of the Little Ice Age. I got a little angry at the false presentations.
“A monolith has been found about 130 ft. below sea level…”
Is it black, have a proportions of 1:4:9 and is “full of stars”? If so, I suggest they don’t mess with it, strange things seem to happen around that kind of monolith.
You shouldn’t get angry for you are enlightened!
http://www.sealevel.info/MSL_graph.php?id=Honolulu
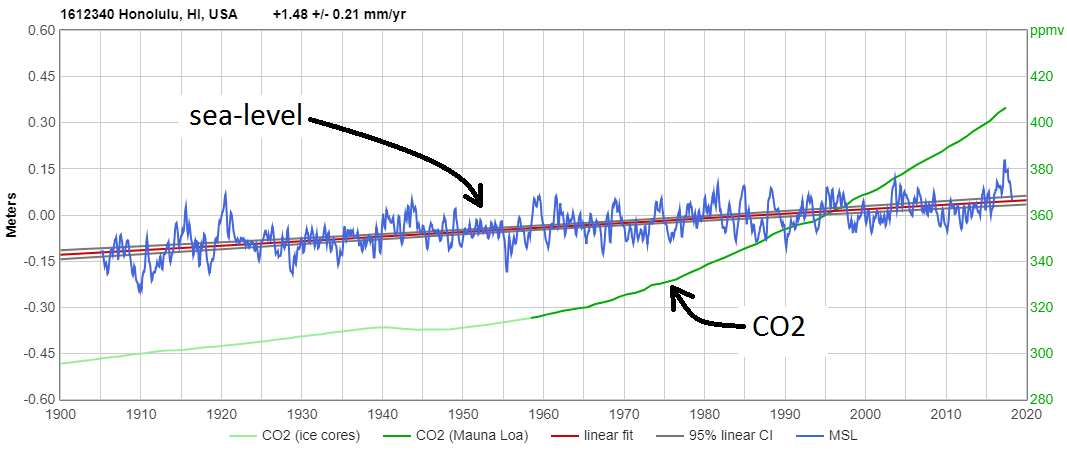
slope = 1.482 ±0.212 mm/yr
acceleration = –0.00535 ±0.01443 mm/yr²
Thank you, nice plot. I wonder what it would look like with CO2 using the same (time constant) degree of time-filtering, perhaps both normalized to their respective y-axes.
Here it is with 12-month running boxcar averaging for the sea-level trace:
http://www.sealevel.info/MSL_graph.php?id=Honolulu&boxcar=1&boxwidth=12&thick
(The CO2 trace is showing annual averages, already, so that’s similar.)
This chart is a nonsense. The left scale and the right are in different units and the scales are arbitrary. Why not have the Meters scale at -0.3 – 0.2? Or the CO2 scale at 0 to 1000. The only meaningful comparison would be to plot one vertical scale measuring rate of change for each value.
starting an article by insulting the intelligence of the readers is always a good tactic I find to
ensure that people give it a fair hearing.
Was I insulted? Not in the least.
Of course not. Dr Ball actually was flattering the audience saying that earlier treatments of the topic were too technical for the general public, having been written for the WUWT reader. Percy apparently doesn’t count himself as a WUWT reader.
Good essay.
Bob Hoye
“Some scientists show that gravity differences cause variations in sea level.”
Gravity is tricky…not only do sea floor volcanoes and mountains increase gravity and hold water higher on top of them…..gravity has the duel effect of pulling satellites down
So what are they actually measuring and how do you adjust for that?
It’s not coincidence that global gravity maps….and global sea level maps….look exactly the same
gravity…
https://www.space.dtu.dk/english/-/media/Institutter/Space/English/scientific_data_and_models/global_marine_gravity_field/grav581.ashx?la=da&hash=D9EE067474C39F212AC3F51AE4F088D6CD465273
sea level……..
https://encrypted-tbn0.gstatic.com/images?q=tbn:ANd9GcST4iw9kb0Szo2x0nnMflt6FZLdaHWzcHOQEd2ujC2OfE8Wj8g9
I laugh every time I see those standing permanent anomalies ……..
Great discussion for me to understand the complexity of sea level changes at an enhanced level. Thank you, Dr. Ball!!!
I concur with you, James. An extremely enlightening, informative and comprehensive essay on the subject.
Seems to me ocean acidification is a sea related scare story.
When a solution is referenced to a neutral 7.0 pH – values above are alkaline and become more or less alkaline, values below are acidic and become more or less acidic.
The ocean’s pH is about 8.1. That’s alkaline. Variations are more or less alkaline, not more or less acidic. The obvious reason for incorrectly using the term “ocean acidification” is a propaganda gambit to scare the gullible and uninformed who associate acid with bad, like alien blood and spit.
Highly alkaline compounds such as caustic soda can be just as dangerous as acidic compounds, e.g. concentrated bleach, sodium hypochlorite, pH 9 to 13. On the other hand: rain has a pH of 4.5, lemon juice has a pH of 2.0, tomatoes a pH of 4.5, and vinegar a pH of 2.2. If they get on your hands the flesh doesn’t melt and they don’t burn a hole in the kitchen counter.
A pH of 6 is a weak acid and its chemical reactivity is very low.
A pH of 7 is neutral and its chemical reactivity is zero.
A pH of 8 is a weak base and its chemical reactivity is very low.
A solution goes from pH 0.0, dangerous acidity, to pH 7.0, neutral/safe, to pH 14.0, dangerous alkalinity.
pH = -log[H+] (1)
A change from pH 8.2 (6.31 ppb M/l) to pH 8.1 (7.49 ppb M/l) is a -26% change (-1.18 ppb MH+/l) in the direction of lower alkalinity, not more acidity.
But a change from pH 9.0 (1.0 ppb) to pH 8.0 (10 ppb) is a -900% change in the direction of lower alkalinity.
Applying percentages to a logarithmic scale/function is very dicey.
Makes the -26% look pretty trivial – which anything in ppb is.
So, pH 8.1 is moving a YUGE 1 ppb in the direction of slightly more neutrality from pH 8.2 which is not much to begin with.
Improperly using the term ocean “acidification” to scare the public over bogus CAGW is a disgrace to science. Spit out the Kool-Aid and grow a backbone.
The term is not improper. It is technically valid. But there’s no doubt it was selected for scare-tactics.
debasification doesn’t roll off the tongue
“Less caustic” rolls off the tongue pretty well.
The ballyhooed harms from reducing ocean pH are purely hypothetical. The oceans are alkaline, not acid, and no amount of CO2 emissions can change that. Additional dissolved CO2 just makes seawater slightly less caustic.
The greatest effect is on surface water, but AR5 estimates that the average pH of ocean surface water has decreased by just 0.1 since the beginning of the industrial age.
Ocean pH variations with time, location, basin & depth are all much, much greater than that tiny change. Yet those much larger pH variations do not seem to cause problems for marine life.
Look how much pH varies with depth in the North Atlantic and North Pacific, and look how different the pH profiles in the two basins are from each other:
http://sealevel.info/pH-TCO2_NAtlantic_NPacific_vs_depth.png
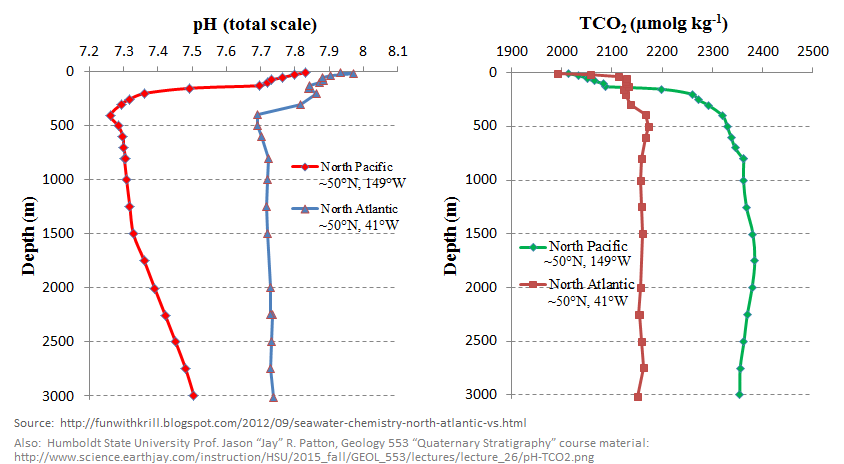
Note that there’s 50× as much CO2 dissolved in the oceans as there is in the air, and only about 1/4 of the CO2 which mankind emits ends up in the oceans. So CO2 emissions have only a slight effect on the oceans.
Also, ocean chemistry buffers changes in pH due to carbonic acid from dissolved CO2.
Plus, higher levels of dissolved CO2 stimulates the growth of calcifying coccolithophores, which, when they die, carry calcium carbonate to the ocean depths, thus reducing levels of dissolved CO2 (a negative feedback mechanism). This effect is surprisingly large; here are some references:
http://hub.jhu.edu/2015/11/26/rapid-plankton-growth-could-signal-climate-change
http://www.sciencedaily.com/releases/2015/11/151126165042.htm
http://www.techtimes.com/articles/111246/20151127/rapid-growth-of-plankton-caused-by-increased-carbon-levels-in-the-ocean.htm
https://www.academia.edu/13761237/Origin_and_Evolution_of_Coccolithophores_From_Coastal_Hunters_to_Oceanic_Farmers
The ocean runs on nitrification, denitrification, ammonification, and nitrogen fixation…all of it dependent on three things….the anoxic zone, oxic zone, and the oxic interface…..and all 100% dependent on a source of carbon…..CO2 adds that carbon source
yes, CO2 can lower pH in the ocean…..but at that same time it’s adding a carbon source…and that feeds the process that cranks the pH right back up again
They get away with this by bubbling CO2 into salt water in the lab, where they have to add enough CO2 to deplete the buffer first…and then lower the pH
…can’t do it in the real world
Yes, bad science. I recall seeing at least one study in which they resorted to adding hydrochloric acid to adjust the pH.
“I conclude that cutting off all the frogs legs affects its hearing because no matter how loudly I yell, it doesn’t move. In fact, its jumping distance plotted against the number of legs proves that its hearing gets progressively worse according to the number of its legs removed.”
Fresh water which is closer to neutal coming from melting glaciers will also cause the water to he less caustic.
neutralize.
NS, good post: I agree with “less alkaline” or reduction in alkalinity as being the more technically correct terms. (I see you have improved your understanding of pH from an earlier post on the subject.)
I agree that ocean water will always be alkaline on average for all practical purposes.
You could explain exactly how your little diatribe is relevant to a discussion on *Sea Level Rise*. Wildly Off Topic.
As an aside:
Michael Jankowski has it exactly correct. Using the term “acidification” to describe the lowering of pH of any solution (acidic *or* basic) has been accepted as proper nomenclature in Biology, Biochemistry, and Chemistry since the early 1970s as least.
There are enough people around here who stubbornly refuse to accept this simple fact, I just gave up on the issue. Give it up, already.
TonyL,
Can you provide a citation where any peer-reviewed literature or text books in the fields of geochemistry, geology, or oceanography used the term “ocean acidification” prior to the early-21st century?
When I taught chemistry in the late-’70s, the term acidification was used to describe a procedure in titration where an alkaline solution was reduced in pH by the addition of acid to a point of neutrality, and then slightly beyond, to assure an excess of hydrogen ions. This was sometimes done to re-dissolve a precipitate that only existed in an alkaline solution. To be so careless in nomenclature for chemical processes as you propose would make describing procedures more ambiguous and verbose.
Oh, BS, Clyde.
I specifically said *Biology*, *Biochemistry*, and *Chemistry*. Go find your own references.
So what if the term “acidification” plays into the hands of the alarmists. As they say “It is what it is”, they just got lucky one time with the verbiage. So What!
Lets not try to overturn 40 years of common scientific usage because someone somewhere is pulling a fast one.
“When I taught chemistry in the late-’70s,”
Me too. We used “acidification” whenever the pH was to be lowered. The students never had a problem with it. Often the students would observe that “debasification” just did not work for them.
Carbonate to Bicarbonate titration:
The solution is acidified as the titration proceeds, but is still basic at the bicarbonate endpoint. So what.
The students would cringe at the thought of “dealkalization”.
How about “neutralization”?
@ Chimp:
“neutralization” is ambiguous. It can refer to:
a) pH = 7.0, a neutral solution.
b) A titration endpoint, where the acid or base is fully reacted, or neutralized, regardless of the resulting pH.
Yet it is IMO far more apt than calling a slight reduction in alkalinity “acidification”.
Do you call a drop in acidity “basification”?
But the term has the same problem as “acidification”, only not as badly. “Neutralization” strictly should mean to make neutral, ie to neutralize, just as “acidification” means to make acidic. But calling a reduction in alkalinity “neutralization” is closer to the mark than calling it “acidification”. JIMHO.
The correct “slight reduction in ocean alkalinity” just isn’t as useful for propaganda purposes as the catchy, pithy, if bogus, phrase “ocean acidification”.
I don’t know how authoritative this reference might be, but please take it for whatever you think it’s worth:
http://www.chemistry-dictionary.com/definition/acidification.php
“Definition of acidification
1) This process happens when compounds like ammonia, nitrogen oxides and sulphur dioxides are converted in a chemical reaction into acidic substances. Most of the compounds are a direct result of air pollution.”
It says 1), but it’s the only entry.
Endpoint and Neutralization are not synonymous. Colorimetric or potentiometric titrations have endpoints. Neutralization refers exclusively to a pH titration, wherein the pH is exactly 7.
TonyL,
What is being discussed is ocean chemistry, not body chemistry. Organic chemistry has some quirks that don’t quite follow the rules of inorganic chemistry.
I have already found my references, and they don’t support your claim:
https://wattsupwiththat.com/2015/09/15/are-the-oceans-becoming-more-acidic/
The onus is on you to prove your claim, or to, alternatively, discredit my list of references.
The reason they were students is that they were learning, hopefully, the correct vocabulary. There ‘opinions’ were of less value than those who were experts, such as Konrad Krauskopf.
I’m not as willing as you to role over and let the alarmists establish the talking points and ground rules for debate.
“…they just got lucky one time with the verbiage.” I call BS on this one.
You could say lucky about a single incident, but they have systematically manipulated the words in every single instance to create their scare campaign. I cite, the use of the scare word “anomaly” in temperature charts instead of the correct word “difference”.
go do your own research.
Steven, do you have any information as to why the continental glaciers suddenly melted between 13,000 and 8000 years ago? How was that cause ruled out for the melting happening today?
thanks in advance,
iron brian
SM,
I already did, and it doesn’t support TonyL’s claim: https://wattsupwiththat.com/2015/09/15/are-the-oceans-becoming-more-acidic/
You and other readers have the benefit of my references to support my complaint. We only have TonyL’s claim, without benefit of references.
Clyde, as a PhD chemist, I agree with you. Prior to this ocean acidification bullshit, it was generally understood what “acidify” meant. This is another case in which science has been bastardized by alarmists.
Your experience then differs from mine. It seems to me that this fake worry only came to the fore during the “Pause”.
Please provide references to the use of the term “ocean acidification” prior to this century. I’d really like to see whether they are related to man-made CO2.
Thanks!
BS to you too, Chimp.
Go find your own references, again.
All I maintain is that “acidification” is correct nomenclature whenever pH is lowered to any extent. I say nothing more or less.
As far as “ocean acidification” goes, it is obviously being groomed as the Next Big Thing for environmental scares and fund raising.
Clyde and Chimp:
I have found both your comments to be generally astute and well considered. You two were the last people I would have expected to jump into this long running WUWT food fight over a stupid bit of chemistry nomenclature.
I am giving up again, this is hopeless.
For people who do not like “acidification” applied to a basic solution, I would have *loved* to have you in my analytical chemistry lab.
Now I an going to make both of you suffer:
“Chemists Have Solutions!”
HaHaHaHa!
Sorry, but words matter in science. Even if at sometime in the past, “acidification” was incorrectly used to indicate making an alkaline solution less basic, only in this century, as near as I can tell, has the term been hijacked by CACA acolytes and combined with “ocean”.
When I studied chemistry in the 1960s and ’70s, “acidification” meant “to make or become acid”, not to make less basic or alkaline. And “alkaline” meant capable of neutralizing an acid.
Not that it should matter, but four of my chemistry profs were Nobel Laureates.
In this case, it matters because the arch druids of CACA have intentionally seized on “acidification”, wrongly, to make the process, if it’s happening at all, sound scarier.
Correction to Tim Ball: where he talks of Gore and IPCC “Nobel Prize” he means “Nobel Peace Prize” — another animal altogether.
I searched the glossary & index of my chemistry text for the term “acidification” to no avail.
However, on page 173, in chapter 6 (Solutions), under a ” Brief Background on Acid-Base Reactions”, and immediately following a definition of acids and bases derived by Svante Arrhenius, it states–quote:
====
“When an acidic solution is mixed with a basic solution, a neutralization reaction occurs.”
– Chemistry (4th Edition) Oxotby, Gillis & Nachtrieb
====
The complete, yet brief and punctuated history of the phrase “ocean acidification” in books:
https://books.google.com/ngrams/graph?content=ocean+acidification&year_start=1800&year_end=2000&corpus=15&smoothing=3&share=&direct_url=t1%3B%2Cocean%20acidification%3B%2Cc0
“The words acidity and alkalinity each obviously have two different meanings in water chemistry.” Acidity and alkalinity are ITALICIZED. Page 55 in Warren, C. E. 1971. Biology and Water Pollution Control. W. B. Saunders.
Kwar,
My ancient understanding of “neutralization”, too.
But the same term could apply to rendering a solution precisely neutral.
So maybe those arguing for calling the process “making oceans less caustic” rather than “ocean acidification” have the best response to the propaganda language. Just doesn’t fall as trippingly from the tongue.
I know what he sediment but I don’t know what the element.
Why do you and the likes of Stokes so resist saying the obvious: The pH is lowered when acid is added to any solution (with a pH greater than the the added acid)?
There are good reasons why the pH scale is divided into acid and alkaline halves, with neutrality being the demarcation. Superimposing continuous acidity changes over both halves is contradictory — or sloppy!
TonyL,
BTW, thank you for the implied compliment, “I have found both your comments to be generally astute and well considered.” Inasmuch as you think that we have good track records, you just might want to consider the possibility that we are right this time as well. 🙂
No, you probably wouldn’t have wanted me in your class. I always asked lots of questions, many of which the professors didn’t have ready answers for. You know, there is that old saw about how teachers teach the way they were taught. It takes an exceptional teacher to break out of that and think independently.
“Makes the -26% look pretty trivial – which anything in ppb is.”
What’s more, that alleged -26% change is out of context. ” It would take a change of nearly 1500% in the hydrogen ion concentration to reach neutrality. That is, there has been a percentage change of about 1.7% (25/1500) of hydrogen ion concentration necessary to reach neutrality.”
[ https://wattsupwiththat.com/2015/09/15/are-the-oceans-becoming-more-acidic/ ]
Yes, the hydrogen ion concentration is reduced by 26% (a small number made even smaller), but at that pH the hydrogen ion concentration is not the major acid present anyway, bicarbonate is dominant. (A bank account loses 50% of its value going from 2 cents to 1 cent.)
The propensity for some species to react as an acid or base is dependent on what else is around from a chemical perspective.
Like the practice of calling carbon dioxide “carbon,” the precision of scientific terms are being intentionally obfuscated by alarmists for the purpose to deceive.
Measured in different places, the current ocean pH varies over about 7.5 to 8.4, much larger than the measured recent pH decrease due to increased dissolved CO2. Over about 100-200 million years ago, ocean pH was ~7.6. Yet carbonate shell-forming organisms flourished .
Lower pH tends to decrease dissolved carbonate and increase bicarbonate. I think most shelled organisms use bicarbonate, whose concentration now in the ocean is about an order of magnitude higher than carbonate.
donb,
Yes, and with coastal upwelling, as along the Monterey Canyon (Calif.), the pH can be lowered significantly (<<0.1 pH) within a matter of minutes. Yet, life is abundant along the coast because the organisms have evolved coping strategies for such abrupt changes.
The waterline for Lake Michigan retreated quite a distance from where it was back in the past. I recall much hand ringing and speculation as to man’s cause in it. Then someone noticed the CN tower roof was now higher in altitude, and after more investigation it was determined the crust was rebounding from the ice sheet retreat and it was explained as popping a dent out of a coke can and getting that, past the tipping point “pop” cans often do.
I notice the water levels are, while still lower than when I was a kid, slightly higher now that it is somewhat stabilized. I now live not quite 60 miles south of where I grew up, and levels here never did drop as drastically as they did just that small distance away.
But anyway, they are almost right in that the levels are changing due to global warming . . . from Ice Age glacial retreat.
In my neck of the woods, JPK, king tide levels are also lower than they were when I was a kid but this is due to complete lack of glacial incursion and corresponding land movement.
Fine weather [normal BP] king tides were up to a foot higher here [east coast Australia] 70 years ago.
Maybe in a few years time someone will do an audit of the world’s tide gauges after GPS chips have been fitted on all the major ones and give us some facts on SLR.
Great article, Tim, but Magnesium is element 12 in the periodic table, & Aluminium is element 13. It is more accurate to say that the SIAL is lighter than the SIMA because it has less Iron, not because it has lot’s of Aluminium instead of Magnesium.
Good article Dr. Ball. I learned several new aspects of the sea level mystery. Geologists would probably want to add basin deformation via tectonism, volcanic effects, both thermal expansion of water and flows filling the basin, and sedimentation filling the basin. Your article shows land versus sea level movements and a variety of complications in temperature profiles, but if you can’t even work with an uniform basin the probability of measuring sea level accurately, and attributing the change to natural or anthropogenic factors, is currently impossible.
Also all the water which has been pumped out of the ground, much of which ends up in the sea.
All that water pumped, raised sea level by how much ?
I need numbers to do the math.
Don’t forget the change in gravity of those pumped out areas.
If it was easy there would be a known sea level……
Groundwater pumping might have contributed 0.3mm per year from 1972-2008, but hanging so much surface water out to dry behind dams probably more than cancelled that out.
https://arstechnica.com/science/2011/09/can-pumping-too-much-groundwater-raise-sea-level/
However, few new dams are being built, but groundwater extraction is continuing, if not in the USA, then elsewhere.
So here we have a rough estimate of groundwater extraction contribution to sea level rise, which is seldom considered. If I might add two more seldom considered sources.: 1. Burning liquid petroleum based fuels produces roughly twice the original volume in water. 2. Each day the earth intercepts a large volume of small (from the size of a bb to the size of a house) bodies consisting mostly of water ice. I wonder if either is being measured?
“A Major Non-Existent Threat Exploited by Alarmists and Politicians”
“the whole aim of practical politics is to keep the populace alarmed (and hence clamorous to be led to safety) by menacing it with an endless series of hobgoblins, most of them imaginary.”
H.L. Mencken “In Defense of Women” (1918)
“H.L. Mencken “In Defense of Women” (1918)”
Its centennial anniversary!
“Manitoba… Not sure what to do about them. Restock the province with megafauna and encourage tourism, I think. How quickly can we breed back the saber-toothed cats?”
http://en.wikiquote.org/wiki/James_Nicoll
Probably don’t have enough Smilodon, etc, DNA to resurrect one, but could use modern lion genomic material to fill in the gaps, and see what we came up with.
The DNA which has been recovered shows that machairodonts were more closely related to modern cats than some anatomists had thought:
http://www.abc.net.au/science/articles/2005/08/09/1433588.htm
As long as we have the control genes for growing saber teeth and the requisite jaw grooves, it might be enough to satisfy the Pleistocene Park-going public.
the data do not consistent with the idea that sea level rise can be attenuated by cutting emissions
https://ssrn.com/abstract=3023248
There is one important temperature range, 0° to 4°C, that results in a different volume reaction.
Not true for seawater.
And especially not for seawater under pressure. Try this
http://www.csgnetwork.com/water_density_calculator.html
As far as I can tell, that would be a very rare and special event. Back in the 1970s I spent a summer at Gull Harbour on Hecla Island, which if I understand correctly is at the northern end of the south basin. I have real difficulty the water being six feet higher. A large chunk of the island would be flooded as would the mainland community of Riverton. link What you will get is two meter high waves. link
There is a formula which would give a 2 meter storm seiche every 1000 years on Lake Winnipeg. 1960s paper The trouble is that, given relatively flat land, it takes more water than is available to get such a result. The highest setup ever observed at Winnipeg Beach was 1.17 m on November 11-12, 1940.
I was reminded of this USGS related item from a few years ago while reading the good Dr’s current write up.
Thanks Dr. Tim.
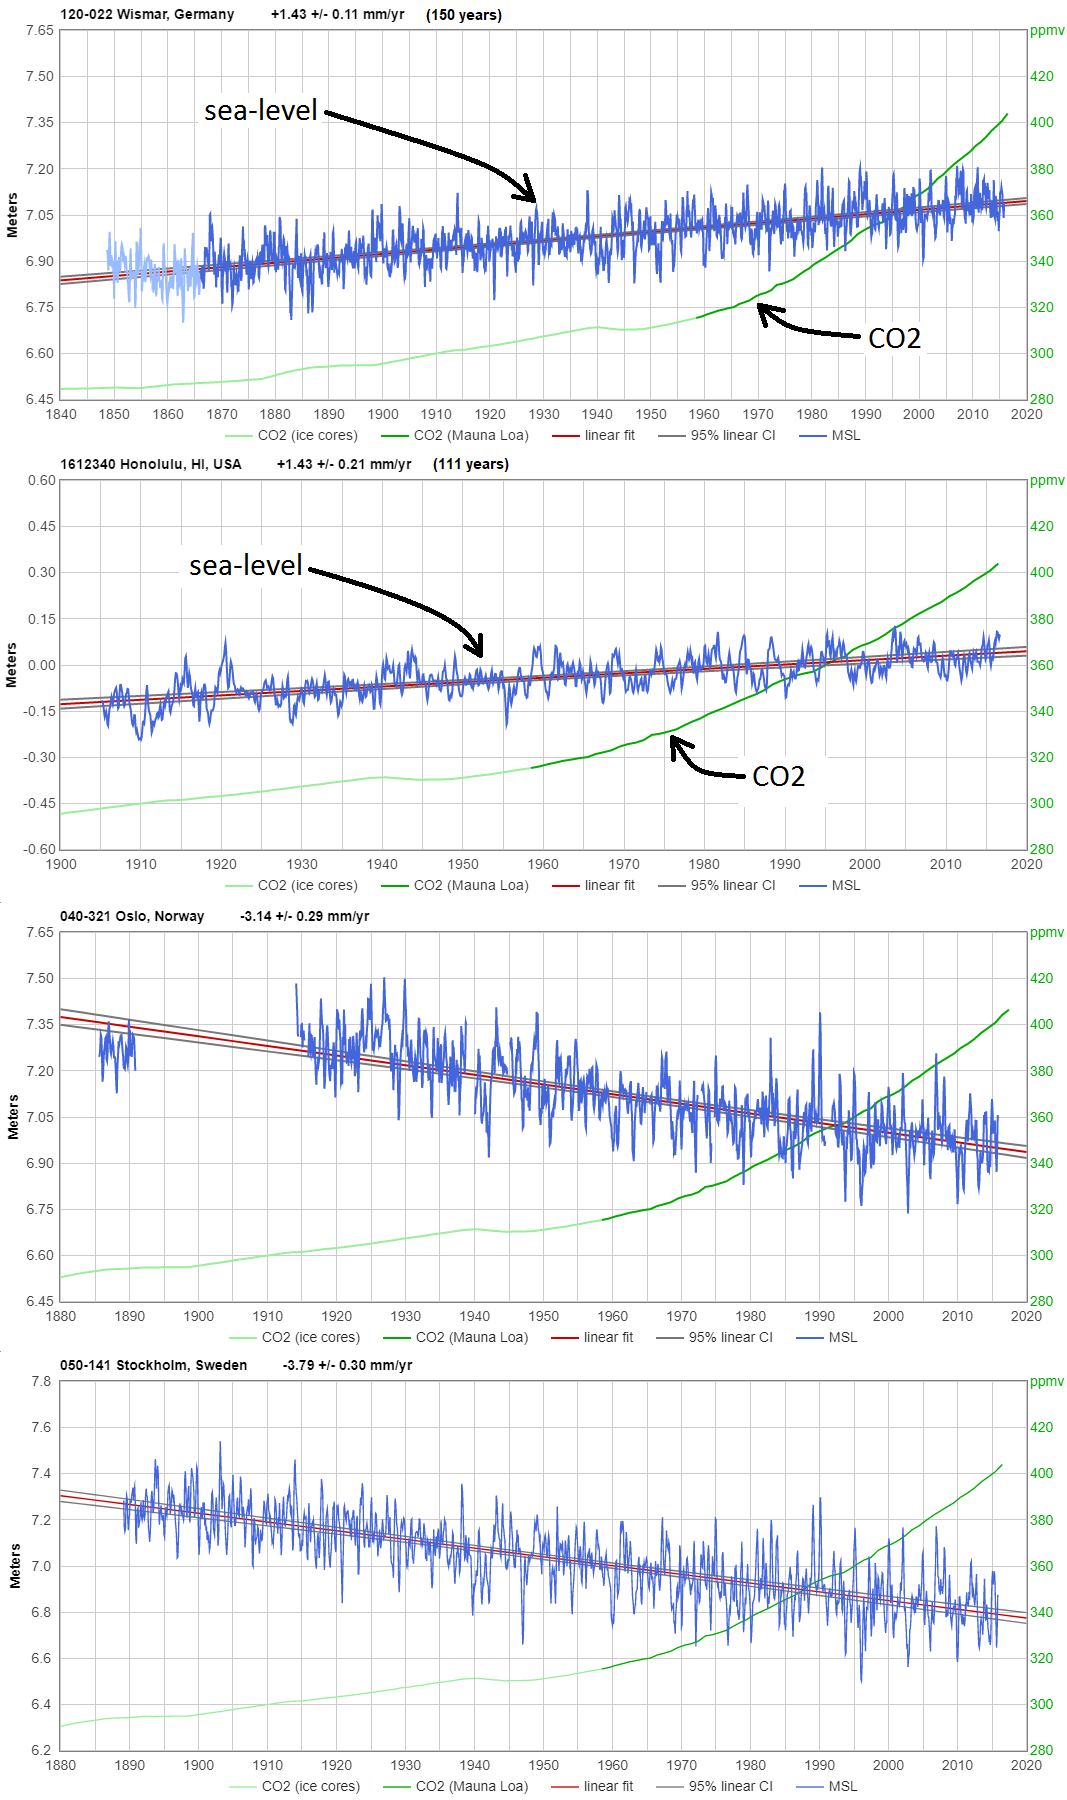
I visited the YouTube link for that video, and I was not surprised to see that, “Comments are disabled for this video” — no doubt to prevent “science deniers” from posting things like these graphs:
http://sealevel.info/Wismar_Honolulu_Oslo_Stockholm_vs_CO2_annot1.png
A good fun video to watch:
It’s for these reasons why I don’t put any stock into satellites being able to measure sea level rise with ANY accuracy.
It has also been suggested that the crust and mantle bulge up in front of the advancing continental ice sheets, further complicating the geometry and calculations of basin deformation.
Lastly, it can be expected that as the volume of water in the oceans increases, the weight of the overlying water will depress the oceanic crust, deepening the basins, with a commensurate bulge under the edges of the continental crust.
“It has also been suggested that the crust and mantle bulge up in front of the advancing continental ice sheets”
More than suggested. The existence of “forebulges” is extremely well documented, and also that they sink back as the depression under the former ice sheet fills up. A lot of the sinking of the Eastern US seabord is due to this effect. This is how it works in Northern Europe, based on actual measurements:
Strange that people along the East Coast from NJ to FJ and in Hawaii built their homes where king tides causes flooding – but then, if you believe Dr. Ball, natural processes have acted over the course of decades to cause greater coastal inundation in various places all over the world. So is Hawaii sinking?
Hawaii is rising, as shown in my first comment.
Sea level has been two or more meters higher earlier during the Holocene, and more during the Eemian interglacial, than now.
Jimi Henrix sang of castles made of sand falling into the sea eventually. That’s CAGW in a nutshell (with lots of nuts).
Part of the problem is Federal Flood Insurance which encourages people to live in flood prone areas.
Where I live, sea level is falling.
https://wattsupwiththat.com/2017/04/05/falling-sea-level-the-critical-factor-in-2016-great-barrier-reef-bleaching/
There is a big push from some regional coucils to develope plans to cope with falling sea level. They don’t listen to local scientists. Not convenient. There is a LOT of money available in Australia for Green issues, rent seakers miss out if the models they use are proven wrong.
This is long standing. My little beach house sits on sandy dirt fromn a time when sea levels were higher, I live only a meter above king tides. If any of the Green models were correct, I would be in trouble. IThe drift is long standing.
https://queenslandcoast.blogspot.com/2014/12/mangroves-in-sky.html
The cause has nothing to do do with climate change. Australia is hurtling north, causing big issues along the northern plate boundry.
https://news.nationalgeographic.com/2016/09/australia-moves-gps-coordinates-adjusted-continental-drift/
Another problem is that the Earth is a gravitational geoid, with verying gravity gradients around the planet. The result is that the sea around Britain is 140 m higher than the sea in the Carribean, when measured from the center of the Earth. And no, you cannot sail downhill, as it is held there by gravity.
These gravitational anomolies do not effect tide-gauge measurements and can be measured by the GOCE and GRACE satellites. However, it makes sea-level satellite measurements much more difficult, as those satellites don’t react quickly enough to mirror these gravity anomalies.
The Earth is a gravitational geoid.
The map represents the surface of an ideal sea covering the entire Earth. But does not exactly reflect the real sea, as the sea is not level (as mentioned in this article) and the sea does not have the same density. Nevertheless you can see that the sea level is much higher near to Europe, than around the Florida coastline.
https://m.youtube.com/watch?v=ThcMzqlSwYo&time_continue=46
Sea level rise at the estimated 20 -30 cm per century is a challenge in many coastal areas where it may accelerate erosion and increase the risk of floods. Sinking of land levels is another threat. Sea level rise is a very real threat whether or not humans are involved in causing it but is is manageable in most areas.
Dr Ball; so comprehensive. Thank you!
Thanks for this overview, Tim. It neatly illustrates how difficult it is to accurately measure sealevel. However, should a liter of water be added to every square meter of sea it would be reasonable to assume that the average sealevel rises, on average and in the long run, by 1 mm.
For instance, the sealevel rise in the North Sea has been 1.9 mm/yr for at least the last 140 years. That’s 19 cm per century. Of that rise, 3 cm is attributed to the sinking of the land. The Low Countries are smack bang sitting on a geosyncline where the accumulated sediments eroded from the Alp mountain range slowly but steadily press the underlaying crust downwards. From this one may conclude that the sealevel in the North Atlantic, with which the North Sea is in wide open connection has increased by 1.6mm/yr during the last century.
Why do the oceans not drain away through the cracks in the earth as caused by plate tectonics?
“much of the ice is already in the ocean, so it won’t add to the level. In fact, if we only consider that portion, then sea level will go down because water expands by about 9% when it freezes, the space occupied by the ice below sea level will hold 9% more water. Similarly, ice above sea level will produce 9% less water by volume. ”
The actual rise or fall will depend on the total salinity of the ice that is floating on the water.
Sea Level Rise; A Major Non-Existent Threat Exploited by Alarmists and Politicians
Yes.
I have not had a chance to finish the article, but want to point out that the noted temp range of 0 to 4 degrees as being of particular importance, and distinct from the volumetric change with temp of the rest of the temperature scale of water…applies to fresh water only.
The numbers are different for saline water, and the amount by which they are different varies with the salinity.
This is not a trivial matter…it is key to understanding several very important phenomena.
http://linkingweatherandclimate.com/ocean/figs/density2.png
Pressure (and most seawater is under pressure) is much more important than salinity. Density for seawater under pressure follows a straight curve for all temperatures.
http://www.csgnetwork.com/water_density_calculator.html
Kip Hansen wrote an excellent series
of articles on sea level posted here in 2017 and 2018:
— I think there were five articles in total,
with the last one in early 2018.
I saved all of them.
They are worth reading and saving.
Also, of the approximate 400 foot sea level rise
in the past 20,000 years,
since the peak of the last glaciation,
at least 399.5 feet of the rise
was NOT caused by CO2 warming,
and possibly closer to 400 !
My climate blog:
http://www.elOnionBloggle.Blogspot.com
In addition to all the major sea level differences mentioned in the article, ocean waves themselves represent a difference on a square meter by square meter basis that is larger than a centuries worth of rise. I argue that a chaotic surface like the oceans cannot be measured with the precision claimed.
Aren’t we talking about average sea level here? You stated that the Atlantis and Pacific sides of the panama canal are different levels. Is the Atlantic always higher, or is the Pacific always higher? I suspect they eventually average out… From all I have seen here on WUWT, it seems to me that the average global sea level rise is about 7 inches per century (or 5-8 inches), and that there is no acceleration in recent years. I’m I wrong?
Dr. Ball,
The link to the Court case (http://www.cpi.cam.ac.uk/gore/pdf/Al%20Gore%20ruling%20-%2010%20Oct.pdf) is broken (server is gone).
I did find a copy here: http://23dd.fr/documents/references/Climat/Al_Gore_ruling_-_10_Oct.pdf
Very interesting article. The discussion of storm surges gave me an insight. It occurs to me that a lot of people who argue with me about sea level rise supposedly causing coastal erosion are probably just observing the effects of storm surges. Over time, even if sea level were slowly falling, periodic storm surges are going to produce more and more erosion. The only thing to stop that is the next ice age.
This is the solution to protect Florida from, Sea level rise and Hurricane:
https://youtu.be/tRn4eUQ3ewY
Adapting the Mediterranean to the sea level rise:
https://youtu.be/9bbFyKE2DWw
#PresaPuente
(to the tune of WCFTCOTE)
Which come first, rising ocean or the wave?
Which come first, sinkhole or the cave?
Storm surge and tsunami
grind your city to pastrami
while you’re waitin’ for the sea to rise a smiiiidge!
Which come first, ‘climate’ or the storm?
Which come first, ‘weather’ or the norm?
There’s nothin’ like disaster
to make lawyer fees rise faster
Hey there! Mr. forecaster, serve some doooom!
Global Average sea level is rising at the rate of around 3.2mm per year based on the current estimates. It flattened out for a couple of years perhaps due to changes in global precipitation, but is rising again. It would be hard to argue the rate of rise won’t speed up as the Global Mean Temperature increases.
https://climate.nasa.gov/vital-signs/sea-level/
Yeah, just observing that over the past few centuries, the trend is a slightly variable nearly linear curve. So obviously it’s primed to accelerate and diverge from that. Any day now. Because CO2.
Head for the hills, they might increase the adjustments and we’ll all drown.
How exactly does global precipitation go down when temperatures didn’t really pause? Fascinating. Also wondering where the water is supposed to be coming from if not from the oceans? How could precipitation impact sea level in the first place? Unless you’re arguing that there was a big drop in sublimation from glaciers. But then we’re back to my first question, aren’t we?
“How exactly does global precipitation go down when temperatures didn’t really pause.?”
https://phys.org/news/2012-10-la-nina-global-sea.html
Let me get this straight. The claim is that for 18 months, from the start of 2010 until the middle of 2011, the rain in Spain fell mainly on the plain? And it just took its time flowing back to the sea. By George, I think I’ve got it.
“This occurred concurrently with the La Niña phase of the El Niño–Southern Oscillation (ENSO).”
Lovely correlation equals causation.
“Yeah, just observing that over the past few centuries”
Not really sure what you are talking about there – do you have a reference?
“they might increase the adjustments”
Who are “they”?
Not really sure about your last paragraph because it contains rhetorical questions/is a Gish Gallop. But if you are asking where can the water go, it rains or snows out over land and can take a while to get back to the sea – his tends to happen during La Ninas which can enhance precipitation over the continent of Australia.
You can find some examples of the trend here:
https://wattsupwiththat.com/2016/05/28/2015-updated-noaa-tide-gauge-data-shows-no-coastal-sea-level-rise-acceleration/
and also posted by Dave Burton in the comments for this article.
Looks like it’s NOAA data.
And I suppose that you expect me to believe that you’re unaware that the sea level numbers are adjusted. My comments relate to this article that you presumably read before posting on it. I suppose that “they” would again be NOAA.
“It’s important to note that this estimate is with an uncertainty of 3-4 mm. This is important because the IPCC claim, “For the period 1993 to 2003, the rate of sea level rise is estimated from observations with satellite altimetry as 3.1 ± 0.7 mm yr-1.” But what are they actually measuring? It is the average variation of sea level relative to an imaginary line called the reference ellipsoid. Potential for error exists in determining the ellipsoid, the height of the satellite, in the actual measurements, and in the changes going on in the ocean and on the land. Frankly, it is useless to even talk about millimeter changes. There are so many inputs, and so many adjustments that the final results claimed are unjustified.”
That is a great picture of the dutch coastal town West Kapelle. ….kudos.
Then, there is the elephant in the room; the argument about WHY the politics for global warming was needed in the first place.
Over the centuries, it has been the strategy of mischievous tyrannical monarchists and globalists to be prepared to move on any opportunity where they can take advantage of economics, legitimate wars, weather, etc, to widen the gap between their ilk and intentionally dumbed down peasantry; those who never get the memos. In the case of the Battle of Waterloo, the Rothschild family didn’t mind lying when they allowed their messenger to cross a stormy sea on the English Channel to bring the news to the London stock market that Napoleon had won at Waterloo. Of course, Napoleon LOST at Waterloo, but the word of that came AFTER the Rothschilds had purchased enough stock during the sell-off to assume control of England’s economy, because the value of those stocks hadn’t really changed.
AGW is but another scheme concocted by the globalists to create such a situation, a GLOBAL situation, where that gap could be forever cut in stone once the Carbon Taxes were imposed, and indeed, as Lord Moncton’s researcher unearthed from the bowels of the IPCC text, Carbon Taxes were the whole point of the AGW argument.
As we have seen, since all this nonsense had been foisted upon the gullible masses, the globalists; along with their dysfunctional entourage of ethically challenged useful idiots like the Bushes, the Clintons, Gore, Obama, Gates, Zuckerberg, and Bezos and so many others, have no shortage of treasonous Igors to do the nasty biddings of the King.
While all this was playing out in the press, the Deep State was pushing the geo-engineering program under the guise of increasing the Earth’s albedo, when in fact, the deposition of metallic salts in the atmosphere had quite the opposite effect. What it actually did was retard the rate at which the Earth could naturally reradiate the Sun’s radiation back to space as infraRed. Thus, while the hidden memo suggested that we were at age end of a warming cycle, the globalists would use this opportunity to hoodwink the ignorant into thinking that the situation was so dire that whole islands would sink before dinner tomorrow night. And no group swallowed the hook more than the Left, just like the globalists of over 100 years ago knew that the Left would be the easiest to convert to a communist dictatorship under the guise of democracy, socialism, and progressivism. All along, the point has been about returning to a state of feudalism, where no one but the king(s) were allowed to own land. And of course, this goes hand in hand with the mission of the CFR and the myriad of treasonous Charitable Foundations which have openly stated that their goal is to dissolve the US Constitution.
So this political nightmare is what is at the heart of AGW and why they have been pushing so hard to get it pushed through. Is there any merit at all to their argument. Maybe a little bit; I mean, we have been lousy planetary stewards, but then, look who has been calling all the managerial shots while this has been going on; ….. the same cast of dysfunctional characters pushing the AGW and who are still flying all over the globe in their private jets without a care in the planet, itself. If there was really all this concern about the welfare of the planet, why have our speed limits crept up to 70 instead of being rolled back to 55mph over the last 40+ years?
Pardon my lack of brevity.
When AlGore first presented his AGW propaganda, my first reaction way back then was to assume he was lying until proven otherwise…he looks like and acts like and is a liar…and a hypocrite that got all of his wealth and power by NOTHING he ever did (all silver spoon). The Nobel Committee deserves NO MORE LEGITIMACY after Gore and Obama. I have no respect for the Nobel thingy (what ever it is) any more.
None of Gore’s short term prognostications have come true and (by extrapolation of data) none of his long term predictions have any chance of becoming reality…by 1 or 2 orders of magnitude.
If the universe has any inclination towards ultimate justice, the PDO and AMO will both turn negative in the next decade, and the next 3 decades will be beset by significant global cooling…and the rush will be on to build about 8000 to 10,000 coal fired and nuclear power plants…and AWG will be mentioned only derogatorily and parenthetically forevermore.
A couple of technical slips :-
“It is called a set-up” – I think that this should be a seiche
“winds blowing over a stretch of water called a reach” I think that should be a fetch
Thanks Dr Ball.
I work with tide gauges all the time, now having moved on to RTK GPS derived water level I have struggled to see how sea level can be measured to mm accuracy, ± 0.7 mm yr-1 seems ridiculous to me, I would be lucky to measure local tidal height to within 3 to 4 cm and I would say that was good.
What are the accuracies quoted for the altimeters of the satellites?